-
Paper Information
- Next Paper
- Previous Paper
- Paper Submission
-
Journal Information
- About This Journal
- Editorial Board
- Current Issue
- Archive
- Author Guidelines
- Contact Us
International Journal of Composite Materials
p-ISSN: 2166-479X e-ISSN: 2166-4919
2014; 4(5A): 27-34
doi:10.5923/j.cmaterials.201401.04
Compression Properties and Cellular Structure of Polyurethane Composite Foams Combining Nanoclay and Different Reinforcements
 Abstract
 Reference
 Full-Text PDF
 Full-text HTML
Marcelo Antunes, Álvaro Cano, Vera Realinho, David Arencón, José Ignacio Velasco
Centre Català del Plàstic, Departament de Ciència dels Materials i Enginyeria Metallúrgica, Universitat Politècnica de Catalunya BarcelonaTech (UPC), Terrassa, Spain
Correspondence to: José Ignacio Velasco, Centre Català del Plàstic, Departament de Ciència dels Materials i Enginyeria Metallúrgica, Universitat Politècnica de Catalunya BarcelonaTech (UPC), Terrassa, Spain.
| Email: |  |
Copyright © 2014 Scientific & Academic Publishing. All Rights Reserved.
In the present work we prepared and characterized several polyurethane (PU) composite foams by combining variable concentrations of nanoclay (montmorillonite, MMT) with metal wires or low cost cellulosic-based reinforcements, with the objective of developing multi-scalar rigid foams for structural applications. The addition of MMT promoted foaming and the formation of finer and more homogeneous cellular structures, resulting in foams with compressive elastic moduli and collapse stresses lower than that of the unfilled PU foams. However, a comparative analysis versus the foams’ relative density demonstrated that both mechanical properties follow one single trend for the two materials. The combination of MMT and the macroscopic metal wires or cellulosic-based reinforcements further reduced the cell size of foams and resulted in foams with similar compressive collapse strengths as the unfilled ones for considerably lower relative densities, hence demonstrating their effectiveness as mechanical reinforcements of rigid PU foams and opening up new possibilities in terms of developing low cost lightweight materials.
Keywords: Polyurethane foams, Multi-scalar, Montmorillonite, Steel wires, Cellulosic-based reinforcements
Cite this paper: Marcelo Antunes, Álvaro Cano, Vera Realinho, David Arencón, José Ignacio Velasco, Compression Properties and Cellular Structure of Polyurethane Composite Foams Combining Nanoclay and Different Reinforcements, International Journal of Composite Materials, Vol. 4 No. 5A, 2014, pp. 27-34. doi: 10.5923/j.cmaterials.201401.04.
Article Outline
1. Introduction
- Rigid foams based on polyurethane (PU) formulations represent one of the most important types of polymer foams in terms of consumption, being widely used as lightweight cores in sandwich-like structures for structural applications as well as for thermal insulation [1]. Due to a good combination of specific mechanical properties, some of the main uses of rigid PU foams include sealing of doors and windows, as well as boards and panels in combination with rigid wood or metal outer skins. They are also used as impact absorbers in cars and trains [2].The formation of PU foams is based on the chemical reaction of two basic components: a polyol or more commonly a mix of polyols, water and other processing additives, and an isocyanate, which, depending on the formulation, ultimately regulate the final characteristics and properties of the foam. Foaming is achieved due to the in-situ formation of a blowing agent (CO2) simultaneous to polyurethane’s polymerization. Depending on the proportions and characteristics of both basic components, a wide variety of PU foams may be obtained in terms of final density and cellular structure, and thus mechanical properties. Also, it is relatively easy to incorporate mechanical reinforcements, as both isocyanate and polyol(s) are liquid at room temperature [3].The incorporation of nanometric-sized reinforcements or their combination with more conventional micrometric-sized fibrous-like reinforcements could solve some of the problems inherent to the loss in mechanical performance due to foaming. A great deal of recent research has considered the addition of layered nanosized particles for regulating the mechanical properties of rigid PU foams. From the several commercially available nanosized layered particles, silicate-layered clays such as montmorillonite (MMT), both in their unmodified and organically-modified forms, have been the most considered ones [4]. It has been demonstrated that the incorporation of said nanoreinforcements may lead to foam improvements in thermal stability and tensile strength when compared to the unfilled counterparts even at low filler concentrations [5-9]. These results are mainly explained on the basis of a combination of a finer and more uniform cellular structure of the resulting PU foams promoted by the well-dispersed clay nanoplatelets (heterogeneous cell nucleation effect) and their effectiveness as mechanical reinforcements. Organically-modified clay platelets have even been shown in some cases to act as auxiliary blowing agents for PU foams, promoting the formation of even lighter foams [4,6].Likewise, there is a great deal of interest regarding the development of environmentally-sustainable lightweight polymer composites reinforced with fibres, fabrics or wools obtained from renewable sources, mainly derived from cellulose [10-11]. These cellulosic-based reinforcements possess a number of advantages besides their renewable nature, such as reduced cost, good thermal and acoustic insulating properties, as well as good combination of high flexural and tensile moduli [12]. We have already shown that the incorporation of esparto wool, a type of cellulosic-based material, to PU foams had a significant effect in the final characteristics of the foam, promoting the formation of finer cellular structures, especially when combining esparto with small amounts of MMT (multi-scalar reinforcement) [13]. Though worse in terms of the absolute values of the compressive collapse strength due to their higher open-cell contents, PU foams reinforced with esparto and MMT displayed a less abrupt decrease of the collapse strength with decreasing relative density, as well as higher values of thermal conductivity, hence showing promising results as possible lightweight materials for structural applications. Additionally, if a higher thermal conductivity is required, metal filaments can be employed as thermally conductive reinforcement.With the previous information in mind, in the present article we study the cellular structure and the compression behaviour of series of rigid PU composite foams prepared with multi-scalar reinforcements based on different combinations of metallic wires and cellulosic-based reinforcements, particularly esparto wool, cellulose pulp and cardboard paper, with layered silicate nanoparticles, with the final objective of developing structural lightweight materials.
2. Experimental
2.1. Materials
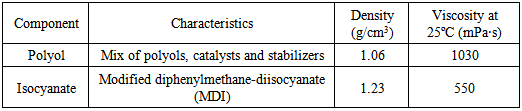
- A two-component polyurethane (PU) system specifically formulated for the preparation of medium-high density rigid PU foams was supplied by BASF Poliuretanos Iberia S.A. (Rubí, Spain), in which the polyol was Elastolit D8241, a mixture of polyols, catalysts and stabilizers. Both components are liquid at room temperature.Basic characteristics of the two components are presented in Table 1.
|
|
2.2. Composite Preparation
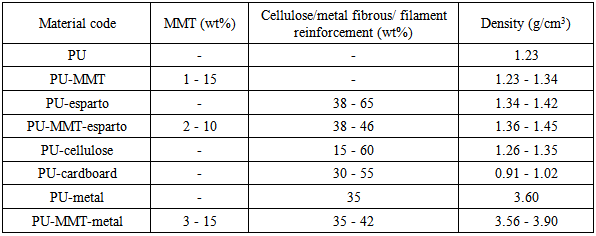
- Composite foams were prepared by initially pouring a mixed blend of the polyol and isocyanate components in an open cup mould (typical mixing time of 20 s), closing the mould and allowing PU’s simultaneous polymerization and foaming (consult [13] for further details). In the case of MMT-reinforced foams, the organically-modified montmorillonite was mixed at high speed during 5 min with the polyol prior to pouring into the mould. For PU foam preparation with the cellulosic-based reinforcements, the esparto wool, cellulose pulp or cardboard paper was previously placed inside the mould. After the simultaneous polymerization and foaming inside the closed mould, it was opened and the foam de-moulded. Samples were prepared for compressive measurements by machining circular cross-section samples with typical values of diameter of 24 mm and variable thicknesses between 12 and 17 mm, and removing the integral solid outer skins generated during foaming.
2.3. Testing Procedure
- The density of the solid composites and foams was measured according to ISO 845. The cellular structure of the foams was analyzed using a JEOL JSM-5610 scanning electron microscope. The average cell size
 and cell nucleation density (Nf) were obtained using the intercept counting method [14]. Particularly, the cell nucleation density, in cells/cm3, was calculated according to:
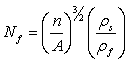 | (1) |
 and
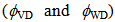
and  are respectively the solid and foam densities.Two cell sizes were determined according to foam direction:
  where VD is the vertical foaming growth direction and
  (WD: width direction). The compression tests were performed on the cylindrical specimens using a Galdabini SUN 2500 testing machine with a 25 kN load cell at a constant speed of 5 mm/min according to ISO 844. The compressive elastic modulus (E) and collapse strength
  were calculated from the stress-strain curves. In order to compare cellular materials with different densities and compositions, the elastic modulus and collapse strength of the foams were represented as a function of relative density. The energy absorbed till a constant deformation value of 60% was also determined by direct integration of these curves until said deformation.
 3. Results and Discussion
3.1. Cellular Structure Characteristics
3.1.1. PU Foams Containing Nanoclay and Metallic Wires
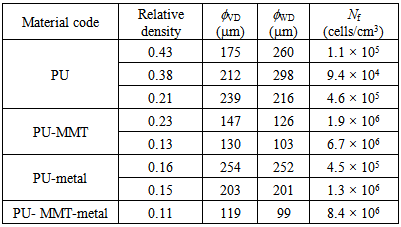
- The values of relative density and main cellular structure characterization parameters of PU foams containing nanoclay and steel wires, particularly the cell size in both foaming directions
 and cell nucleation density (Nf), are summarized in Table 3. Representative micrographs of the PU, PU-MMT, PU-metal and PU-MMT-metal foams are presented in Figure 1.
|
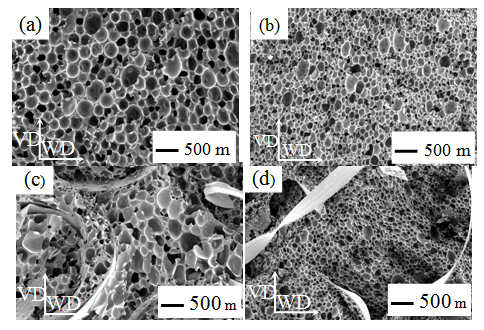 | Figure 1. Typical scanning electron micrographs of (a) PU, (b) PU-MMT, (c) PU-metal and (d) PU-MMT-metal foams |
 for relative densities around 0.1.
3.1.2. PU Foams Containing Nanoclay and Cellulosic-based Reinforcements
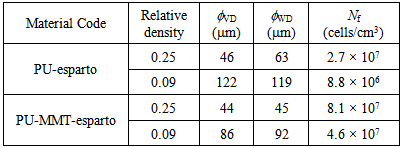
- The main cellular structure characterization parameters of PU foams reinforced with MMT, esparto and a combination of MMT and esparto are presented in Table 4.
|
 for expansion ratios, defined as the reciprocal of relative density, higher than 10 (see typical micrographs presented in Figure 2).
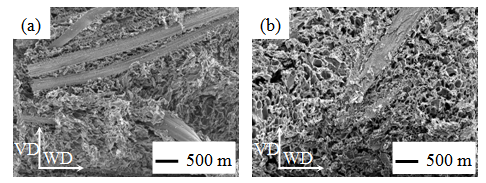 | Figure 2. Typical scanning electron micrographs of (a) PU-esparto and (d) PU-MMT-esparto foams |
3.2. Compression Behaviour
- A typical stress-strain compression curve of a PU composite foam is presented in Figure 3, together with the three analyzed parameters, each one referring to a characteristic zone of the curve: Zone I (low strains), corresponding to the linear stress-strain region and characterized by the elastic modulus (E); Zone II (plateau), corresponding to the collapse region and characterized by the collapse strength
 and Zone III of material densification (solid-like behaviour), in this case characterized by the absorbed energy till 60% deformation.
 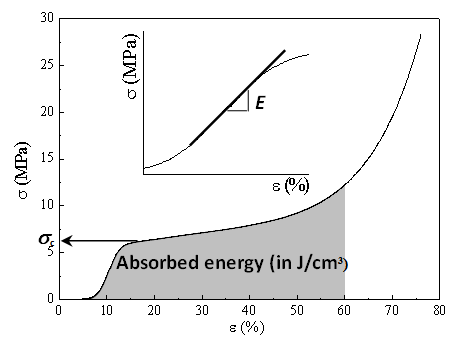 | Figure 3. Typical compression curve of a PU composite foam showing the three analyzed parameters: elastic modulus (E), collapse strength  and absorbed energy till 60% deformation and absorbed energy till 60% deformation |
3.2.1. PU Foams Containing Nanoclay and Metallic Wires
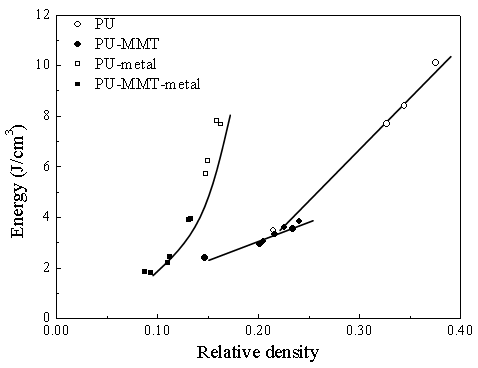
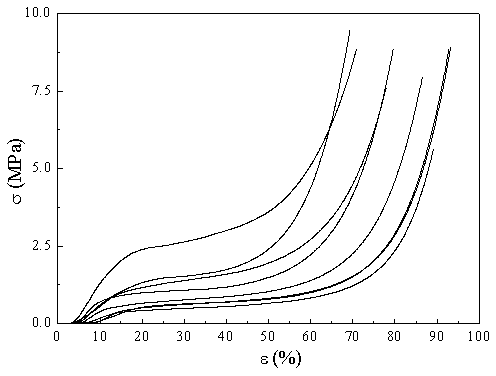
- Characteristic compression curves of PU composite foams containing steel wires and a combination of nanoclay and steel wires are respectively presented in Figure 4 and 5.The values of the compressive elastic modulus (E), collapse strength
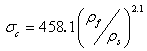
 and absorbed energy till 60% deformation (in J/cm3) of the several PU composite foams reinforced with nanoclay and steel wires obtained from the compression tests are represented as a function of relative density respectively in Figures 6, 7 and 8.
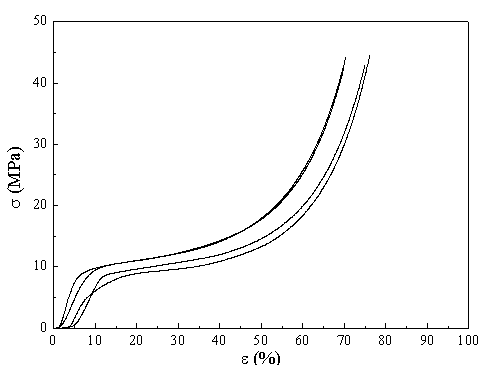 | Figure 4. Characteristic compression curves of PU composite foams containing steel wires (PU-metal) |
 | Figure 5. Characteristic compression curves of PU composite foams containing nanoclay and steel wires (PU-MMT-metal) |
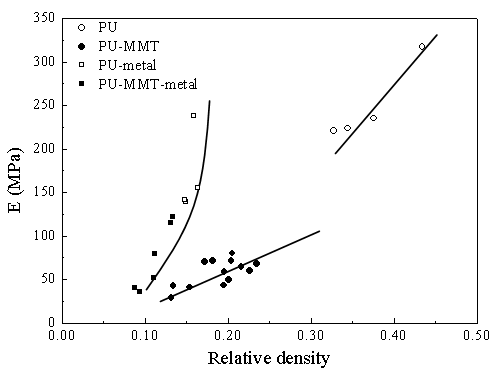 | Figure 6. Compressive elastic modulus (E) vs. relative density for the PU composite foams containing nanoclay and steel wires |
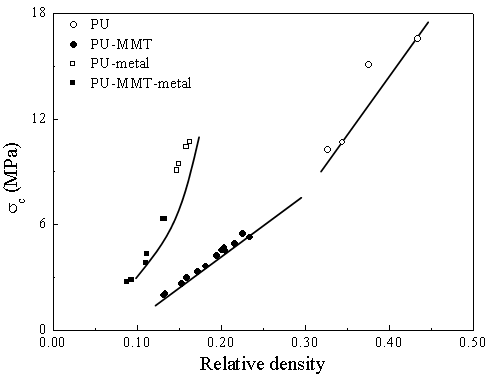 | Figure 7. Collapse strength  vs. relative density for the PU composite foams containing nanoclay and steel wires vs. relative density for the PU composite foams containing nanoclay and steel wires |
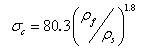 | (2) |
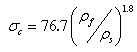 | (3) |
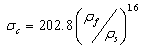 | (4) |
 | (5) |
 | Figure 8. Absorbed energy till 60% deformation vs. relative density for the PU composite foams containing nanoclay and steel wires |
3.2.2. PU Foams Containing Nanoclay and Cellulosic-based Reinforcements
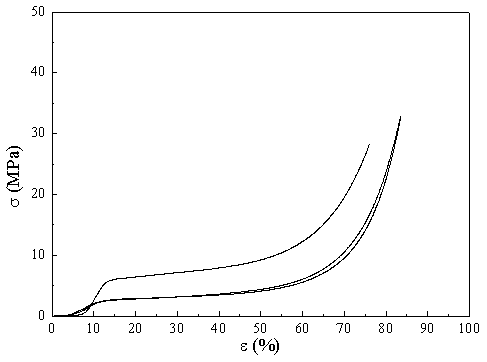
- Characteristic compression curves of PU composite foams containing esparto and a combination of nanoclay and esparto are respectively presented in Figures 9 and 10.
 | Figure 9. Characteristic compression curves of PU composite foams containing esparto (PU-esparto) |
 | Figure 10. Characteristic compression curves of PU composite foams containing nanoclay and esparto (PU-MMT-esparto) |
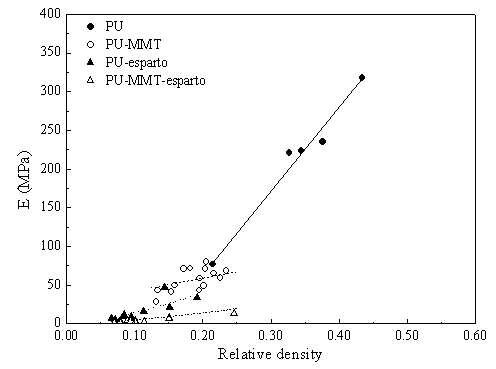 | Figure 11. Compressive elastic modulus (E) vs. relative density for the PU composite foams containing nanoclay and esparto |
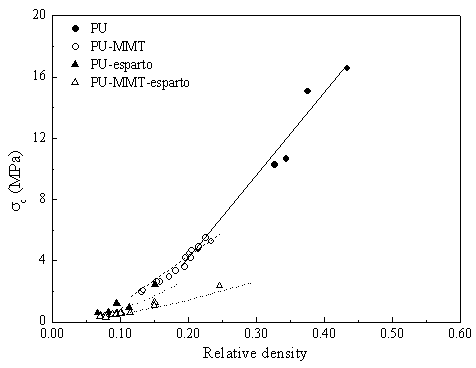 | Figure 12. Collapse strength  vs. relative density for the PU composite foams containing nanoclay and esparto vs. relative density for the PU composite foams containing nanoclay and esparto |
 i.e., the collapse strength divided by the density of the foam, of PU foams reinforced with cellulose and cardboard are presented in Figure 13 as a function of relative density.
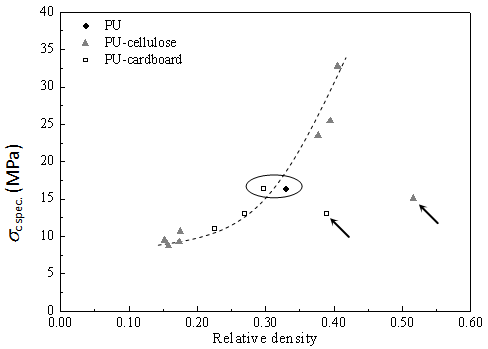 | Figure 13. Specific collapse strength  vs. relative density for the PU composite foams reinforced with cellulose and cardboard vs. relative density for the PU composite foams reinforced with cellulose and cardboard |
 one can see the reinforcement effect promoted by cardboard. As indicated by the circle included in Figure 13, PU foams reinforced with cardboard presented similar specific collapse strengths than the unfilled PU foam even for lower values of relative density.
 4. Conclusions
- This paper presents the preparation and characterization of the cellular structure and compression properties of rigid polyurethane composite foams reinforced with multi-scalar reinforcements based on the combination of variable concentrations of a nanoclay with different macroscopic reinforcements, particularly tangled steel wires and cellulosic-based reinforcements, with the goal of developing foams for structural applications.The incorporation of small amounts of MMT resulted in foams with lower relative densities and finer and more homogenous cellular structures, related to a cell nucleation effect promoted by the MMT platelets. This cell size reduction effect was even more pronounced with adding steel wires and esparto and mostly when combining the metal reinforcement or esparto with MMT, demonstrating the high cell nucleation effect promoted by the multi-scalar reinforcements.Polyurethane foams with MMT followed a similar compressive mechanical behaviour with varying relative density as the unfilled PU foams, with the advantage of their globally lower relative density, hence MMT addition satisfactorily extending the relative density range of rigid PU foams and thus possible applications. While the addition of MMT resulted in foams with a smoother increment of the mechanical properties with varying relative density, the incorporation of the metal wires resulted in much more abrupt trends, as well as in foams with considerably higher absolute collapse strengths for similar relative densities. Regarding the absorbed energy, PU-metal foams displayed values that were 3 times higher than that of PU foams without metal wires, demonstrating the importance of the metal reinforcement in attaining foams with a higher toughness.On the other hand, the addition of esparto promoted excessive elastic buckling during compression, limiting the mechanical effectiveness of the foamed PU matrix. On the contrary, cellulose pulp and cardboard paper led to foams with increasingly higher collapse strengths with increasing the concentration of reinforcement till a critical value, above which the collapse strength started decreasing. PU foams reinforced with cardboard presented similar specific collapse strengths as the unfilled PU foam at lower relative densities, demonstrating the effectiveness of these low cost cellulosic-based materials as mechanical reinforcements of PU foams.The results presented in this work demonstrate the possibilities of combining multi-scalar reinforcements based on silicate-layered nanoclays and macroscopic metallic or cellulosic-based materials into polyurethane foams with the objective of developing low cost structural lightweight materials.
ACKNOWLEDGEMENTS
- The authors would like to acknowledge the Spanish Ministry of Economy and Competitiveness for the financial support of project MAT2011-26410.