-
Paper Information
- Next Paper
- Previous Paper
- Paper Submission
-
Journal Information
- About This Journal
- Editorial Board
- Current Issue
- Archive
- Author Guidelines
- Contact Us
International Journal of Composite Materials
p-ISSN: 2166-479X e-ISSN: 2166-4919
2014; 4(5A): 1-9
doi:10.5923/j.cmaterials.201401.01
Surface and Subsurface Defects Detection in Impacted Composite Materials Made by Natural Fibers, Using Nondestructive Testing Methods
 Abstract
 Reference
 Full-Text PDF
 Full-text HTML
Stefano Sfarra1, Nicolas P. Avdelidis2, Clemente Ibarra-Castanedo3, Carlo Santulli4, Panagiotis Theodorakeas2, Abdelhakim Bendada3, Domenica Paoletti1, Maria Koui2, Xavier Maldague3
1Las.E.R. Laboratory, Department of Industrial and Information Engineering and Economics, University of L’Aquila, L’Aquila, Italy
2NDT Lab, Materials Science and Engineering Department, National Technical University of Athens, Athens, Greece
3Computer Vision and Systems Laboratory, Department of Electrical and Computer Engineering, Laval University, Quebec City, Canada
4School of Architecture and Design, University of Camerino, Ascoli, Italy
Correspondence to: Panagiotis Theodorakeas, NDT Lab, Materials Science and Engineering Department, National Technical University of Athens, Athens, Greece.
| Email: |  |
Copyright © 2014 Scientific & Academic Publishing. All Rights Reserved.
In the present study, infrared vision and optical nondestructive testing (NDT) techniques were applied for the evaluation of emerging defects after artificially impacting composite materials reinforced with natural fibers. The samples were manufactured using wool felts and jute fibers inserted in an epoxy matrix. Infrared vision was applied by means of pulsed thermography (PT) and square pulsed thermography (SPT), evaluating two different thermal stimulation procedures; while the algorithms referred to as principal component thermography (PCT) and pulsed phase thermography (PPT) were used in order to enhance the information retrieval from the respective thermographic inspections. For comparison purposes, near-infrared reflectography (NIRR) and transmittography (NIRT), as well as laser speckle imaging techniques were also included. Additionally, ultraviolet (UV) imaging technique was used on the laminates both as complementary approach and as reference for future inspections. Two particular zones highlighted by the latter technique were characterized using an XRF spectrophotometer revealing a reverse concentration of the Al, Si and Cl elements. The results produced from the above comparative study confirmed the synergy of the applied techniques and further indicated that the methodology followed in the present research work can be considered as an innovative approach for the characterization of eco-friendly laminates after an impact loading.
Keywords: Infrared vision, Optical NDT techniques, Composite materials, Impact, Natural fiber, Emerging defects
Cite this paper: Stefano Sfarra, Nicolas P. Avdelidis, Clemente Ibarra-Castanedo, Carlo Santulli, Panagiotis Theodorakeas, Abdelhakim Bendada, Domenica Paoletti, Maria Koui, Xavier Maldague, Surface and Subsurface Defects Detection in Impacted Composite Materials Made by Natural Fibers, Using Nondestructive Testing Methods, International Journal of Composite Materials, Vol. 4 No. 5A, 2014, pp. 1-9. doi: 10.5923/j.cmaterials.201401.01.
Article Outline
1. Introduction
- The interest for natural-reinforced composites is growing rapidly due to their mechanical properties, low cost, processing advantages and low density, as well as for their superior environmental characteristics. The availability of natural fibers such as wool in Italy is a key factor for its popularity and also the fact that wool has some advantages over traditional reinforcement materials in terms of cost, density, renewability, recyclability, abrasiveness and biodegradability. The performance of the fiber reinforced composites mainly depends on the fiber, matrix and the ability to transfer the load from the matrix to the fiber [1].Among the NDT techniques used to identify emerging defects in composite materials after impacts, infrared thermography (IRT), Near Infrared Imaging (NIR), digital speckle photography (DSP) and speckle contrast seem very promising, while the results combination could minimize the false alarms and simultaneously provide more details about the subsurface defects or anomalies detected [2-4]. In addition, the UV imaging technique applied for the inspection of composite materials including natural fibers is also very interesting, as it can be used for instance, to retrieve information about the inner defects due to aging [5]. The main aim of this work was the study for the correlation of results from the aforesaid techniques on an integrated NDT methodology, evaluating the defect detectability enhancement through the combination of different testing procedures. Moreover, the UV imaging technique combined with the X-ray fluorescence (XRF) spectroscopy technique used in this research work, for the first time to the best of our knowledge, as an integrated approach to characterize the execution of the external matrix layer. After a brief description of the methods used in the present study, experimental results coming from the inspection of the eco-friendly laminated composites are discussed and analyzed.
2. Nondestructive Testing Methods
2.1. Speckles and Speckle Contrast Techniques
- Speckle flow techniques [6] are based on the changes over time of the dynamic speckle pattern, generated by motion in the sample. Through these techniques, the speckle pattern changing is recorded with a camera and the level of blurring is quantified by the speckle contrast C [7]. Among these techniques, laser speckle imaging (LSI) by calculating the contrast based on one pixel in a time sequence, rather than based on multiple pixels in one image [8] and by properly adjusting the capture parameters (e.g., exposure time, incident power, and time interval between subsequent capture), it can reveal structures that are hidden under the surface [9]. On the other hand, a digital/electronic version of speckle photography for the evaluation of displacements fields is this of Digital Speckle Photography (DSP). Data interpretation in DSP is based on the cross-correlation analysis of two speckle patterns, one stored before and another after the object is deformed. In other words, this method follows the movement of a number of speckles, acting together as a sub-image. The displacement of all points within a sub-image is assumed to be constant and the two recorded sub-images are “compared” via a two-step FFT (fast Fourier transform) process, finding the displacement vector [10]. A very simple way to perform data processing by the cross-correlation approach is given by the possibility of using Particle Image Velocimetry (PIV) software with only minor modifications. In the present study, pattern displacements were evaluated using the correlation algorithms based on the MatPIV 1.6.1 [11]. Readers interested to understand more into depth this technique, can consult the Reference [12].
2.2. Near InfraRed Reflectography (NIRR) and Transmittography (NIRT)
- Near-infrared radiation (with wavelengths ranging from 1 to 3 μm) is able to greatly penetrate the top layer in composite material samples made by some natural fibers, enabling near infrared imaging as a valuable method on testing transparent and semi-transparent materials. This technique is based on the fact that part of the radiation is diffused, while the rest is reflected, making it possible to put in evidence some types of subsurface defects [13]. The main benefit of this method is its applicability in cases where infrared vision operated in longer wavelengths cannot provide reliable information for the inspected target and it can be applied in two different configurations, this of Near Infrared Reflectography (NIRR) and Transmittography (NIRT), respectively, depending on the position of the illumination source and the imaging device [3].
2.3. UltraViolet (UV) Imaging
- Ultraviolet reflectography involves irradiating the object of interest with UV radiation and recording the reflected radiation [14]. As with NIRR, the reflected UV light may be recorded using photographic or electronic devices and this technique is useful for providing information about surface details of several objects, visualizing the surface topology of an object without the light penetrating into the interior. Due to its short wavelength, it tends also to be scattered by surface features that are not apparent at longer wavelengths. Thus, ever smaller surface imperfections on a smooth surface can be detected via UV light, which may be undetected through other methods [15].
2.4. Pulsed Thermography (PT) and Square Pulse Thermography (SPT)
- In PT, also known as flash thermography, energy is applied to the sample’s surface through a thermal excitation of a brief duration and of high intensity. The applied energy creates a thermal front that propagates from the sample’s surface through its interior. During the cooling-down process the surface temperature decreases uniformly, until the thermal front intersects an interface of different thermal properties. This results in a small accumulation of heat above the flaw, that is also manifested at the sample’s surface and it can be detected by an infrared (IR) camera allowing damaged areas to be distinguished from pristine ones [16]. Recent works have started to explore ways to extend PT analysis over long square heat pulses and this method is called Square Pulsed Thermography (SPT) [17]. A very common approach to treat raw thermographic data, is through the use of advanced signal processing techniques. The application of these techniques is enhancing the produced detectability and among the different processing tools Pulsed Phase Thermography (PPT) and Principal Component Thermography (PCT) are quite robust providing promising results [18-20].
2.5. X-Ray Fluorescence (XRF) Spectroscopy
- XRF analysis is a powerful analytical tool for the spectrochemical determination of almost all the elements present in a sample [21]. XRF radiation is induced when photons of sufficiently high energy, emitted from an X-ray source, impinge on a material. These primary X-rays undergo interaction processes with the analysis atoms. High-energy photons induce ionization of inner shell electrons by the photoelectric effect and thus electron vacancies in inner shells (K, L, M …) are created. The family of characteristic X-rays from each element including all transitions allows the identification of the element. The working principle of XRF analysis is the measurement of wavelength or energy and intensity of the characteristic X-ray photons emitted from the sample, allowing the identification of the elements present in the analyte and the determination of their mass or concentration.
3. Experimental Procedures
3.1. Test Specimens
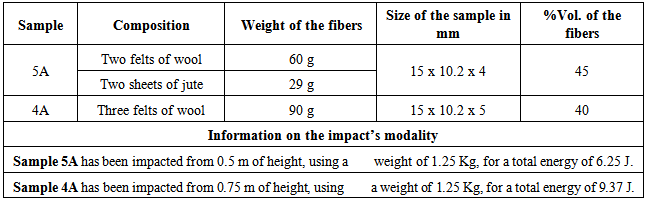
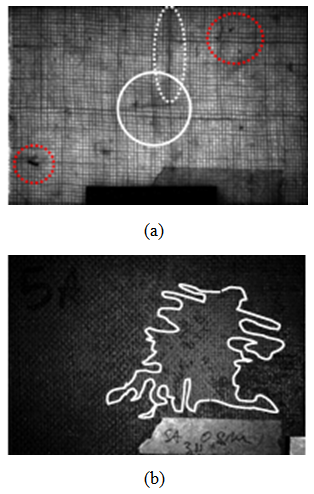
- In order to evaluate the information retrieval after the application of the above testing procedures for the inspection of eco-friendly laminated composites, experimental testing was carried in two different samples. In particular, the examined laminates were produced by hand lay-up and compression in a closed mould of dimension 260 x 160 mm at room temperature under slight pressure (around 0.02 MPa) for 2 hours. Sample 5A was produced after sandwiching two wool felt layers of weight 700 g/m2 between two skins made of jute plain weave tissue (hessian cloth) of weight 320 g/m2 and using an epoxy resin (Mates SX 10 ver.2 with hardener SX14). This process was followed by post-cure at room temperature for 24 hours. For comparison purposes, also wool felt-based composites obtained by stacking three wool felt layers were produced (Sample 4A). While the jute/wool felt hybrids have an amount of reinforcement not exceeding the 40 vol. %. The above described test specimens are presented in Figure 1, while their characteristics are summarized on Table 1.
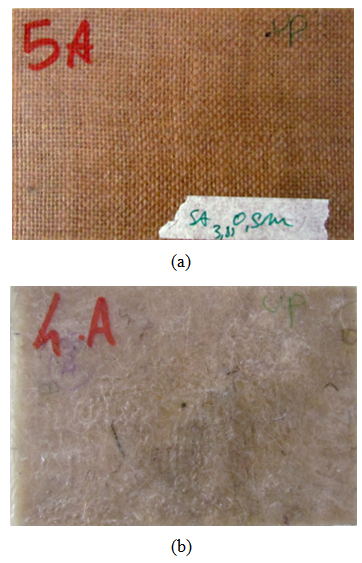 | Figure 1. Front side photograph of (a) 5A sample and (b) 4A sample |
|
3.2. Experimental Methodology and Data Analysis
- As stated above, the two composite panels were tested through infrared vision, optical methods and UV imaging, while XRF analysis was further applied on specific surface regions, based on the information produced from the imaging results. Thermal imaging was applied as this technique can provide reliable and prompt results, probing efficiently the interior of the test object. Pulsed thermographic inspection was carried out using a 320 x 256 pixels FPA infrared camera (Santa Barbara Focal plane SBF125-1st thermocamera), with a spectral response in the mid-wave infrared, from 3.0 to 5.0 μm. Two high-power flashes (Balcar FX 60) in reflection mode, giving total energy of 6.4 kJ in a ~5 ms pulse, were used as heating sources. Furthermore, as stated above and in order to achieve a better knowledge of the samples’ interior condition infrared vision was applied using a more controlled and of longer duration heating procedures. In particular, Square Pulsed Thermography inspections were carried out using a 320 x 240 pixels FPA infrared camera (ThermaCAM S65 HS- 2nd thermocamera) that has a spectral response in the long-wave infrared, from 7.5 to 13.0 μm and the thermal excitation in this case was performed through the aid of a 500 W halogen lamp in reflection mode. Additionally, SPT testing was further implemented incorporating another FPA infrared camera operating as well on the wavelength region between 7.5 and 13.0 μm, but with a higher image resolution as the IR device in this case was consisted of 640 x 480 infrared detectors. More specifically, on this testing scenario, a Therma CAM SC640 imaging equipment was used (3rd thermocamera), while a set of two halogen lamps providing energy of 500 W each was used as a stimulation source. The raw data recorded from both pulsed and square pulsed testing were treated and analysed using PPT and PCT algorithms.Nevertheless, the detection of surface and near surface defects by means of thermal imaging may be insufficient if the selection of data recording rate is not the proper one or defects may not be detected if frame rate limitations exhibit on the respective thermographic system. For this reason, near IR imaging was selected and further applied to the present multi-spectral inspection in order to achieve a better knowledge of the surface and near-surface structural condition of the test panels. For this purpose, a CMOS camera with a narrow-band filter centred at 850 nm was used while data recording was performed both in reflection and transmission mode using as illumination source two halogen lamps (OSRAM Siccatherm – 250 W IR) that provide a wide spectrum radiation (including the NIR band). Moreover, in order to assess and/or confirm the results produced from NIR vision, UV imaging and DSP testing were further applied. In the former case, UV imaging was performed through the aid of LEDs lamp and a filter working at 360 nm, while DSP testing was implemented using a laser product (G4plus250 laser by ELFORLIGHT Ltd.), with a fundamental wavelength of 532 nm, vertical polarization and a specific power of 250 mW. Finally, specific regions of the test panels for which imaging results revealed irregularities but no clear justification could be done for their presence were qualitatively and semi-quantitatively analyzed by means of XRF using a Spectro Xepos instrument made by AMETEK.
4. Results and Discussion
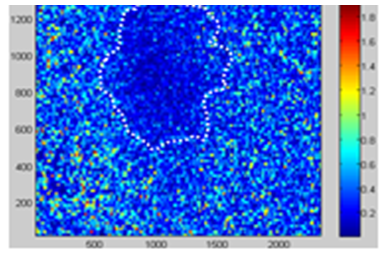
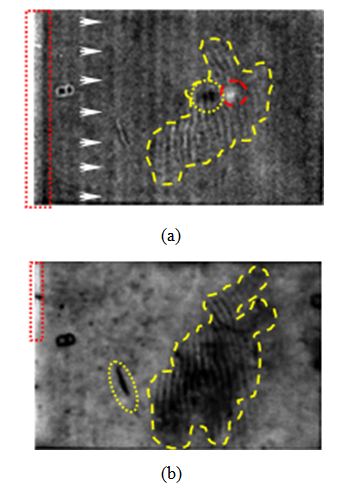
- The samples were inspected both from the front and the rear sides, where a significant collection of data was acquired. Results from this large group of obtained data inherent to sample 5A, are presented in Figures 2 to 5. As can be seen from Figure 1a, no information regarding the fibers’ texture and/or the presence of subsurface defects linked to the manufacture stage or to the impact, can be obtained. However, different types of defects can be detected comparing the thermal results of Figure 2 and 3. In particular, as can be seen from Figure 2a, pulsed thermographic inspection after applying PCT algorithm, revealed the presence of resin-rich areas indicated by the red dotted cycles and the yellow solid oval. The presence of the aforesaid irregularities was further confirmed through the implementation of square pulsed thermographic inspections, revealing as well the presence of fiber misalignment as indicated by the white dotted ovals on Figures 2b to 2d. Moreover, through the long pulsed thermographic testing implemented using the thermographic device of the higher image resolution (3rd thermocamera) and after applying the PPT algorithm to process the raw data, it was possible to detect the fiber breakage caused by the impactor, which had a“butterfly like” shape, as indicated by the white solid circle on the phase image of Figure 2d. On the other hand, the thermographic investigation of sample 5A rear surface revealed damage (surrounded by a white irregular dashed line in Figure 3) at the center of the panel, which can be attributed to the impact application on its front side. According to the Clark’s model [23], the impact damage envelope has a form of a cut cone with a parallel plane to the base: the front side of the sample doesn’t show a large damage if compared to the rear side.
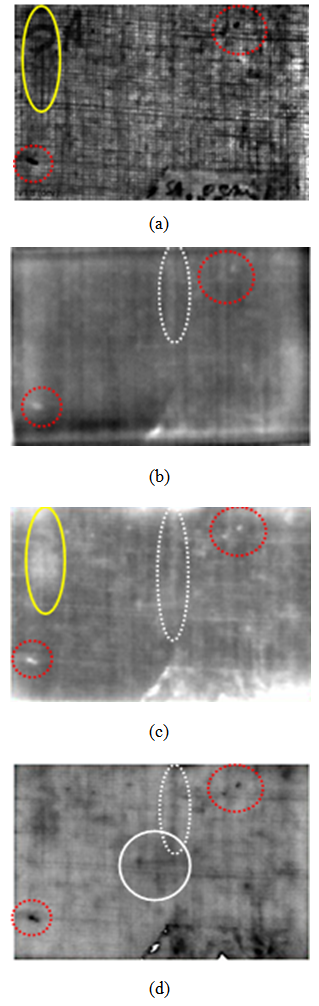 | Figure 2. Imaging results from the inspection of the 5A front surface with (a) EOF3 after applying the PCT algorithm to analyze the PT data (1st thermocamera), (b) EOF9 after applying the PCT algorithm to analyze the SPT data (2nd thermocamera), (c) EOF2 after applying the PCT algorithm to analyze the SPT data (3nd thermocamera), and (d) Phasegram at f = 0.0125 Hz after applying the PPT algorithm to analyze the SPT data (3rd thermocamera) |
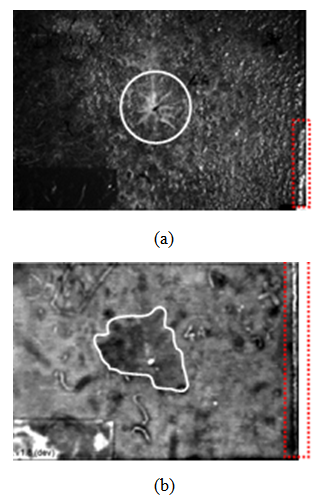
 | Figure 3. EOF3 from the rear side inspection of 5A test panel, after applying the PCT algorithm to analyze the SPT data (3rd thermocamera) |
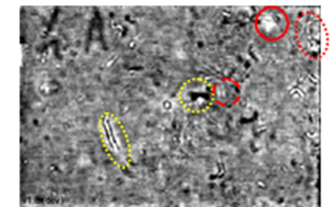
 | Figure 4. Imaging results from the inspection of 5A front surface with (a) NIRT image at 850 nm and (b) UV image at 360 nm |
 | Figure 5. Magnitude DSP image by MatPIV from the rear side inspection of 5A sample |
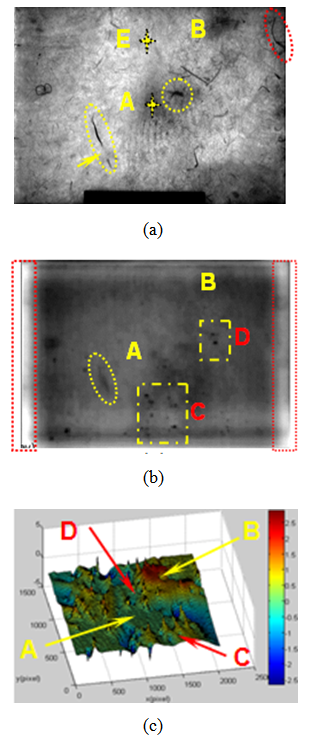 | Figure 6. Imaging results from 4A front side inspection with (a) NIRT image at 850 nm, (b) EOF9 after applying the PCT algorithm to analyse the SPT data (2nd thermocamera) and (c) Surf DSP image by MatPIV |
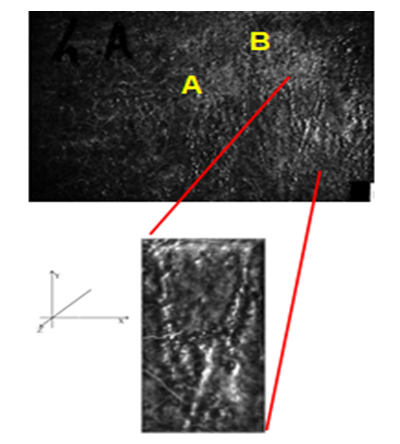 | Figure 7. UV image at 360 nm from the 4A front side inspection. The image in magnification corresponds to the area indicated by the red lines showing the non smooth surface |
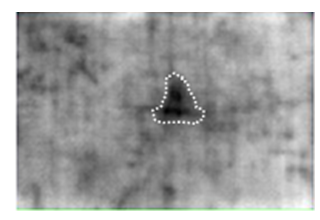
 | Figure 8. Imaging results from the 4A front surface inspection with (a) EOF2 after applying the PCT algorithm to analyze the SPT data and (b) Phasegram at f = 0.0375 Hz after applying the PPT algorithm to analyze the SPT data (3rd thermocamera) |
 | Figure 9. EOF3 from the front side inspection of 4A test panel, after applying the PCT algorithm to analyze the PT data (1st thermocamera) |
 | Figure 10. Imaging results from the 4A rear side inspection with (a) UV image at 360 nm and (b) EOF3 from after applying the PCT algorithm to analyse the PT data (1st thermocamera) |
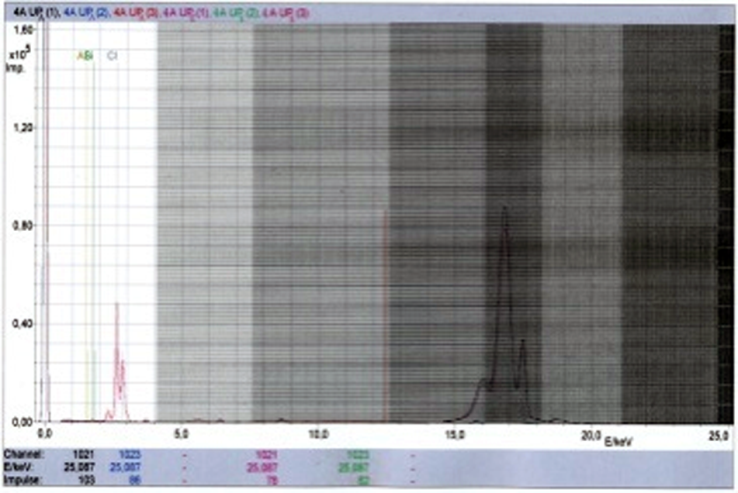 | Figure 11. XRF diagram from the spot analysis on 4A from surface |
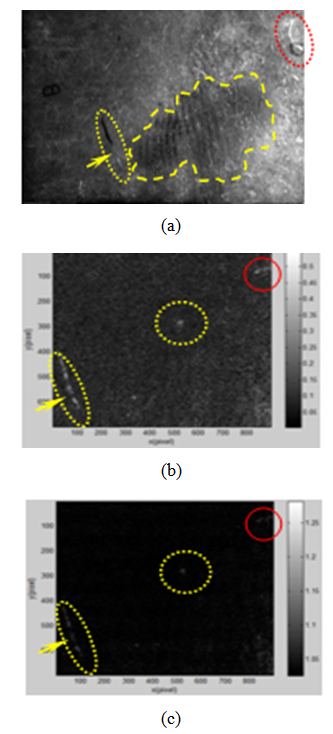 | Figure 12. Imaging results from 4A front surface inspection with (a) NIRR image at 850 nm, (b) spatial contrast image by speckle pattern and (c) temporal contrast image (LSI) by speckle pattern |
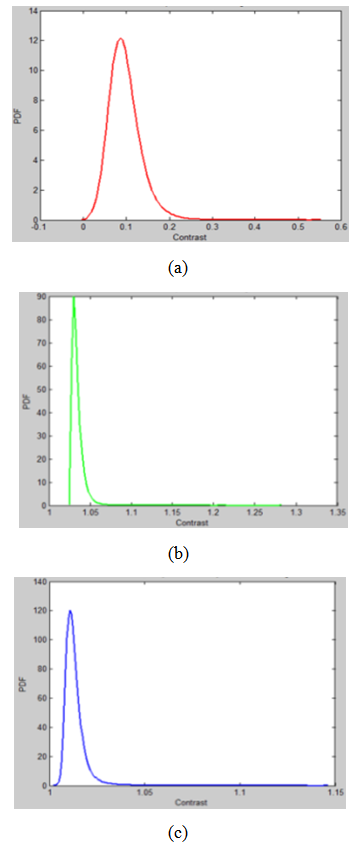 | Figure 13. Plots of PDF against contrast from (a) the spatial contrast image, (b) the temporal contrast image and (c) the combined spatial and temporal contrast image |
5. Conclusions
- In this paper, an innovative and promising integrated approach between NDT techniques applied on composite materials made by natural fibers is described. This is innovative since to the best of our knowledge, the techniques applied were only used individually in previous works, whilst this is promising since following the illustrated methodology and protocol, different information can be retrieved both on the nature and on the positions of the emerging anomalies or defects, due to: 1) the manufacture stage, 2) the impacts [28].The XRF result, linked to the NIRT, UV and PCT results, quantitatively confirms the qualitative deductions. Bearing in mind this scheme, for the next cases similar to the present (both for the nature of the fibers and of the matrix), the use of the XRF analysis will be redundant and it could be eliminated from the quality control. In the composite materials field, concerns are attributed to the application of the matrix, considering as leading to defects during the manufacture stage, but also directly joined to the extent of damage under impact loading. The present research reveals lack of homogeneity in the laminates, not detectable to the naked eye, as well as resin-rich areas and fibers pull-out defects, otherwise identifiable using micro-destructive analysis.
ACKNOWLEDGEMENTS
- The authors would like to thank Dr. F. Ferrante of the Department of Industrial and Information Engineering and Economics (DIIIE), University of L’Aquila, L’Aquila, Italy, for the kind support during the XRF experiment.