A. Rahman1, S. Panigrahi2, R. L. Kushwaha2, M. M. Alam1
1Department of Farm Power and Machinery, Bangladesh Agricultural University, Mymensingh, 2202, Bangladesh
2Department of Chemical and Biological Engineering, College of Engineering, University of Saskatchewan, Canada
Correspondence to: A. Rahman, Department of Farm Power and Machinery, Bangladesh Agricultural University, Mymensingh, 2202, Bangladesh.
| Email: |  |
Copyright © 2012 Scientific & Academic Publishing. All Rights Reserved.
Abstract
The main goal of this research was to investigate the effects of flax fiber diameter and flax fiber content on the properties of biocomposites with the intention of developing optimized compression molded biocomposite boards. HDPE- based biocomposites with three different diameter flax fibers (fine, medium, coarse) and four levels of fiber content (5%, 10%, 15%, and 20% by vol.) were measured. Coarse flax fiber reinforced biocomposite with higher fiber content were more porous compared to other types of biocomposites. Biocomposite boards melted at higher temperature when they had a higher fiber loading. Medium flax fiber reinforced biocomposite showed the highest thermal degradation. Fine flax fiber reinforced biocomposites showed the lowest density, water absorption and exhibited the highest tensile, flexural and hardness properties. Color index, density, water absorption, flexural strength, and hardness number increased with higher fiber loading. However for the HDPE composites, tensile strength decreased with higher fiber loading. Color index, density and water absorption were the highest with a fiber loading of 20%. Flexural strength and hardness was the highest with a fiber loading of 15% in biocomposites. The biocomposite boards with 5% flax fiber showed the highest tensile strength.
Keywords:
Fiber Diameter, Physical Properties, Thermal Properties, Mechanical Properties, Biocomposites
Cite this paper: A. Rahman, S. Panigrahi, R. L. Kushwaha, M. M. Alam, Effect of Fiber Diameter on Properties of Compression Molded Flax Fiber-reinforced Biocomposites, International Journal of Composite Materials, Vol. 3 No. 5, 2013, pp. 122-129. doi: 10.5923/j.cmaterials.20130305.02.
1. Introduction
Over the last thirty years many novel materials made from biocomposite materials, plastics and ceramics have emerged. Biocomposite materials, in particular, have found numerous market applications such that they constitute a significant proportion of the engineered materials marketed today. Natural fibers, such as flax, hemp, jute, coir, palm, and other natural fibers, are becoming an important constituent of these biocomposites, due to their desirable properties[1]. These properties, such as density, electrical resistivity, ultimate tensile strength, Young’s modulus, and many others, depend on factors like fiber length, maturity, as well as the processing methods adopted for the extraction of the fibers[2, 3]. In Canada, flax is considered to be one of the strongest and most widely available bast fibers, and has attracted considerable attention for use in reinforcing different thermoplastics. Major applications can be found in the automotive industry for making interior parts and bumpers, as well as in food packaging materials and pharmaceutical products[1]. The reason for this is flax has lower density and a comparable tensile strength to that of glass fiber; setting it up to be a potential replacement for synthetic fiber[4].In this research, Saskatchewan-grown flax fiber is used with basic compression molding technology to evaluate the properties of various flax fiber biocomposites. It is hypothesized that the quality of these flax fiber biocomposites will depend on the percentage of fiber used for reinforcing the thermoplastic polymer (HDPE) and fiber diameter. Ultimately, the objective is to develop compression molded green board suited for use in automotive parts, the construction industry, and other commercial applications, and thus stimulate value- added utilization of Saskatchewan / Canadian grown flax.The overall goal of this research is to develop compression molded green board using Saskatchewan flax fiber and streamline the manufacturing process in terms of optimal fiber diameter and fiber percentage. To achieve this, the following specific objectives were set:● measure the effect of flax fiber diameter on different morphological, thermal, physical and mechanical properties of compression molded biocomposites; ● measure the effect of flax fiber loading on different morphological, thermal, physical and mechanical properties of compression molded biocomposites.
2. Materials and Methods
2.1. Materials
Flax fibers were obtained from linseed flax grown in Saskatchewan and decorticated by Biolin Research Incorporated (Saskatoon, Canada). As a reinforcing material for the production of the composites, high density polyethylene (HDPE 8761.27, Exxon Mobil, Toronto, ON, Canada) was used, along with the flax fiber. 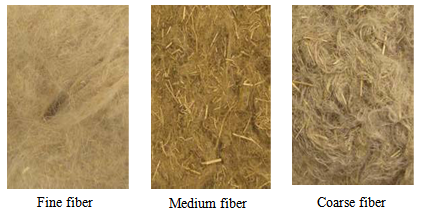 | Figure 1. Three types flax fiber materials used in experiment |
2.2. Measurement of Flax Fiber Diameter
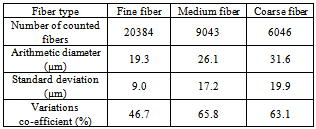
The diameter of flax fiber was measured according to ASTM Standard D7025[5]. These measurements were performed by Biolin Research Incorporated (Saskatoon, Canada) personnel, using image analysis (Fibreshape version 5.2)[6].Table 1. Types of flax fiber used in experiment
 |
| |
|
2.3. Sample Preparation and Composite Board Development
In order to create composite materials the flax fiber first needs to be pre-processed. The HDPE also goes through a pre-processing step. Finally, the mixture is extruded and again pelletized and fine ground. This is to ensure that the composite materials are well mixed. A rectangular mold was designed to mold a rectangular sample, 200 mm x 200 mm in size. The mold was made from construction grade steel. The ground mixtures of extrudates were compressed in a compression mold, using a hydraulic press device. The molding temperature and pressure used for developing HDPE composites was 150℃ and 1.6 MPa respectively. The residence time for composite preparation during compression molding was 25 min. The pressed boards were cooled down to room temperature by the water-cooling system of the compression molding system. Pressure was maintained during the cooling process to develop green boards with better dimension stability and mechanical properties.
2.4. Materials Testing and Characteristics
The effects of the different variables were analyzed using a scanning electron microscopy (SEM) and a differential scanning calorimeter (DSC). In addition, tensile strength, flexural strength and hardness properties of the composites were measured.
2.4.1. Scanning Electron Microscope Image Analysis
The morphology of the fiber and fiber orientation and dispersion in the compression molded biocomposites were determined from the images captured by the scanning electron microscope (SEM 505, Philips, Holland). The surface of the sampled composites was vacuum coated with a thin layer of gold to provide electrical conductivity. All SEM tests were conducted at Department of Biology, University of Saskatchewan, Saskatoon, Canada.
2.4.2. Differential Scanning Calorimetry Analysis
Thermal analysis of the flax fiber, pure polymer resin and biocomposites were performed using a DSC Model Q2000 (TA Instruments, New Castle, DE). DSC is a thermo- analytical technique in which heat flow is measured as a function of temperature or time. The thermo-grams were then analyzed for any changes in the thermal behavior of the fiber/composites. A sample weighing between 5 to 10 mg was placed in an aluminum pan and sealed with a crucible sealing press. The DSC system was operated in a dynamic mode with a heating scheme of 40 to 300℃, with a heating rate of 10℃/min.
2.4.3. Color Analysis
To analyze the degree of degradation of the material in the biocomposite, due to temperature and pressure during compression molding, the color index was measured and compared using a HunterLab Spectrocolorimeter (HunterAssociates Laboratory Inc., Reston, VA). Color was analyzed in terms of L (0 = black to 100 = white), a (-a = green to +a = red) and b (-b = blue to +b = yellow) values. Rectangular samples of 25.4 mm by 76.2 mm cut from the compression molded board were used for color measurement. For the color test, a viewing area of 12.77mm (0.50 in.) and a port size of 25.4mm (1 in.) were used. The total color difference index (E) which represents the deviation from the reference stage was used as an indicator of the degree of degradation. The index E was determined by equation 1[7,8]. | (1) |
Where,L, a, b = color coordinates of the samplesLref,, aref,, bref = color coordinates of the control sample (0% fiber) of HDPE board.
2.4.4. Density Test
Material mass (m, g) was measured by a Galaxy 160D weighing scale (OHAUS Scale Corporation, Florham Park, NJ). The volume of a sample (V, cm3) was measured using a gas-operated (nitrogen gas) multi-pycnometer(Quantachrome Corporation, Boynton Beach, FL. Rectangular specimens were cut from each sample with dimensions of 25.4 mm x 76.2 mm. The mass of the samples was measured at room temperature using a weighing scale. The density of three replicates was measured for each sample and the average density reported. The volume of the material was determined from the following equation: | (2) |
Where,V = Volume of sample (cm3),VC = volume of sample cell (cm3),VR = reference volume (cm3),PI = pressure reading after pressurizing the reference volume (psi), andPII = pressure reading after including VC (psi).
2.4.5. Water Absorption Test
The water absorption test followed the ASTM standard test method D570-98[9]. The test specimen was in the form of a bar 76.2 mm long, 25.4 mm wide and 3.2 mm thick. Before the measurement, the sample was dried in an air oven at 50°C for 24 h, cooled in a desiccator, and immediately weighed to the nearest 0.001 g, which is taken as the initial dry weight of the sample, M0. Then the specimen was placed in a container of distilled water maintained at a temperature of 23 ± 1°C for 24 h After 24 hrs, the specimen was removed from the water; the water wiped off the surface of the sample with a dry cloth; and the sample immediately weighed to the nearest 0.001 g, (designated as M1). For each biocomposite sample, three specimens were measured. The water absorption of the sample was calculated as percent weight change (M %) determined as follows: | (3) |
2.4.6. Tensile Strength Test
The tensile test was conducted using an Instron reversible load cell (5 kN) in accordance with ASTM D638 (standard test method for tensile properties of plastics)[10]. Since the material was isotropic, only five specimens for each treatment were made. The specimens were first conditioned at 24°C and 50% relative humidity for 72 h. All tests were conducted under the same conditions. The speed of testing used was 5 mm/min. The maximum load value Fmax was recorded by the instrument, which can be recalled after the completion of the test. The tensile strength (σt) was calculated from the following equation: | (4) |
2.4.7. Flexural Strength Test
The flexural strength of the biopolymer material was measured by three point bending. The testing was conducted using an Instron model 1011 testing machine (Instron Corp., Canton, MA). The size of the test specimen was as per ASTM D790-02 specifications[11]. A specimen of rectangular cross section (3.2 mm × 12.7 mm × 64 mm) which behaves as a beam was tested in flexure. The bar rests on two supports and is loaded by means of a loading nose midway between the supports. Before testing, the specimens were conditioned at a temperature of 23 ± 2°C and relative humidity of 50 ± 5% for more than 40 h The flexural strength (σf) was determined using the maximum fiber stress (ASTM 2003) as equation: | (5) |
2.4.8. Hardness Test
This test method is based on the penetration of a specific type of indentor when forced into the material under specified conditions. The hardness of the biocomposite boards were measured by following ASTM D2240-02 specifications[12], using a Shore D type durometer (Shore Instrument and MFG Co., Freeport, NY). The hardness of each sample was calculated as average of ten readings.
3. Results and Discussion
3.1. Morphological Characterization
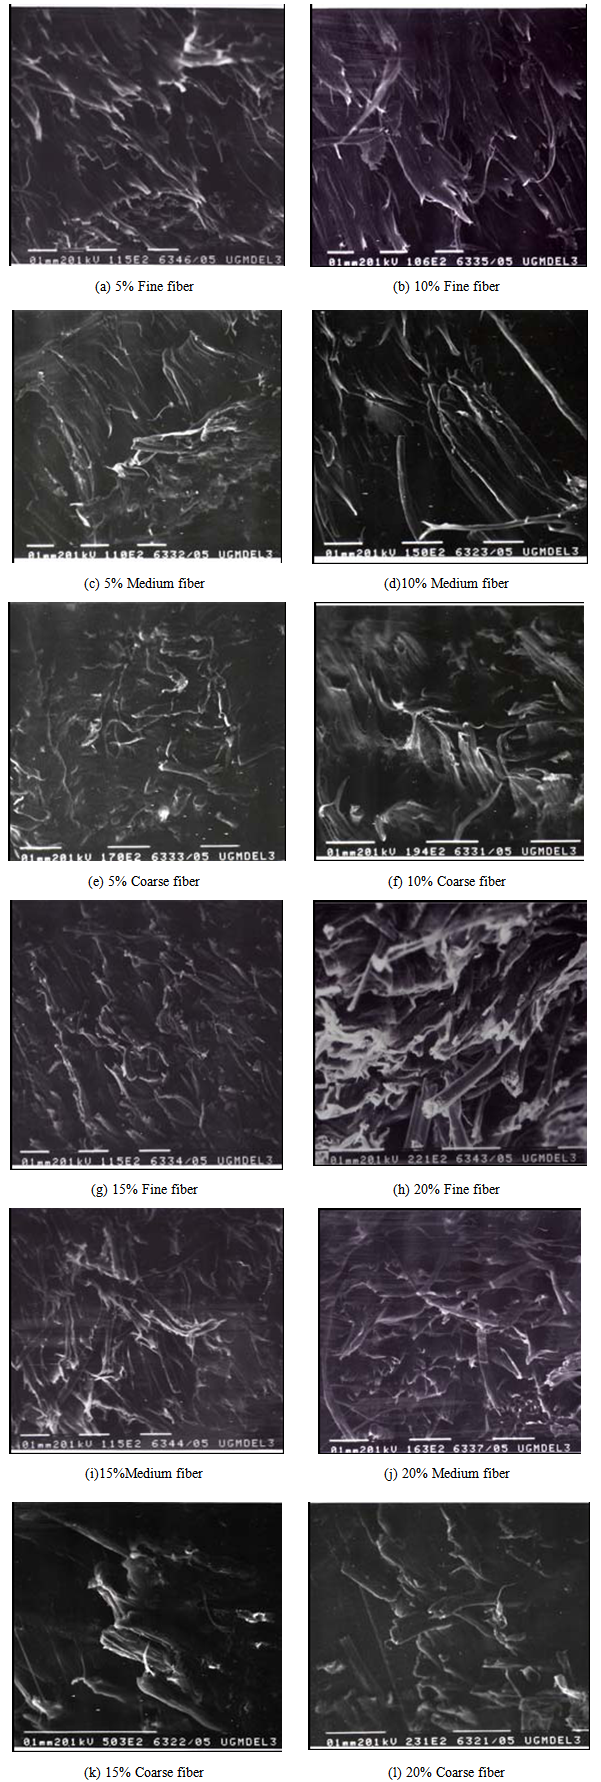 | Figure 2. SEM images of flax fiber reinforced biocomposite samples |
SEM images of the cross section of several flax fiber reinforced biocomposite samples were captured to examine the dispersion of fiber in the polymer resin. Forbiocomposites, the coarse flax fiber reinforced biocomposites were more porous compared to other types of biocomposites. Coarse flax fiber based biocomposites contained non-uniform air voids, which later resulted in poor mechanical properties. The fine and medium flax fiber have better dispersion throughout the biocomposite boards, enhancing their mechanical properties. The composites became more porous with increasing flax fiber content.
3.2. Thermal Characterization
All the flax fiber reinforced biocomposites were made under 200oC. DSC thermo-grams were analyzed for melting point and degradation temperature in the temperature range of 40 to 300oC. A small change in the melting point temperature of the polymers due to fiber incorporation was observed. The increase in melting point temperature may be attributed to the plasticization effect of the fiber that diffuses into the polymer. The increased melting point of the composites meant that thermal resistance increased due to flax fiber addition. But the flax fiber diameter did not have any significant effect on the melting point of the composites board.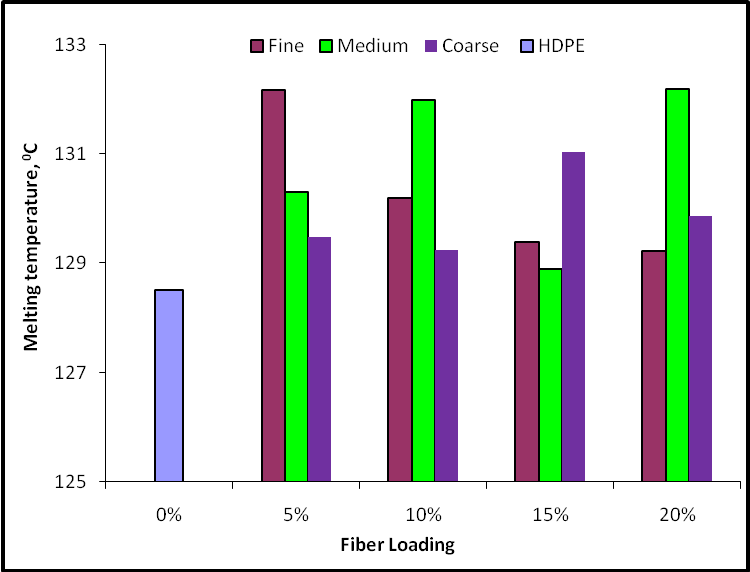 | Figure 3. Melting points of HDPE- based flax fiber biocomposites |
3.3. Physical Properties
Experimental results of color, density, and water absorption tests were discussed to characterize the physical properties of different biocomposite boards made with three types of fiber diameter and four levels of fiber loading.
3.3.1. Biocomposite Board Color Analysis
The color index (∆E) of the biocomposite boards were determined to evaluate the effect of fiber diameter and fiber loading on the physical appearance of the biocomposite boards. The color index of HDPE-based biocomposite boards varied from 33 to 50. The color index was higher with medium flax fiber biocomposites because the lignin content imparts a brown color to the flax fiber. The color index increased of the biocomposites with increasing fiber content, and peaked when fiber loading was 20%. Higher fiber content gave a darker color to the composite boards.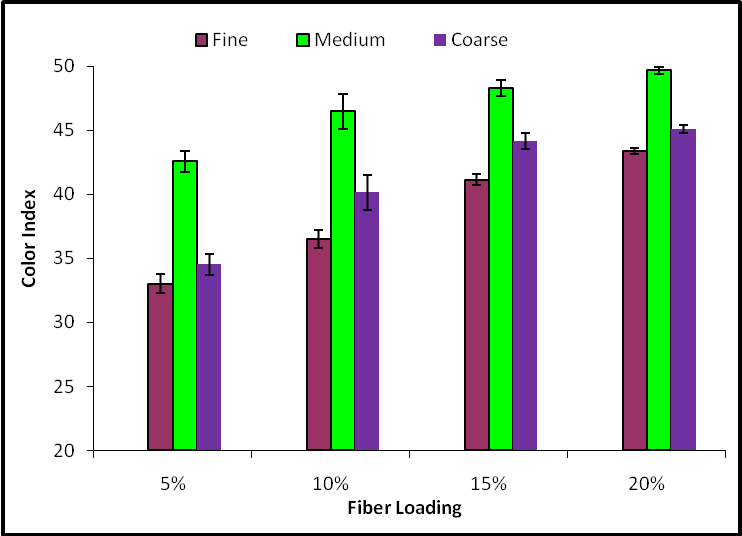 | Figure 4. Color index of HDPE-based biocomposites |
3.3.2. Biocomposite Boards Density
For HDPE composites, the density varied from 0.938 to 0.981gm/cm3 (Fig. 5). Fine flax fiber reinforced biocomposites showed the lowest density, while coarse flax fiber reinforced biocomposites had the highest density because the coarse fiber had a higher density compared to the other fibers. This can be explained by the fact that the density of flax fiber is higher than that of HDPE. The biocomposites boards with 20% flax fiber contained the maximum number of voids. For this reason that type of composite had a higher density compared to other types of biocomposites. 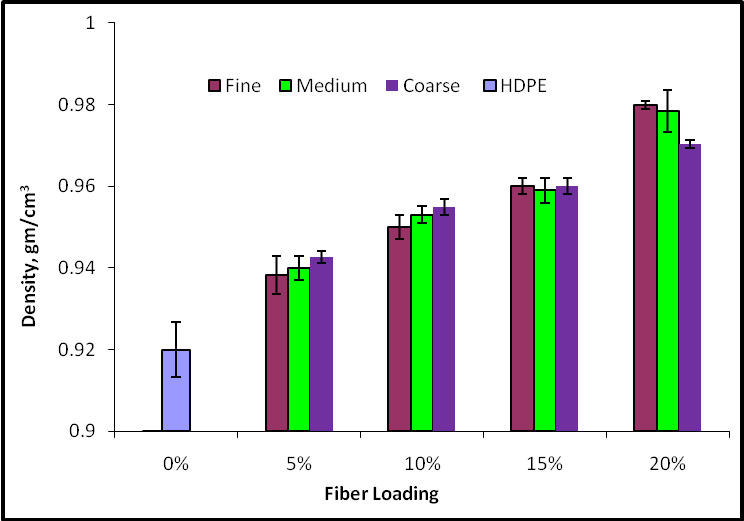 | Figure 5. Density of HDPE-based biocomposites |
3.3.3. Water Absorption Characteristics of Biocomposite Boards
Water absorption is an important property for commercial application of biocomposites. Higher water absorption leads to poor dimensional stability, risk of fiber degradation (hydrolysis) and hence is not recommended. The water absorption characteristics of HDPE based biocomposites are presented in Figure 6. For HDPE-based biocomposites, the water absorption varied from 0.31to 0.61%. The biocomposites boards with 20% flax fiber showed the highest water absorption characteristics.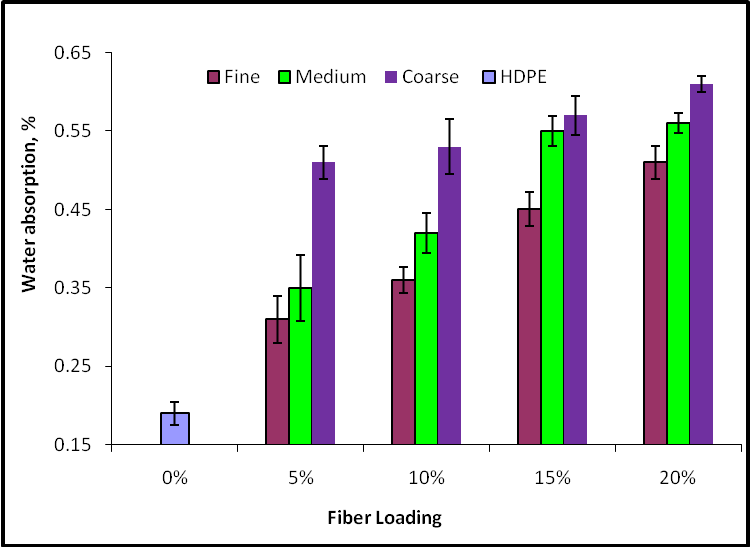 | Figure 6. Water absorption of HDPE-based biocomposite |
This can be explained by the fact the flax fiber is hydrophilic in nature and has greater affinity for water than the HDPE. Biocomposites made of fine flax fiber absorbed less water because the fine fiber contains less waxy substances.
3.4. Mechanical Characteristics
The mechanical properties of different biocomposite boards were characterized by tensile strength, flexural strength and hardness made with three types of fiber diameter and four levels of fiber loading.
3.4.1. Tensile Strength of Biocomposites Boards
Flax fiber has a good potential to be used as reinforcement in polymer matrix composites. The tensile strength of HDPE -based biocomposites is presented in Figure 7. For HDPE-based biocomposites, the tensile strength varied from 15 MPa to 19 MPa. Figure 7 shows that tensile strength decreased with increasing fiber content. The biocomposite boards with 5% flax fiber showed the highest tensile strength. Among the three flax fiber materials, the fine fiber reinforced biocomposite resulted in the highest tensile strength, while the coarse fiber reinforced biocomposite had the lowest tensile strength because of less lignin content and waxy substances in the fine fiber.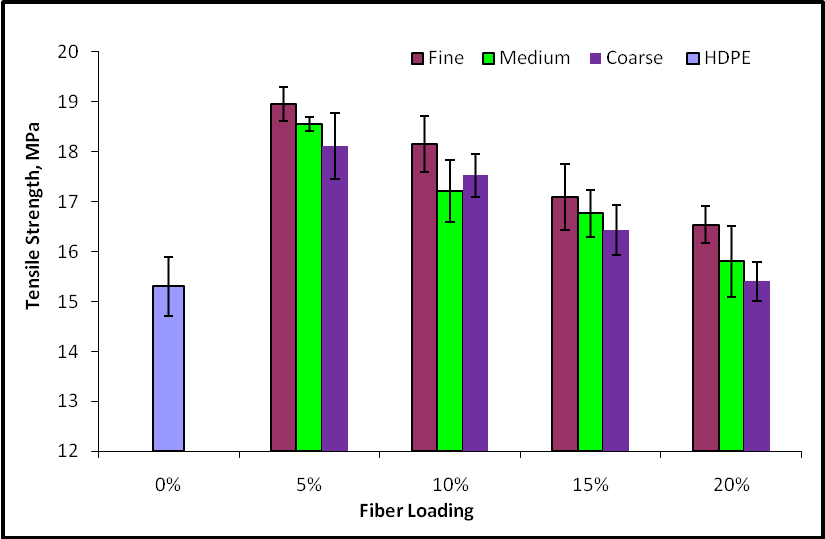 | Figure 7. Tensile strength of HDPE-based biocomposite |
3.4.2. Flexural Strength of Biocomposite Boards
The flexural strength of HDPE- based biocomposites is presented in Figure 8. For HDPE-based biocomposites, the flexural strength varied from 25 MPa to 28 MPa. Flax fiber possesses higher strength and fiber-polymer bonding increases the flexural strength of the biocomposite. Flexural strength was found higher for fine flax fiber reinforced HDPE composites (15% fiber). Because of higher purity of flax fiber resulted in better mechanical properties of biocomposites. 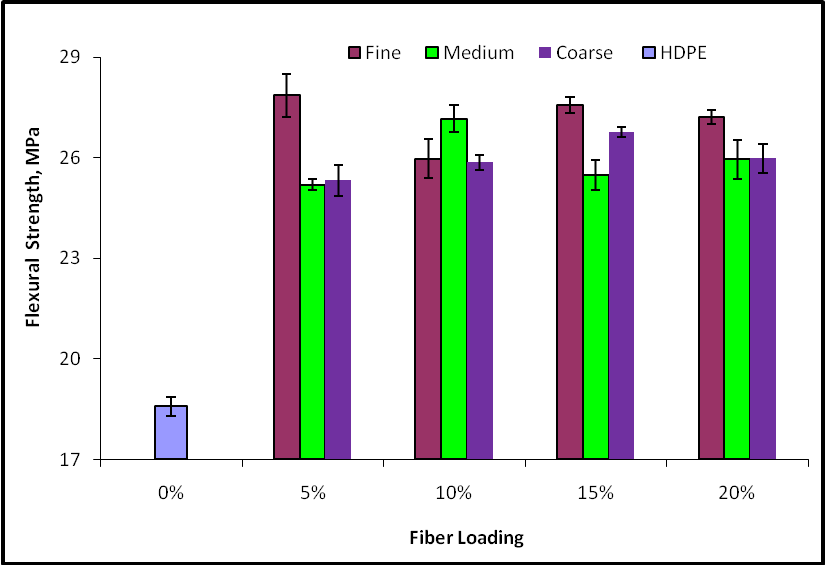 | Figure 8. Flexural strength of HDPE-based biocomposite |
3.4.3. Hardness of Biocomposite Boards
The hardness of the HDPE-based biocomposites is presented in Figure 9. For HDPE-based biocomposites, the durometer hardness number varied from 62 to 64.Figure 9 shows that the higher fine flax fiber reinforced HDPE composites (15% fiber) were harder. Hence, the fine type flax fibers had a higher hardness number compared to the other types of flax fiber. 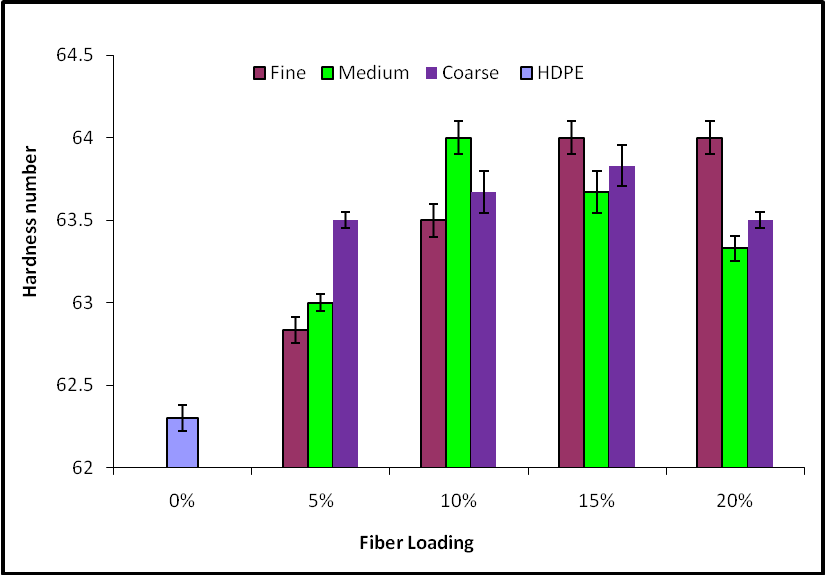 | Figure 9. Hardness number of HDPE-based biocomposite |
4. Conclusions
The conclusions that were drawn from the experimental results are subdivided and listed according to the specific research objective.Effect of flax fiber diameter on compression molded biocomposites:● Coarse flax fiber reinforced biocomposites were more porous compared to other types of biocomposites. This was because the coarse flax fiber based biocomposites contained non-uniform air voids. Medium flax fiber reinforced biocomposites showed the highest color index, while fine and coarse fiber reinforced biocomposites had the lowest color index, indicating that the lignin content in the fiber imparts a brown color to the biocomposite. Fine flax fiber reinforced biocomposites showed the lowest density, while Coarse flax fiber reinforced biocomposites had the highest density because the coarse fiber has a higher density compared to the other fibers. Fine flax fiber reinforced biocomposites showed the lowest water absorption, while Coarse flax fiber reinforced biocomposites had the highest water absorption, because the fine fiber contains less waxy substances. Fine flax fiber reinforced biocomposites exhibited the highest tensile and flexural properties, showing that a higher purity of flax fiber results in better mechanical properties for the biocomposites. Fine flax fiber reinforced biocomposites exhibited the highest hardness number, showing that higher purity of flax fiber results in better mechanical properties of biocomposites. Effect of flax fiber loading on compression molded biocomposites:● From the DSC tests, the results showed that biocomposite boards melted at a higher temperature with increased the fiber loading. The increased melting point of composites meant that thermal resistance increased with flax fiber addition. Increases in fiber loading increased the composite color index. The color index was the highest when fiber loading was 20%. Because higher fiber content gave a darker color to the composite boards. The biocomposites boards with 20% flax fiber contained the maximum number of voids. For this reason that type of composite had a higher density compared to other types of biocomposites. The biocomposite boards with 20% flax fiber showed the highest water absorption characteristics because of the flax fiber is hydrophilic in nature and have greater affinity for water than the HDPE. The biocomposite boards with 5% flax fiber showed the highest tensile strength. Increases in fiber loading increased the flexural strength of the composite boards. However for composites board, flexural strength started decreasing beyond 15% (wt %) of flax fiber. The biocomposites boards with 15% flax fiber showed the highest hardness number.
ACKNOWLEDGEMENTS
The authors would like to acknowledge the financial support from Canadian Bureau for International Education, on behalf of Foreign Affairs and International Trade Canada (DFAIT) under Canadian Commonwealth Exchange Program, Asia-Pacific (formerly GSEP) and College of Graduate Studies and Research for the travel award and financial support for funding the project.
References
| [1] | Bledski, A.K. and J. Gassan. Composites reinforced with cellulose based fiber. Progress in Polymer Science 1999; 24: 221-274. |
| [2] | Mohanty, A.K., M. Misra and L.T. Drzal. Surface modifications of natural fibers and performance of the resulting biocomposites: An overview. Composite Interfaces 2001; 8(5):313-343. |
| [3] | Reddy, N and Y. Yan. Biofibers from agricultural byproducts for industrial applications. Trends in Biotechnology 2005; 23(1): 22-27. |
| [4] | Joffe, R., J. Andersons and L. Wallstrom. Strength and adhesion characteristics of elementary flax fibers with different surface treatments. Composites Part A: Applied Science and Manufacturing 2003; 34(7): 603-612. |
| [5] | ASTM Standard D7025: Standard test method for assessing clean flax fiber fineness. Annual Book of Standards, section 7, Textiles, West Conshohocken, PA. USA: ASTM; 2005. |
| [6] | Schmid, H. and Mussig, J. Image scanning for measurement of cotton fiber width. In Proceedings –International Textile Manufactures Federation – ITMF, International Committee on Cotton Testing Methods, Bremen: 2002. |
| [7] | Chen, C.R. and H.S. Ramaswamy. Color and texture change kinetics in ripening bananas. Lebensm Wiss U Technology 2002; 35: 415-419. |
| [8] | Methakhup, S., N. Chiewchan and S. Devahastin. Effects of drying methods and conditions of drying kinetics and quality of Indian gooseberry flake. LWT- Food Science and Technology 2005; 38(6): 579-587. |
| [9] | ASTM Standard D570-98: Standard test method for water absorption of plastics. In Annual Book of ASTM Standards Vol. 08.01, 32-35. West Conshohocken, PA, USA: ASTM; 2003. |
| [10] | ASTM Standard D638-02a: Standard test method for tensile properties of plastics. In Annual Book of ASTM Standards Vol. 08.01, 46-59. West Conshohocken, PA, USA: ASTM; 2003. |
| [11] | ASTM Standard D790-02: Standard Test Method for flexural properties of unreinforced and reinforced plastics and electrical insulating materials. In Annual Book of ASTM Standards Vol. 08.01, 146-154. West Conshohocken, PA, USA: ASTM; 2003. |
| [12] | ASTM Standard D2240-02b: Standard Test Method for rubber property-durometer hardness. In Annual Book of ASTM Standards Vol. 09.01, 423-434. West Conshohocken, PA, USA: ASTM; 2003. |
 Abstract
 Reference
 Full-Text PDF
 Full-text HTML