Gaurav Agarwal1, Amar Patnaik2, Rajesh Kumar Sharma2
1Department of Mechanical Engineering, S.R.M.S.C.E.T, Bareilly 243122, India
2Department of Mechanical Engineering, National Institute of Technology, Hamirpur, India
Correspondence to: Amar Patnaik, Department of Mechanical Engineering, National Institute of Technology, Hamirpur, India.
| Email: |  |
Copyright © 2012 Scientific & Academic Publishing. All Rights Reserved.
Abstract
Effect of addition of SiC filler in different weight percent on specific wear rate of chopped glass fiber reinforced epoxy composites has been investigated. Three body abrasive wear analysis was conducted by varying different factors such as fiber content, abrasive particle size, normal load, sliding distance and sliding velocity. Attempt was to find out the dominant factor and the percentage contribution of each factor on specific wear rate analysis. Difference in theoretical and experimental density is determined to notice the amount of void fraction present in the composite. The result shows that void fraction decreases with the addition of SiC content up to some extent. Specific wear rate decreases with increase in sliding velocity for all wt. % fiber / filler reinforcement whereas with the addition of SiC content the specific wear rate decreases. Specific wear rate increases with the increase in normal load whereas with the addition of SiC content in different weight percentage specific wear rate decreases for all values of normal load. Worn surfaces were studied using a scanning electron microscope (SEM) to give an insight into the wear mechanisms.
Keywords:
Specific Wear Rate, Taguchi Method, ANOVA, Steady State
Cite this paper: Gaurav Agarwal, Amar Patnaik, Rajesh Kumar Sharma, Parametric Optimization and Three-Body Abrasive Wear Behavior of Sic Filled Chopped Glass Fiber Reinforced Epoxy Composites, International Journal of Composite Materials, Vol. 3 No. 2, 2013, pp. 32-38. doi: 10.5923/j.cmaterials.20130302.02.
1. Introduction
Wear is the process of gradual removal of material from the surfaces of the composite specimen. The detached material becomes loose wear debris. Wear of a material cannot be completely eliminated but can be significant reduced by selecting appropriate combination of fiber / filler and matrix. Wear of the specimen is further classified as abrasive wear, adhesive wear, fatigue wear, erosive wear, fretting wear, oxidative wear and corrosive wear. Abrasive wear and fatigue wear results in significant reduction in the mechanical properties of the composite. Abrasive wear results in loss of material by dynamic interaction of two surfaces with respect to one another. Material is removed from the surface resulting in loss of dimensions. In a closed system loss of material (wear debris) results in further enhancement of wear rate by creating a three body abrasive wear scenario. The composition obtained by different combination of fiber / filler and matrix presents different values of specific wear rate. A proper understanding of increase / decrease in the ratio of fiber / filler and matrix is important so as to reduce the amount of wear rate [1-3]. Loss of material by the dynamic interaction off two surfaces with respect to one another in the presence of abrasive media is known as three body abrasion, most popular among the two types of abrasion. Addition of fiber / fillers results in improvement in specific wear rate of composite whereas excessive addition of fiber / filler results in decrease in properties of the composite[4]. Wear volume increases with the increase in abrading distance and load. Graphite filled carbon – epoxy shows better abrasion resistance under different loads, abrading distances[4, 5]. The modification of tribological behaviour of fiber-reinforced polymers by the addition of filler material has been reported. In addition to the higher mechanical strength obtained due to the addition of fillers in polymeric composites, less amount of fiber and matrix material is used which further results in cost reduction[6, 7]. The modulus of the polypropylene, and modified polypropylene was a function of the concentration of filler used up to 40 volume percent. Chemical modification of polypropylene also resulted in greater adhesion to fillers[8-10].The literature mentioned above gives a brief overview about the addition of fiber / filler on specific wear rate of SiC filled glass fiber reinforced epoxy composites. Above literature reveals that three body specific wear rate at optimum fiber loading condition, steady state specific wear analysis for such a wide range of fiber loading to understand the mechanism of increase /decrease in properties and optimum fiber-filler ratio have not been discussed so far.
2. Material Required
Chopped E-Glass fiber (5-10 mm long, 200 G.S.M. density) manufactured by Ciba Geigy is used as fiber reinforcement and commercially available Silicon Carbide (SiC) powder also known as carborundum of particle size 25-60μm (density 2.6 g/cm3) obtained from M/s. Silicarb Recrystalized Pvt. Ltd., Bangalore used as a particulate filler. The matrix material consist of epoxy resin of grade LY 556 and room temperature curing hardener of grade HY951 supplied by Shankar chemicals, Delhi, India. Composites were fabricated by blending epoxy resin, glass fiber and SiC filler in certain wt. % reinforcement. Five different compositions of composites are prepared by varying SiC filler reinforcement with fixed wt. % of chopped glass fiber reinforcement. SiC filler in five different weight percent (0wt.%, 5wt.%, 10wt.%, 15wt.% and 20wt.%) are added with fixed 20wt.% of chopped glass fiber and remaining wt.% of epoxy so as to notice the effect of SiC reinforcement on specific wear rate of chopped glass fiber reinforced epoxy composites. Composites are prepared by blending certain weight percent of fiber / filler and epoxy resin in separate container and then pour in the mould of desired dimensions. Labelling is done with the help of rollers, suitable weights are then applied on the top of the mould. Similarly five different moulds are prepared by varying five percentage of SiC filler content with chopped glass fiber and epoxy resin. Moulds are then left for solidification at room temperature for 24 hours. After solidification process composites are then removed from the mould and marking has been done as per the test standards. Rectangular specimen of size 76mm x 25mm x 8mm are prepared for three body abrasion wear tests.
2.1. Experimental Details
As per ASTM G65 test standard three body abrasion wear tests were conducted by using Tr-50 Dry Abrasion Tester (Figure 1). Specimen is fixed in the tool holder and normal load applied against the specimen such that the face of the specimen comes in contact with the rotating rubber wheel. The nozzle of the hopper is adjusted such that the freely flowing silica sand comes in between the specimen and the rubber wheel. The rotating wheel with a chlorobutyl rubber tire freely flowing silica sand and the specimen creates the scenario of three body abrasion. This test specimen is pressed against the rotating wheel at a specified force by means of a lever arm while a controlled flow of grit abrades the test surface. The rotation of the wheel is such that the contact face moves in the direction of the sand flow. The severity of abrasive wear will depend upon the abrasive particle size, particle shape, hardness and normal load, the magnitude of the stress imposed by the particle and the frequency of contact of the abrasive particle. The set-up allows users to test under a variety of loads, sliding speed, sliding distance and abrasive particle size. Loss of weight of test samples indicates wear resistance. Materials of higher abrasion resistance will have a lower volume loss. | (1) |
Where, ΔW = Weight loss of the specimen W1 = Weight of the specimen before test W2 = Weight of the specimen after testVolume loss (ΔV) of the specimen is computed in the following manner: | (2) |
Where, ρ = Experimental density of the specimenThe Specific wear rate (Ws) of the specimen is calculated in the following manner: | (3) |
Where Ss = Sliding distance (m), FN = Normal load (N) 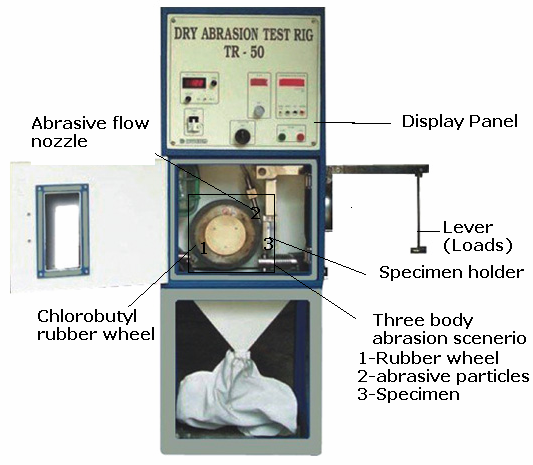 | Figure 1. Three body Abrasive wear testing machine |
2.2. Calculation of Void Fraction
Density of a material is its mass or weight per unit volume. It is a measure of the structure of the material i.e. whether the material is porous or dense. Theoretical and experimental density of the material is used to determine the presence of pores and voids in the material. The theoretical density of the composite material is determined with the help of Agarwal and Broutman[11] equation. In this equation W denotes the wt. % of matrix, fiber and filler and ρ denotes the individual density of matrix, fiber and filler. The individual densities are normally obtained from the supplier of the resin and reinforcing material. 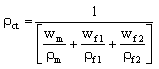 | (4) |
Where, Wm = wt. % of matrix (resin),  =density of matrix (resin), wf1 = wt. % of glass fiber,
  = density of glass fiber, wf2 = wt. % of SiC filler,
  = density of SiC filler. Experimental density of the specimen is determined by measuring the ratio of weight of the specimen to the displaced volume of the liquid. The difference in the values of theoretical and experimental density is a measure of the presence of voids and pores in the composites. The void fraction is calculated as:
 | (5) |
Where,ρct= theoretical density of compositesρexp=experimental density of compositesThe surface of the specimens are then examined with the help of scanning electron microscope (Carl Zeiss NTS GmbH, SUPRA 40VP). The surfaces to be examined are of dimensions 8mm x 8mm x 4mm. Specimens are fixed on the stabs and high degree of vacuum are created so that when electron beam strikes the specimen scans the surface details of the specimen for different magnification factor. The photomicrographs of the abraded surface are taken for different percentages of fiber / filler and matrix material.
2.3. Experimental Design
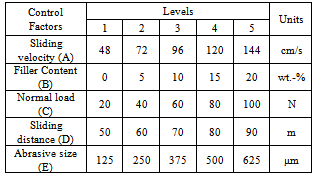
The Taguchi method is used to reduce the large number of iterations to few steps. Instead of having to test all possible combinations, the Taguchi method tests pairs of combinations and give optimum result. This reduces the number of experiments, time and money[12, 13]. To determine the specific wear rate of SiC filled glass fiber reinforced epoxy matrix composites using a combination of five factors and each having five variables (Table 1). The number of experiments involve are large in number since the effect of each factor on each variable is to be determined. Using experimental approach the impact of five factors and five variables can be studied using L25 orthogonal array. Using L25 orthogonal array number of iterations evolved reduces to twenty five. The S/N ratio for five factors and five variables are determined by selected smaller-is-better characteristic since our aim is to reduce the specific wear rate to the minimum.Smaller is the better characteristic: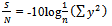 | (6) |
Where, n = number of observations and y = observed data, S/N = signal to noise ratio.Table 1. Levels of the variables used in the experiment
 |
| |
|
3. Results and Discussion
3.1. Effect of Void Content on SiC Filled Chopped Glass Fiber Reinforced Epoxy Composites
Void content measures the presence of pores and voids (empty spaces) in SiC filled chopped glass fiber reinforced epoxy matrix composites. Information on void content is useful because high void contents increases the porosity and simultaneously reduces the strength of the material[14]. Table 2 shows the theoretical and experimental value of density for SiC filled chopped glass fiber reinforced epoxy composites. It may be noted that the densities values calculated theoretically are not equal to the experimental measured values. Theoretical as well as experimental value of density increases with the increase in the value of SiC content whereas the percent value of void fraction decreases with the increase in the value of SiC content except for 20 wt. % SiC filler reinforcement. Maximum value of void fraction (2.7893%) is for unfilled glass fiber reinforced epoxy composites whereas minimum value of void fraction (0.9964%) is for 15wt. % SiC filled glass fiber reinforcement epoxy composites which clearly shows that due to the small size of SiC particles when embedded with fiber and matrix increases the experimental density whereas decreases the void fraction. Adding SiC filler content beyond 15wt. % may not further reduce the experimental density of GFRE composites. Similar statements are given by Thomason et al.[15] and Lee and Jang[16] reported that when the fiber / filler content are more than the required optimal quantity automatically the physical and mechanical properties of composites reduced.Table 2. Comparison between Experimental density and Theoretical density
 |
| |
|
3.2. Steady State Specific Wear
3.2.1. Effect of Sliding Velocity on Specific Wear Rate of Composites
Steady state specific wear rate is used to determine the effect of change in SiC content on the sliding velocity of SiC filled chopped glass fiber reinforced epoxy composites. Specific wear rate decreases with the increase in the value of sliding velocity. Significant decrease in the value of specific wear rate is noticed with the increase in the value of sliding velocity from 48cm/sec to 72cm/sec further increase in the value of sliding velocity results in slightly decrease in the value of specific wear rate. This is because at higher sliding velocity surface contact between the abrasive rubber wheel and the specimen decreases and hence decrease in the value of specific wear rate. Specific wear rate without SiC content is more for all range of sliding velocity in comparison to when SiC content is added in certain proportion i.e. with the addition of SiC content specific wear decreases. Further from Figure 2 it has been noticed that adding SiC content beyond 10wt. % may not further decrease the value of specific wear rate of the composite.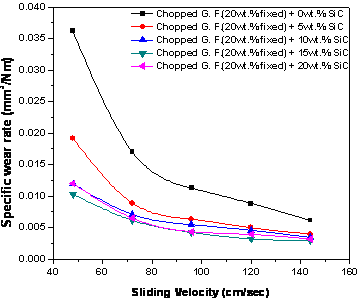 | Figure 2. Effect of sliding velocity on specific wear rate of SiC filled chopped GFRE composites (At constant normal load: 40N, sliding distance: 60m and abrasive size: 375 µm) |
3.2.2. Effect of Normal Load on Specific Wear Rate of Composites
Effect of increase in the value of normal load on specific wear rate is noticed for different wt. % of SiC content. Figure 3 shows that the value of normal load increases with the increase in the value of SiC content. Specific wear rate increases with the increase in the value of normal load up to 80N whereas increasing normal load beyond 80N may not appreciably increase the value of specific wear rate. Further it has been noticed that specific wear rate without adding SiC content is much more in comparison to when the SiC content is added in certain proportion. From Figure 3 it is clear that specific wear rate drops by 44.24% by adding SiC filler content by 5wt. %.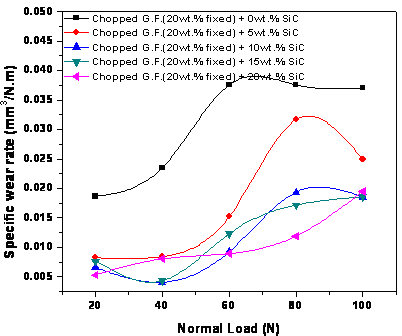 | Figure 3. Effect of normal load on specific wear rate of SiC filled chopped GFRE composites (At constant sliding velocity: 72cm/sec, sliding distance: 60m and abrasive size: 375 µm) |
3.3. Analysis of Experimental Results by Taguchi Experimental Design
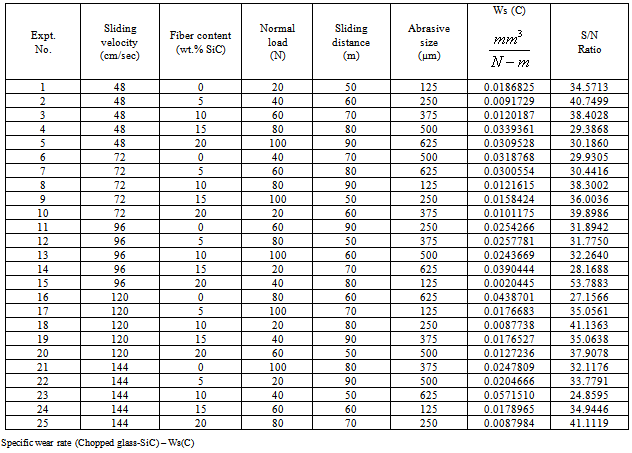
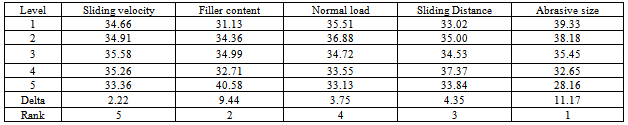
Taguchi experimental approach is applied to determine dominant factors responsible for overall reduction in specific wear rate of SiC filled glass fiber reinforced epoxy composites. Table 3 shows the signal to noise ratio (S/N ratio) of SiC filled glass fiber reinforced epoxy composites. The overall mean value for the S/N ratio for 25 different iterations was found to be 34.7558 db whereas the minimum and maximum value of S/N ratio is 24.8595 db and 53.7883db respectively. The analysis was made using the popular software used for design of experiment applications known as MINITAB 15. The minimum specific wear rate as observed from Figure 4 shows the signal to noise ratio for five factors i.e. sliding velocity, fiber loading, normal load, sliding distance and abrasive particle size. Table 4 represents the response table for signal to noise ratios – Smaller is better value. From Table 4 and Table 5 it has been established that abrasive particle size has more significant effect on specific wear rate of SiC filled chopped glass fiber reinforced epoxy composites followed by filler content, sliding distance, normal load and sliding velocity. 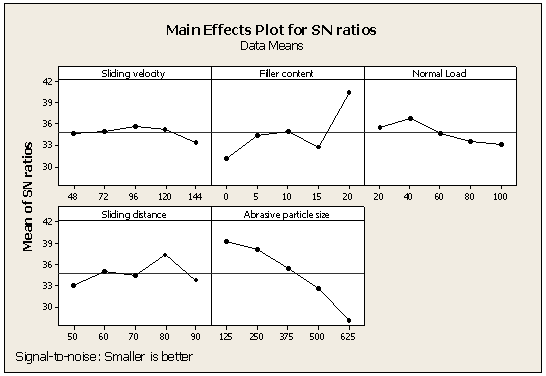 | Figure 4. Signal to noise ratio for sliding velocity, fiber loading, normal load, sliding distance and abrasive particle size |
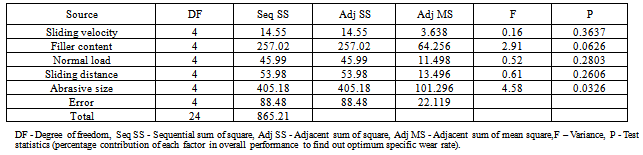
3.4. ANOVA and the Effects of Factors
Analysis of variance (ANOVA) is a statistical tool used to compute the quantities and their significance in order to find out the effect of various factors like sliding velocity, fiber loading, normal load, sliding distance and abrasive particle size on specific wear rate of SiC filled glass fiber reinforced epoxy composites, analysis of variance (ANOVA) is performed based on Taguchi experimental results. Table 4 and Table 5 show the results of the ANOVA with the specific wear rate of SiC filled chopped glass fiber reinforced epoxy composites taken in this investigation. This analysis is undertaken for a level of confidence of significance of 5%. The last column of the table indicates that the main effects are highly significant (all have very small p-values)[Table 4, Column 7].From Table 4, it can be observed for SiC filled chopped glass fiber reinforced epoxy composites that sliding velocity (p = 0.3637%), sliding distance (p = 0.2606%), and normal load (p = 0.2803%) have less influence on specific wear rate.However, abrasive particle size (p = 0.0326%) and filler content (p = 0.0626%) shows more significant contribution on specific wear rate of the composites, where p value shows percentage contribution of each factor in overall performance to find out optimum specific wear rate. Since our aim is to obtain a lower p value i.e. factor with a lowest p value may rank first and factor with a highest p value will placed in last rank. Therefore, from this analysis it is clear that for SiC filled glass fiber reinforced epoxy composites rank of the variables in descending order are Abrasive particle size (1) > Filler content (2) > Sliding distance (3) > Normal load (4) > Sliding velocity (5). Table 3. Experimental design of L25 orthogonal array
 |
| |
|
Table 4. ANOVA table for specific wear rate - Chopped glass fiber - SiC filler (Analysis of Variance for SN ratios)
 |
| |
|
Table 5. Response table for Signal to Noise Ratios – Smaller is better
 |
| |
|
3.5. Surface Morphology
The worn surface of the composites was observed by SEM examination to find out the effect of increase in sliding velocity, sliding distance, abrasive particle size and normal load on the worn surface morphology of the composite specimen. Figure shows the morphology of worn surfaces of unfilled and SiC filled chopped glass fiber reinforced epoxy composites. The photomicrographs of worn surface of 5wt. % SiC filled glass fiber reinforced epoxy composites are as shown in figure 5a. Different contact areas of glass fiber / SiC filler with different amount of epoxy resin during mixing result in different structure along the surface of composite. Holes (pores and voids) are clearly seen through micrograph (Figure 5a) which indicates that void fraction is significantly more in such case (Table 2). Presence of small particle of debris embedded inside the pores as exposed to environment are clearly seen from Figure 5b. Due to bigger size of abrasive particle (625μm) bulk removal of material takes place. The repeated deformation causes cracking on the surface or subsurface of the composite.The photomicrograph of worn surface at 10wt. % SiC filler content is shown in Figure 5(c-d) when 10wt. % SiC filler is added void fraction and specific wear rate significantly reduces. SiC filler reduces micro-ploughing and micro-cracking mechanisms as SiC filler particles due to its small size embedded in between the fiber and the matrix. Figure 5c clearly shows wear tracks and bulk removal of material from the surface of the composite specimen. This is due to repeated movement of the abrasive rubber wheel against the surface of the composite specimen. Uneven surface is due to presence of large amount of worn out fibers and SiC particles on the surface of the composite which results in uneven removal of material from the surface of the composite specimen.The photomicrographs of worn surface of 15wt. % SiC filled glass fiber reinforced epoxy composites are as shown in Figure 5(e-f). Loose SiC particles along with small amount of wear debris is clearly seen from details of the composite specimen for wt. % SiC filler reinforcement and at different magnifications the photomicrographs, parameters at which specific wear rate to be carried out is 72cm/sec sliding velocity, 100N normal load and 250μm abrasive particle size. Since normal load is higher therefore micro-cracking and micro-ploughing are the dominant wear mechanisms resulting in large amount of removal of fiber / filler and matrix material (epoxy resin). Removal of ends and parts of fibers are clearly seen from Figure 5f.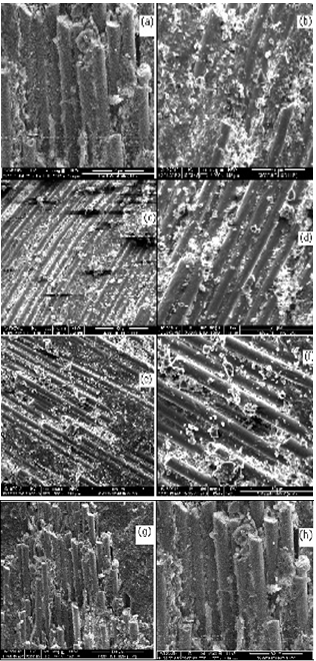 | Figure 5. Photomicrographs showing the surface |
The photomicrographs of worn surface of 20wt. % SiC filled glass fiber reinforced epoxy composites are as shown in figure 5(g-h). Specific wear rate calculated is 8.798 x 10⁻³ mm3/N.cm which is significantly lower because of higher sliding velocity 120cm/sec and normal load 60N. Figure 5g shows the uneven removal of fibers, this may be due to uneven contact of rubber wheel with that of specimen at higher sliding velocity. Also fiber cracking is more dominant i.e. the removal of part / end / piece of fiber takes place.
4. Conclusions
Experimental observations carried out on SiC filled chopped glass fiber reinforced epoxy matrix composite to notice the effect of specific wear rate and surface morphology. Based on the experimental observations, the following conclusions can be drawn:1) Void fraction decreases up to few extents on introduction of SiC filler which in turn increases the strength of the composite. Void fraction varies from 0.9964% to 2.7893% with a minimum at 15wt. % SiC filler content and maximum at 0wt. % SiC filler content.2) Specific wear rate of SiC filled glass fiber reinforced epoxy composite is less in comparison to that of unfilled glass fiber reinforced epoxy composites. This is because of fiber- filler interaction and uniform dispersion of filler content throughout the composite decreases the specific wear rate of composites. Adding SiC filler content beyond 10wt. %may not significantly decrease the specific wear rate of the composite. 3) Specific wear rate of SiC filled glass fiber reinforced epoxy composite increases with increase in normal load whereas specific wear rate of SiC filled glass fiber reinforced epoxy composite decreases with increase in sliding velocity.4) Analysis of variance method gave the significance degree of test parameter. According to the p values abrasive particle size and filler content have more significant effect on the specific wear rate of SiC filled chopped glass fiber reinforced epoxy composites and are therefore rank first and second followed by sliding distance, normal load and sliding velocity. 5) SEM micrographs surface details showed that micro-cracking and micro-ploughing are the dominant wear mechanisms due to brittle fracture of the fibers when subjected to higher normal loads. However addition of SiC filler in certain wt. % helps in reduction of significant amount of wear.
References
| [1] | M. M. Khruschov, “Principles of abrasive wear”, Wear, vol.28, pp.69–88, 1974. |
| [2] | W. M. Garrison Jr., “Abrasive wear resistance: the effects of ploughing and the removal of ploughed materials”, Wear, vol.114, pp.239–247, 1987. |
| [3] | Nam P. Suh, “Tribophysics”, Englewood Cliffs, NJ: Prentice-Hall, 1986. |
| [4] | B. Suresha, B. N. Ramesh, K. M. Subbaya, B. N. Ravi Kumar, G. Chandramohan, “Influence of graphite filler on two body abrasive wear behavior of carbon – fabric reinforced epoxy composites”, Materials and Design, vol.31, pp.1833–1841, 2010. |
| [5] | Bahadur S, Gong D, Anderegg J, “Investigation of the influence of CaS, CaO and CaF2 fillers on the transfer and wear of nylon by microscopy and XPS analysis”, Wear, vol.197, no.(1-2), pp.271–279, 1996. |
| [6] | K. Tanaka, “Effect of various fillers on the friction and wear of PTFE-based composites”, In: Friedrich K, editor. Friction wear of polymer composites, Amsterdam: Elsevier, vol.205, pp.137–174, 1986. |
| [7] | S Chandra, D Avadhani, G. S. Kishore, “Effect of SiC particles on the mechanical properties of glass-phenolic composites” In: Materials Science and Engineering A, vol.136, no.30, pp.179-182, 1991. |
| [8] | D. M. Bigg, “Mechanical properties of particulate filled polymers”, Polym Compos, vol.8, pp.115, 1887. |
| [9] | M. J. Zaini, Z. Ismail, M. Y. A. Fuad, J. Mustafah, “The effect of filler content and the size on the mechanical properties of polypropylene/oil palm wood flour composite”, Polym Int, vol.40, pp.51–56, 1995. |
| [10] | Y. Feng, Y. Zhou, L. T. Quan, Y. Jue-Ming, Z. Li-Tong, “Microstructure and Mechanical Properties of SiCw/BAS Glass-Ceramic Composites”, Journal of inorganic materials, vol.15, no.3, pp.516-520, 2000. |
| [11] | B. D. Agarwal, I. J. Broutman, “Analysis and performance of fiber composites”, 2nd ed., Wiley, New York. |
| [12] | R. Roy, “A primer on the taguchi method”, Competitive manufacturing series, New York. |
| [13] | N. Vuchkov, L. N. Boyadjieva, “Quality Improvement with Design of Experiments: A Response Surface Approach”, Kluwer Academic Publishers, Dordrecht 2001 |
| [14] | ASTM D 2734, “Standard Test Method for Void Content of Reinforced Plastics”, Annual Book of ASTM Standards, ASTM, West Conshohocken, PA. |
| [15] | J. L. Thomason, M. A. Vlug, G. Schipper, H.G.L.T. Krikor, “The influence of fibre length and concentration on the properties of glass fibre-reinforced polypropylene: part 3. Strength and strain at failure”, Composites Part A, vol.27A, pp.1075-1084, 1996. |
| [16] | N. J. Lee, J. Jang, “The effect of fibre content on the mechanical properties of glass fibre mat/ polypropylene composites”, Composites A, vol.30, no.6, pp.815-822, 1999. |
 Abstract
 Reference
 Full-Text PDF
 Full-text HTML