-
Paper Information
- Previous Paper
- Paper Submission
-
Journal Information
- About This Journal
- Editorial Board
- Current Issue
- Archive
- Author Guidelines
- Contact Us
International Journal of Composite Materials
p-ISSN: 2166-479X e-ISSN: 2166-4919
2012; 2(5): 101-114
doi: 10.5923/j.cmaterials.20120205.06
Mechanical and Dry Sliding Wear Behavior of Particulate Fillers CaCO3 and CaSO4 Filled Vinyl ester Composites
 Abstract
 Reference
 Full-Text PDF
 Full-Text HTML
Sandeep Kumar 1, Sant Ram Chauhan 2
1Department of Mechanical Engineering, Lovely Professional University, Phagwara, Punjab, 144402, India
2Department of Mechanical Engineering, National Institute of Technology, Hamirpur, 177005, India
Correspondence to: Sandeep Kumar , Department of Mechanical Engineering, Lovely Professional University, Phagwara, Punjab, 144402, India.
| Email: |  |
Copyright © 2012 Scientific & Academic Publishing. All Rights Reserved.
The improved performance of polymers and their composites in industries and many other applications by the addition of particulate fillers has shown great advantages and so has lately been the subject of considerable interest. In this paper, mechanical and tribological behavior of particulate fillers CaCO3 and CaSO4 filled vinyl ester composites have been presented. Wear tests were carried out in dry sliding conditions on a pin-on-disc friction and wear test rig. (DUCOM) at room temperature under sliding velocity (1.57, 2.62 and 3.67 m/sec.), normal load (20, 40 and 60 N), filler content (0, 10 and 20 wt.%) and sliding distance (1000, 3000 and 5000 m). The plans of experiments is based on the Taguchi technique, was performed to acquire data in a controlled way. An orthogonal array and analysis of variance (ANOVA) were applied to investigate the influence of process parameters on the coefficient of friction and sliding wear behaviour of these composites. The coefficient of friction and specific wear rate were significantly influenced with increase in both the filler content. The results show that for pure vinyl ester the coefficient of friction and specific wear rate increases with the increase of normal load, sliding velocity and sliding distance. The coefficient of friction and specific wear rate for CaCO3 filler decreases with the increase of filler content. But, for filler CaSO4 the coefficient of friction and specific wear rate decreases at 10 wt.% and then increases at 20 wt.%. It is believed that a thin film formed on stainless steel counterface was seems to be effective in improving the tribological characteristics. The worn surfaces examined through SEM to elucidate the mechanism of friction and wear behaviour.
Keywords: Sliding Wear, Polymer-Matrix Composites, Fillers, Scanning Electron Microscopy
Cite this paper: Sandeep Kumar , Sant Ram Chauhan , "Mechanical and Dry Sliding Wear Behavior of Particulate Fillers CaCO3 and CaSO4 Filled Vinyl ester Composites", International Journal of Composite Materials, Vol. 2 No. 5, 2012, pp. 101-114. doi: 10.5923/j.cmaterials.20120205.06.
Article Outline
1. Introduction
- An informal number of papers dealing with the tribological behaviors of polymer materials have been published. That is why the polymers are extending over a great area used in sliding components like such as gears, cams, breaks, clutches, bearings, wheels and bushes. Adhesive wear includes galling, fretting, scuffing and surface fatigue. This refers to the damage produced when two mating surfaces move relative to each other under a normal load. Surface asperities interact and very high stresses, strain, and strain rates are generated in localized regions[1]. This type of wear occurs in bearings, piston rings, cylinders and in electrical contacts. In recent years attention has been focused on the sliding wear behavior of polymers and their composites due to their increasing use as bushings and seals in machinery.The research by various authors[2-4] reported that the friction between polymers can be attributed by the two main mechanisms i.e, deformation and adhesion. The From the point of view of the coefficient of friction, Brentnall and Lancaster[6] reported that the friction coefficient of polymers rubbing against metals decreases with the increase in load. Some researchers[7-9] reported that the coefficient off friction value increases with the increase in load. Finally, Byett and Allen[10] and Friedrich et al.[11] have reported that the coefficient off friction value increases with the increase in load. Many polymeric materials have an excellent strength-to-weight ratio, good corrosion resistance, wider choice of the materials, dimensional stability, high impact strength, light weight and ease to manufacturing. Some polymers also possess excellent tribological properties[12]. The polymers can be considered to be one of the competitive materials for tribological applications because of their low friction values against steel counterparts, good damping properties, and self lubricating abilities.It has been observed that by assimilating filler particles in the polymer based composites, synergistic effects may be achieved in the form of higher modulus and reduction of the material cost[13-15]. The inclusion of such particles into polymers for commercial applications is focused at the cost reduction and stiffness improvement[16, 17]. Various kinds of polymers and polymer-matrix composites with different types of fillers such as Al2O3, SiC, TiO2, fly ash etc. have been the subject of extensive research in recent years as found from the literature[18-21]. But the potential of particulate fillers CaCO3 and CaSO4 in vinyl ester matrix has not been reported so far. So, in this paper we are using these fillers (CaCO3 and CaSO4) with vinyl ester matrix and studying the effect of such fillers on mechanical and dry sliding wear behavior of the composites. Polymer composites containing different fillers and/or reinforcements that are frequently used for applications like automotive parts, gear assemblies, tub/ shower industries etc. in which friction and wear are critical issues. Calcium carbonate (CaCO3) and calcium sulfate (CaSO4) are the fillers, which are used in the automobile parts and tub/ shower industries respectively. However, study of the effect of such filler addition is necessary to ensure that the mechanical properties of the composites are not affected adversely by the addition of such fillers.The importance of mechanical and tribological properties has convinced many researchers to study the friction and wear behaviour and to improve the wear resistance of polymer based composites. From the above mentioned literature it is understood that there is tremendous potentials of these fillers used for research on vinyl ester composites and studied under dry sliding conditions. Since, the purpose of this paper is to study the mechanical and dry sliding wear behaviour of fillers CaCO3 and CaSO4 filled vinyl ester composites. Taguchi method is used to optimize the process parameters of sliding wear in order to reduce the number of experiments without sacrificing the information.
2. Experimental Details
2.1. Specimen Preparation
- The matrix used in this work is vinyl ester resin (density 1.28 gm/cc) was supplied by Northern Polymer Pvt. Ltd. New Delhi. Methyl ethyl ketone peroxide (MEKP- 1.5%), Cobalt Naphthenate (1.5%) was used as catalyst and accelerator respectively. Three different types of composites are prepared for the study. The Calcium Sulfate (CaSO4) and Calcium Carbonate (CaCO3) having particle size 1.813 µm and 1.620 µm respectively were used as a filler material collected from the Pioneer Chemical Corporation, Delhi.The composites are made homogeneously. Firstly they are properly sterilized in a jar and then simply pour into the 10mm diameter test tubes. There are three different types of composites are made for the current study with 0, 10 and 20 wt.% of the filler content. The accelerator Cobalt Naphthenate 1.5% is mixed thoroughly in vinyl ester resin and then catalyst 1.5% Methyl ethyl ketone peroxide (MEKP) was mixed in the resins prior to reinforcement. Before pouring the composite solution in the test tube, the test tube is sprayed with a release agent (Silicon spray) to ensure that the part will not adhere to the test tube after the curing of the composites samples. The cast of each composite is cured for 24 hour at room temperature before it is removed from the test tube. The other composite samples with fillers CaCO3 and CaSO4 of fixed weights (10 wt.% and 20 wt.%) percentage were fabricated by the same technique. The fillers CaSO4 and CaCO3 were mixed thoroughly in the vinyl ester resin mechanically before pouring into the test tubes. The composites prepared for this study are designated as WCGV1, WCGV2, WCGV3, WCGV4, and WCGV5 respectively. The composition and designation of the composites prepared for this study are listed in Table 1.
2.2. Friction and Wear Test Apparatus
- Dry sliding wear tests were conducted on a pin-on-disc friction and wear monitoring test rig (DUCOM) as per ASTM G 99. The cylindrical pin specimens of 10mm diameter and 30mm length were tested against a disc made of hardened ground steel (EN-32, hardness 72HRC, surface roughness Ra= 0.07 µm). The specimen was held stationary and the disc was rotated while a normal force was applied through a lever mechanism. The schematic diagram of the pin-on-disc apparatus is shown in the Figure 1. During the test, frictional force was measured by the transducer mounted on the loading arm. The frictional force readings were taken as the average of 100 readings of every 40 seconds for the required time period. For this purpose a microprocessor controlled data acquisition system was used. The average mass loss was used to calculate to the specific wear rate (Ks). The tests were conducted with sliding velocity (1.57, 2.62, 3.67 m/sec.), normal load (20, 40, 60 N), filler content (0, 10, 20 %) for the sliding distance of 1000, 3000 and 5000 m. Sliding wear data reported here is the average of two runs. The initial weight before run and final weight after run is measured using a precision electronic balance with an accuracy of ± 0.01 mg. The specific wear rate (mm3/Nm) is then expressed on ‘volume loss’ basis.

| ||||||||||||||||||||||||||||||||||||
 is the mass loss in the test duration in gm,
  is the density of the composite (gm/cm3), Fn is the applied normal load (N), L is the sliding distance (m). The parameters setting and levels for various control factors for wear test are shown in the Table 2.
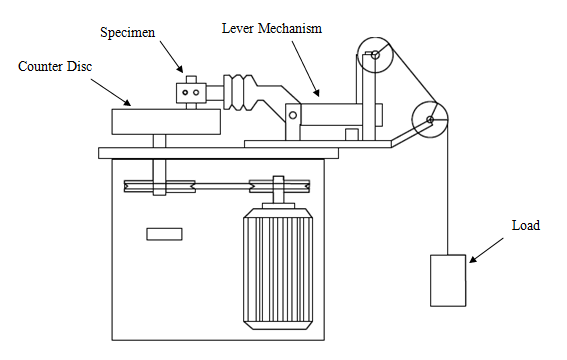 | Figure 1. Schematic diagram of pin-on disc apparatus |
2.3. Scanning Electron Microscopy
- A FEI quanta FEG450 was used to analyze the worn surfaces of the polymer composites. The composite samples are mounted on stubs with gold plating. To enhance the conductivity of the samples, thin films of platinum are vacuum evaporated onto them before the photomicrographs were taken.
2.4. Experimental Design
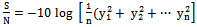
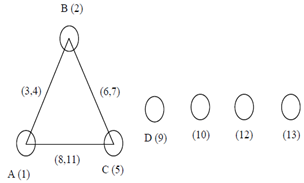
- Taguchi design of experiment is a powerful analysis tool which is adopted for optimizing design parameters. Taguchi method provides the designer with a systematic and efficient approach for experimentation to determine near optimum settings of design parameters for performance, quality and cost[22-25]. The most important stage in the design of experiment lies in the selection of the control factors. In the present work, the impact of the four such factors are studied using L27 (313) orthogonal array which has 27 rows corresponding to the number of tests (20 degree of freedom) with 13 columns at three levels. The operating conditions under which sliding wear tests carried out are given in the Table 2.In conventional full factorial experimental design, it would require 34 = 81 runs to study four factors each at three levels whereas, Taguchi’s factorial experiment approach reduces it to only 27 runs offering a great advantage in terms of experimental time and cost. The experimental observations are transformed into a signal-to-noise (S/N) ratio. There are three S/N ratios available depending upon the type of characteristics (smaller-the-better, larger-the-better, nominal-the better). The S/N ratio for minimum (friction and wear rate) coming under smaller is better characteristic, which can be calculated as logarithmic transformation of the loss function as shown below[26]
 | (1) |
 | Figure 2. Linear graphs for L27 array |
3. Results and Discussion
- The characterization of the composites reveals that inclusion of any particulate filler has very strong influence not only on the mechanical properties of composites but also on their sliding wear behavior. By incorporating these particulate fillers into the vinyl ester matrix, synergistic effects, as expected were achieved in the form of modified mechanical properties and improved sliding wear resistance. A comparative study of modified behavior of the composites against the two different types of fillers is presented.
3.1. Density
- The composite under this investigation consists of three components such as matrix, fiber and particulate filler. Hence, the density of the composite can be calculated using rule-of-mixture as shown in the following expression Agarwal and Broutman[27].
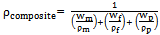 | (2) |
 of the composite, however, can be determined by simple water immersion technique (Archimedes principle). The volume fraction of voids (Vv) in the composites is calculated using the following equation:
 | (3) |
|
3.2. Mechanical Properties
- The experimental values of the properties of the particulate filled CaCO3 and CaSO4 composites under this investigation are presented in Table 4.
|
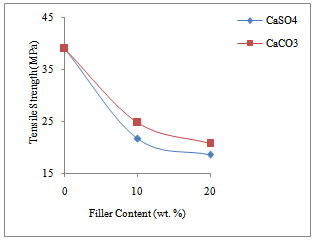 | Figure 3. Variation of tensile strength of composites with filler type and content |
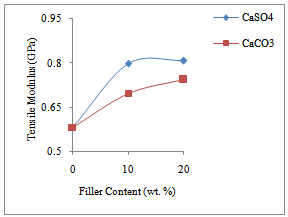 | Figure 4. Variation of tensile modulus of composites with filler type and content |
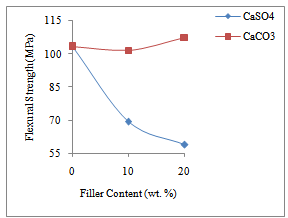 | Figure 5. Variation of flexural strength of composites with filler type and content |
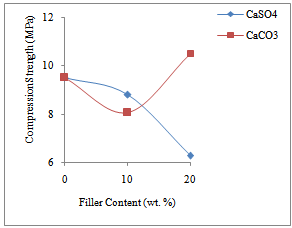 | Figure 6. Variation of compression strength of composites with filler type and content |
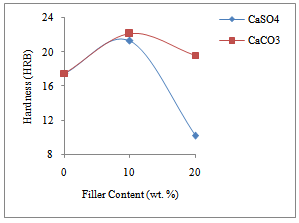 | Figure 7. Variation of Rockwell hardness of composites with filler type and content |
3.3. Analysis of Experimental Results
- On the other hand, from Table 8 the overall mean for the S/N ratio of the coefficient of friction and the specific wear rate for CaSO4 are found to be 3.3670 db and 89.8949 db respectively. Here, we saw that the overall mean for the S/N ratio of the coefficient of friction and specific wear rate is more in CaCO3 in comparison to CaSO4 which means that the coefficient of friction and specific wear rate is less in CaCO3. The analysis of the experimental data is carried using the software MINITAB 16 specially used for the design of experiment applications. Before analyzing the experimental data using this software for predicting the measure of performance, the possible interaction between control factors are considered. Thus factorial design incorporates a simple means of testing for the presence of the interaction effects.
|
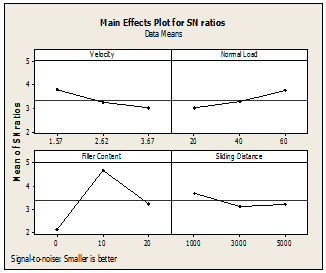
 | Figure 8. Effect of control factor on Coefficient of friction. (For CaCO3) |
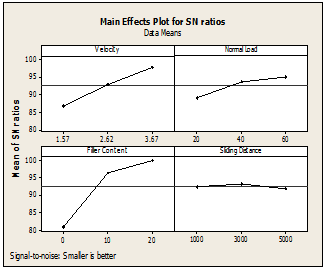 | Figure 9. Effect of control factor on Specific wear rate. (For CaCO3) |
 | Figure 10. Effects of control factor for coefficient of friction. (For CaSO4) |
 | Figure 11. Effect of control factor on Specific wear rate. (For CaSO4) |
3.4. ANOVA and Effects of Factors
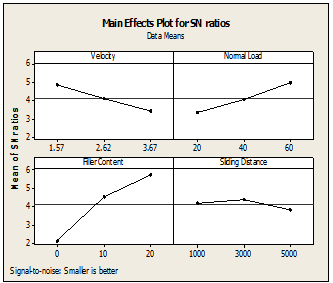
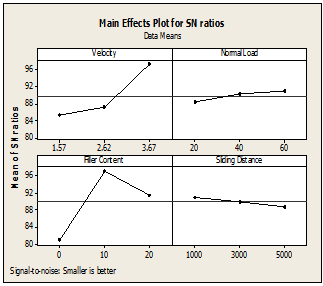
- In order to understand the impact of various control factors like velocity (A), normal load (B), filler content (C) and sliding distance (D) and interaction on the response of experimental data it is desirable to develop the analysis of variance (ANOVA) to find the significant factors as well as interactions. ANOVA allows analyzing the influence of each variable on the total variance of the results. For CaCO3, Table 6a shows the results of ANOVA for the specific wear rate and Table 7a shows the results of ANOVA for coefficient of friction and for CaSO4, Table 9a shows the results of ANOVA for the specific wear rate and Table 10a shows the results of ANOVA for coefficient of friction. The analyses are performed with a level of significance 5% means at 95% level of confidence. In ANOVA table, the column shows the percentage contribution (P) of each variable in the total variation indicating the influence of specific wear rate and coefficient of friction.For filler CaCO3 it can be observed from the ANOVA Table 6a for specific wear rate that the filler content (P=57.981%), velocity (P=17.981%), normal load (P=5.523%) and the interactions A×C (P=10.218%), B×C (P=3.283) and A×B (P=3.097%) has significant influence on the specific wear rate. However, the control factor sliding distance (P=0.303%) does not have a significant effect (both physically and statistically) on specific wear rate as their values are quit smaller than error (P=1.613%) so they are neglected. From the analysis of ANOVA and response Table 6b of the S/N ratio of specific wear rate, it is observed that the control factor filler content (C) has major impact on the specific wear rate followed by velocity (A), normal load (B) and sliding distance (D). It means that with increasing the filler content, velocity and normal load the specific wear rate decreases i.e., increase the wear resistance as observed from the Figure 9.
|
|
|
|
|
|
|
|
|
3.5. Surface Morphology
- Figures 12a-c are the SEM pictures of composites for minimum, maximum and nominal wear test conditions for CaCO3 filled vinyl ester composites. It has been found from the experimental analysis that the minimum wear occurs at 3.67 m/sec., 60 N, 20 wt. %, 1000 m test parameter conditions, the maximum wear occurs at 3.67 m/sec., 20 N, 0 wt. %, 5000 m test parameter conditions and the nominal wear occurs at 3.67 m/sec., 20 N, 10 wt. %, 1000 m test parameter conditions as shown in the Figures 12a-c.The micrograph in Figure 12a shows the resinous and matrix region. The filler CaCO3 covered the matrix region which results in less wear. Figure 12b shows the debris and wedge formation regions due to long sliding distance. Vinyl ester debris was adhered into the filler region and micro cracks were identified which increases the wear rate. Figure 12c showing the thin layer formation and debris which results the nominal wear.Similarly, Figures 13a-c are the SEM pictures of composites for minimum, maximum and nominal wear test conditions for CaSO4 filled vinyl ester composites. It has been found from the experimental analysis that the minimum wear occurs at 3.67 m/sec., 60 N, 10 wt. %, 5000 m test parameter conditions, the maximum wear occurs at 3.67 m/sec., 20 N, 0 wt. %, 5000 m test parameter conditions and the nominal wear occurs at 3.67 m/sec., 20 N, 20 wt. %, 3000 m test parameter conditions as shown in the Figures 13a-c.
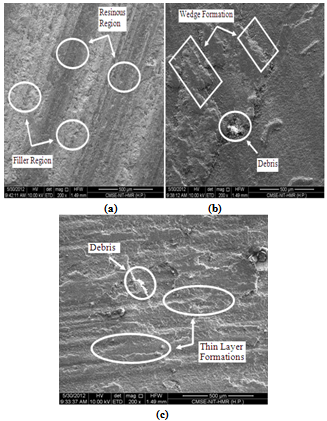 | Figure 12. SEM pictures of composites at (a) 3.67 m/sec., 60N, 20 wt. %, 1000 m (b) 3.67 m/sec., 20N, 0 wt. %, 5000 m (c) 3.67 m/sec., 20N, 10 wt. %, 1000 m. (For CaCO3 filled vinyl ester composites) |
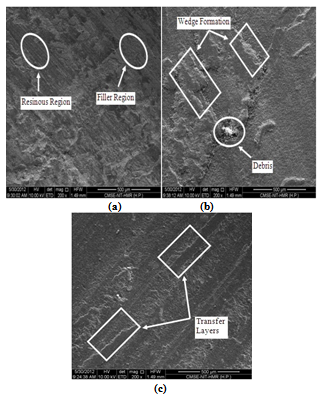 | Figure 13. SEM pictures of composites at (a) 3.67 m/sec., 60N, 10 wt. %, 5000 m (b) 3.67 m/sec., 20N, 0 wt. %, 5000 m (c) 3.67 m/sec., 20N, 20 wt. %, 3000 m. (For CaSO4 filled vinyl ester composites) |
3.6. Confirmation Experiments
- The confirmation experiment is the final step in the design of experiments process. It predicts and verifies the improvements in the observed values through the use of optimal combination level of control factors. For filler CaCO3, the confirmation experiment was performed by taking an arbitrary set of factor combination A2 B2 C3 D1 to predict the coefficient of friction and for specific wear rate factor setting is A2 B2 C1 D1. Now, the estimated S/N ratio for coefficient of friction can be calculated with the help of the following predictive equation.
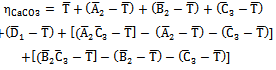 | (4) |
 is the predicted average of CaCO3 for coefficient of friction,
  is the overall experimental average
 and
and  is the mean response for factors and interactions at designed levels. By combining all the terms Eq. (4) reduces to
 | (5) |
 = 5.6781 db. For each of performance measures an experiment is conducted for different combination of factors and results are compared with those obtained from the predictive equation as shown in the Table 11. Similarly a predictive equation is developed for estimating S/N ratio of specific wear rate as shown in Eq. (6).
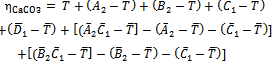 | (6) |
 is the predictive average of CaCO3 for specific wear rate,
  is the overall experimental average
 and
and  is the mean response for factors and interactions at designed levels. By combining all the terms Eq. (6) reduces to
 | (7) |
 = 81.1478 db. For each of performance measures an experiment is conducted for the prediction equation as shown in Table 11. The resulting equations seem to be capable of predicting the coefficient of friction and specific wear rate. An error of 6.49% for the S/N ratio of the coefficient of friction and 5.41% for the S/N ratio of the specific wear rate is observed.
| ||||||||||||||||||||||||||
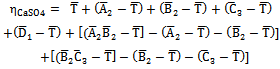 | (8) |
 is the predicted average of CaSO4 for coefficient of friction,
  is the overall experimental average
  and
and  is the mean response for factors and interactions at designed levels. By combining all the terms Eq. (8) reduces to
 | (9) |
 = 3.2593 db. For each of performance measures an experiment is conducted for different combination of factors and results are compared with those obtained from the predictive equation as shown in the Table 12. Similarly a predictive equation is developed for estimating S/N ratio of specific wear rate as shown in Eq. (10).
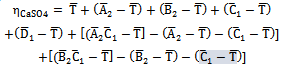 | (10) |
 is the predictive average of CaSO4 for specific wear rate,
  is the overall experimental average
  and
and  is the mean response for factors and interactions at designed levels. By combining all the terms Eq. (10) reduces to
 | (11) |
 = 82.2855 db. For each of performance measures an experiment is conducted for the prediction equation as shown in Table 12. The resulting equations seem to be capable of predicting the coefficient of friction and specific wear rate. An error of 9.18% for the S/N ratio of the coefficient of friction and 8.04% for the S/N ratio of the specific wear rate is observed.
| |||||||||||||||||||||||||
4. Conclusions
- An experimental study has been carried out for friction and dry sliding wear of vinyl ester matrix with fillers CaCO3 and CaSO4 sliding against smooth stainless steel counterface using Taguchi experimental design. Taguchi’s design of experiment method can be used to analyze the coefficient of friction and the dry sliding wear of polymer matrix composites as presented in this research paper. The following conclusions can be drawn from the present study:-(1) The tensile strength for both the fillers CaCO3 and CaSO4 decreases with the increase of the filler content. While the tensile modulus for both the fillers increases with the increase of filler content.(2) For filler CaCO3, flexural and compressive strength increases with the increase of filler content. While, hardness is increases at 10 wt.% and then decreases at 20 wt.%.(3) For filler CaSO4, flexural and compressive strength decreases with the increase of filler content. While, the hardness is increases at 10 wt.% and then decreases at 20 wt.% as same in case of CaCO3 filler content.(4) For pure vinyl ester the coefficient of friction and specific wear rate increases with the increase of normal load, sliding velocity and sliding distance.(5) The coefficient of friction and specific wear rate for CaCO3 filler decreases with the increase of filler content. But, for filler CaSO4 the coefficient of friction and specific wear rate decreases at 10 wt.% and then increases at 20 wt.%.(6) For both the fillers CaCO3 and CaSO4 it is observed that the control factor filler content (C) has major impact on the specific wear rate followed by velocity (A), normal load (B) and sliding distance (D).(7) The predictive equations based on Taguchi approach is successfully used for the prediction of effect of four control factors and predicted results are consistent with the experimental observations.(8) It is demonstrated that Taguchi approach based on ANOVA well reflect the effects of various factors on the friction and sliding wear loss.The significance of this current research is to create the interest between the various young researchers towards such fillers which are good not only in the mechanical behaviour but also good in the friction and dry sliding wear behaviour.
ACKNOWLEDGEMENTS
- Although the interpretations and opinions expressed in this paper are our own. They are based upon the experimental work and are carried out in National Institute of Technology, Hamirpur. We would like to thank NIT Hamirpur for their able support. We would also like to thank Vivek Ramdas Desale and Akant Kumar Singh for their valuable support in between the work.
References
| [1] | C. Allen, A. Ball, “A review of the performance of engineering materials under prevalent tribological and wear situations in South African industries”, Tribology International, vol. 29, No. 2 pp. 105-116, 1996. |
| [2] | J.K. Lancaster, Wear, vol. 141, pp. 59-183, 1990. |
| [3] | I.M. Hutchings, “Tribology: Friction and wear of engineering materials”, London: Edward Arnold pp. 51, 1992. |
| [4] | U.S. Tewari, S.K. Sharma, P. Vasudevan, Rev Macromol Chem Phys, vol. 29(1) pp. 1-38, 1989. |
| [5] | S.E. Franklin, “Wear experiments with selected engineering polymers and polymer composites under dry reciprocating sliding conditions”, Wear, vol. 251, pp. 1591-1598, 2001. |
| [6] | A.B. Brentnall, J.K. Lancaster, “Proceedings of the Wear of Materials Congress”, ASME, pp. 596-603, 1989. |
| [7] | S. Bahadur, D. Tabor, “Role of fillers in the friction and wear behavior of high-density polyethylene”, In: Lee LH, editor, Polymer wear and its control, ACS Symposium Series, Washington (DC): ACS, pp. 253-268, 1985. |
| [8] | H. Unal, A. Mimaroglu, “Friction and wear behavior of unfilled engineering thermoplastics”, Mater Des vol. 24, pp. 183-187, 2003. |
| [9] | H. Unal, A. Mimaroglu, “Influence of test conditions on the tribological properties of polymer”, J Ind Lubrication Tribol vol. 55(4), pp. 178-183, 2003. |
| [10] | J.H. Byett, C. Allen, “Dry sliding wear behavior of PA 66 and PC composites”, Tribol Int, vol. 25, pp. 237-246, 1992. |
| [11] | K. Friedrich, Z. Lu, A.M. Mager, “Recent advances in polymer composites tribology”, Wear, vol. 190 pp. 139-144, 1995. |
| [12] | S.W. Zhang, “State of the art of polymer tribology”, Trends Tribol., pp. 469-481. |
| [13] | B. Pukanszky, “Particulate filled polypropylene: Structure and properties. In: Karger-Kocsis J (ed) Polypropylene: structure”, blends and composites, Chapman & Hall, London, 1995. |
| [14] | J.L. Acosta, E. Morales, M.C. Ojeda, A. Linares, “Effect of addition of sepiolite on the mechanical properties of glass fiber reinforced polypropylene”, Angew Makromol Chem., vol. 138, pp. 103-110, 1986. |
| [15] | S.W. Gregory, KD. Freudenberg, P. Bhimaraj, LS. Schadler, “A study on the friction and wear behavior of PTFE filled with alumina nanoparticles”, Wear vol. 254, pp. 573-580, 2003. |
| [16] | R.N. Rothon, “Mineral fillers in thermoplastics: filler manufacture”, Adhesion, vol. 64, pp. 87-109, 1997. |
| [17] | R.N. Rothon, “Mineral fillers in thermoplastics: filler manufacture and characterization”, Adv Polym Sci vol. 139, pp. 67-107, 1999. |
| [18] | A. Patnaik, A. Satapathy, S.S. Mahapatra, RR. Dash, “Modeling and prediction of erosion response of glass reinforced polyester-flyash composites”, J Reinf Plast Compos vol. 28 pp. 513-536, 2009. |
| [19] | A. Patnaik, A. Satapathy, S.S. Mahapatra, R.R. Dash, “Parametric optimization of erosion wear of polyester-GF-alumina hybrid composites using Taguchi method”, J Reinf Plast Compos vol. 27, pp. 1039-1058, 2008. |
| [20] | A. Patnaik, A. Satapathy, S.S. Mahapatra RR. Dash, “Implementation of Taguchi design for erosion of fiber reinforced polyester composite systems with SiC filler”, J Reinf Plast Compos vol. 27, pp. 1093-1111, 2008. |
| [21] | A. Patnaik, A. Satapathy, S.S. Mahapatra, R.R. Dash, “Erosive Wear Assesment of Glass Reinforced Polyester-Flyash Composites using Taguchi Method”, International Polymer Processing vol. XXIII, pp. 192-199, 2008. |
| [22] | Pj. Ross, “Taguchi techniques for quality engineering”, New York, Mc Graw Hill, 1995. |
| [23] | S.H. Park, “Robust design & analysis for quality engineering”, London, Chapman & Hall, 1996. |
| [24] | M.S. Phadke, “Quality engineering using robust design”, New Jersey: Prentice Hall Englewood & Cliffs, 1989. |
| [25] | G. Taguchi, “Introduction to quality engineering”, Tokyo, Asian Productivity Organization, 1990. |
| [26] | K. R. Roy, “A primer on Taguchi method”, Van Nostrad reinhold, New York, 1990. |
| [27] | B.D. Agarwal, Lj. Broutman, “Analysis and performance of fiber composites”, 2nd edition John Wiley and Sons, Inc, 1990. |
| [28] | Tensile properties of fiber-resin composites ASTM D 3039-76, American National Standard, 1976. |
| [29] | American society for testing and materials (astm). in: standard test method for apartment interlaminar shear strength of parallel fiber composites by short beam method, astm d 2344-84. west conshohocken (pa): annual book of astm standards, astm, pp. 15-7, 1984. |