Md. Mehedi Hashan1, 2, Santanu Das3, Mithon Majumder1, Ashique UL Haque3, Md. Kawsar Hossain3, Deng Zhongmin1
1School of Textile Science and Engineering, Wuhan Textile University, Wuhan, China
2School of Textile Science and Engineering, Southeast University, Dhaka, Bangladesh
3School of Textile Chemistry and Chemical Engineering, Wuhan Textile University, Wuhan, China
Correspondence to: Md. Mehedi Hashan, School of Textile Science and Engineering, Wuhan Textile University, Wuhan, China.
| Email: |  |
Copyright © 2017 Scientific & Academic Publishing. All Rights Reserved.
This work is licensed under the Creative Commons Attribution International License (CC BY).
http://creativecommons.org/licenses/by/4.0/

Abstract
Sewing process is one of the most important stages in labor intensive ready-made clothing enterprises. Quality faults occurring during this process adversely affect the product quality and product efficiency, and also increase the production cost. The aim of this study is to investigate whether the knitwear production process is under control in a knitwear production enterprise and to detect the processes with highest rates of sewing faults in sewing department and finally to make suggestions for improving the quality control. Among the Statistical Process Control methods; control list, product control chart were used in the study. “Product control chart” was used to test whether the production process is controlled in the enterprise. Furthermore, the statistical methods were employed to determine the issues that need to be done in the improvement efforts and to detect the relations between the process groups supposedly effective on faults occurring in knitwear production and the amount of faults. Also, the processes with highest amounts of sewing faults and the effects of these processes on fault rates were investigated. As a result, it was concluded that the production process was statistically not under control in the ready-made clothing enterprise. In addition, this study demonstrated that the investigation of each process group by drawing their product control charts would make significant contributions to foresee the results and prepare more effective the improvement plans.
Keywords:
Sewing, Extra time for fault, Hamper monthly, Cost Rectification, Causes and Remedies
Cite this paper: Md. Mehedi Hashan, Santanu Das, Mithon Majumder, Ashique UL Haque, Md. Kawsar Hossain, Deng Zhongmin, Impact Analysis of Sewing Faults: A Cost Saving Approach in Garments Production Unit, International Journal of Clothing Science, Vol. 4 No. 1, 2017, pp. 1-11. doi: 10.5923/j.clothing.20170401.01.
1. Introduction
As the global economic condition changing in a rapid motion, generally in an industry more focus is given on profit margin, customer demand for high quality product and improved productivity [1]. In garment manufacturing, it is usual that there will be few rejected garments after shipment. Reasons are most of the manufacturers believed that garments are soft goods and non-repairable defect may occur due to low quality raw materials or faulty process or employee casual behaviour [2]. Bangladesh at sewing section to identify reworks so as to eliminate them for saving time, cost and improved product quality [3]. By reacting quicker in minimization of reworks to make a product as per customer demand with expected quality, the company can invest less money and more costs savings [4, 5]. However, factory must have check points to control over this issue. There is no ready-made solution that can reduce rejection percentage overnight. Each order is unique. But this paper work suggests how to handle such problems and bring down rejection rate to minimum with quality production [6, 7]. As we see a lot of rejected garment after shipment, most of the organization termed these garments as rejected because those garments can’t be repaired by any means [8, 9]. Reworks in the garments industry is a common works that hampers the smooth production rate and focus poor quality products having an impact on overall factory economy [10]. Minimization of reworks is a must in quality and productivity improvement. Reworks are a vital issue for poor quality product and low production rate [11]. Reworks are the non productive activities focusing on any activity that customer are not willing to pay for. Nonproductive activities describe that the customer does not consider as adding value to his product [12, 13]. Bangladesh at sewing section to identify reworks so as to eliminate them for saving time, cost and improved product quality. Sewing fault is the non-productive activities focusing on any activity that customer are not willing to pay for [14, 15]. Sewing fault in the garments industry is a common works that hampers the smooth production. Focus poor quality products having an impact on overall factory economy [16, 17]. Minimization of sewing fault is a must for quality and productivity improvement, Sewing fault is issue for poor quality product and low production rate [7]. Sewing fault increases the cost of the product, Sewing fault increase the wastes of time, Sewing fault increases of rework time, Causes of sewing fault poor product quality. So, the main purpose of this project is Minimization of the sewing fault and reworking cost save [18, 19].
2. Experimental
2.1. Methodology
We performed our work in a 8 line Garment Factory. But we have taken 1 line data to complete our study. It was well equipped with modern Sewing machineries such as Over lock machine(brand- JUKI, Origin-Japan), Single needle vertical machine(brand-BROTHER, Origin- Japan), Single needle lock stitch machine(brand- SINGER, Origin-USA), Flat lock medium cylinder(brand- JUKI, Origin-Japan), Flat lock roise cutter( brand- JUKI, Origin-Japan) etc. Each line contains 26 machines. We worked on a basic T-shirt. Our working methods are as follows. First of all we checked all the machines conditions, maintenance system and other performance. We worked for sewing a Basic T-shirt. (1) Accordingly we have selected 10 faults for accurate analysis.
(2) We displayed the number of target production per hour at the end of the line. (3) Then we have taken data from displayed board.
(4) We accumulated the data of per hour production after end of the day.
(5) We filled our analytical data table & drew a graphical presentation in our research to realize the fact successfully. (6) By the same process we have taken 26 days data.
(7) Then we recorded the data as well and accumulated whole month data. Our data & analytical graphical representation are presented in data analysis section.
3. Data Analysis
Production per month of Basic T-shirt in 1 line Buyer name: H&M
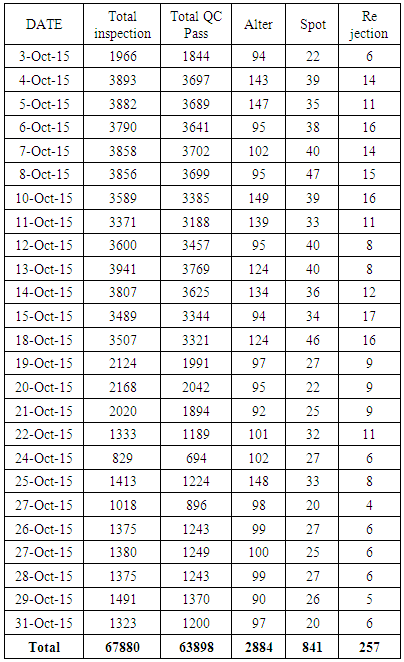
Style name: Roll up T-shirt .We have taken date from one line in one floor. During our experiment we assessed that workers’ skill more or less same. There are 26 worker including helper in a line. 8 over lock machine, 7 flat lock machines, 8 plain or lock stitch machine and 1 bar tuck machine in a line. (Table 1) Here, Number of production per month, number of QC passed, Number of alter, spot, rejection are given below by the table.Table 1. October month production
 |
| |
|
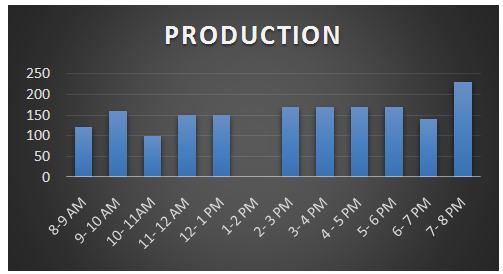 | Figure 1. Line wise production report per day |
3.1. Line Wise Production Report Per Hour
We see the line wise production per day data shows at graphical representation. The graphs indicate at (8-9am) production value 120, at (10-11 am) production value 100 and after lunch the production value increase (2-3pm) where the vale is 170, we see the higher production rate at the end of day (7-8pm) where the value is 230.So, in this line all the parameters are same except worker’s performance. During our experiment we assessed that workers’ skill more or less same.
3.2. Different Types of the Fault
Open seam, Down stitch, Raw edge, Up-down, Oil stain, Skip stitch, Broken stitch, Pleating, Dirty spot, Uncut thread.
3.3. Fault Wise Analysis
3.3.1. Open Seam
Portion of the garments that has not been covered by the sewing thread. Where the threads in the seam have ruptured leaving a hole in the stitch line. We see that the below graphs represents one month open seam faults report. And also mentioned the faults value per day in sewing line. After collected the data we observation how many times required to rework per faults. We calculated the data to rectify per month cost value for rework and yearly average losses value for per faults.Table 2. Open seam Fault per day in per month
 |
| |
|
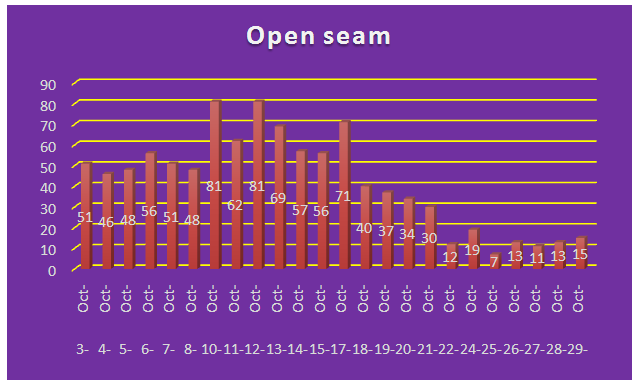 | Figure 2. Open seam fault per month |
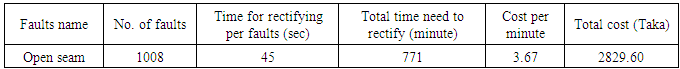
Table 3. Rectifying cost for open seam per month per line
 |
| |
|
Causes and remedies for open seamCauses× Improper stitch for application× Inadequate thread strength for seam and × not enough stitches per inch. Remedies× Using a better quality sewing thread× The proper size thread for the application× Knit fabrics, check for “stitch cracking” caused by not enough stitches per inch× Improper seam width or needle spacing for application, × Improper stitch balance and improper thread selection.
3.3.2. Skip Stitch
Where the stitch forming device misses the needle loop or the needle misses the looper loop a skipped or slipped stitch is formed. Skips are usually found where one seam crosses another seam and most of the time occurs right before or right after the heavy thickness. The below graphs show that one month skip stitch sewing faults. Whereas also mentioned specific value per day skip stitch faults in sewing line. After collected the data we calculated how much time required to rectify per faults and also analysis how much money losses in yearly to rectify.Table 4. Skip stitch Fault per day in per month
 |
| |
|
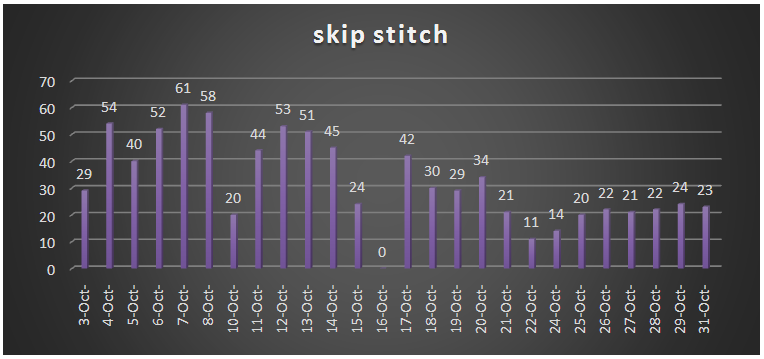 | Figure 3. Skip stitch fault per month |
Table 5. Rectifying cost for skip stitch per Month
 |
| |
|
Causes and remedies for Skip stitchCauses× The needle is threaded from the wrong side× Machine or bobbin tension is too high.× Failure of hook or looper and needle to enter loop at correct time.× Needle size and thread weight are mismatched.× Worn thread guides, paths or eyelets (burrs).Remedies× Check and re-thread if necessary. × Reset the needle, long groove faces the direction of threading. × Tighten presser foot screw. × Replace with new needle. × Use thread with left hand twist
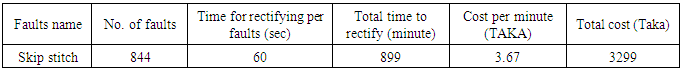
3.3.3. Down Stitch
When the needle loop could not have forwarded an equivalent direction line this time create down stitch. The below graphs represents the one month down stitch sewing faults. The graphs also show that individual faults value per day in a month. After collected data we calculated how many times required to rectify per faults and calculated how much losses per yearly for rework.Table 6. Down stitch fault per month
 |
| |
|
 | Figure 4. Down stitch fault per month |
Causes and remedies for down stitchCauses× Unsincerely work × Unadjustment of feed dog. Remedies× Should be work perfectly × Feed dog adjustment correctly. Table 7. Rectifying cost for down stitch per month
 |
| |
|
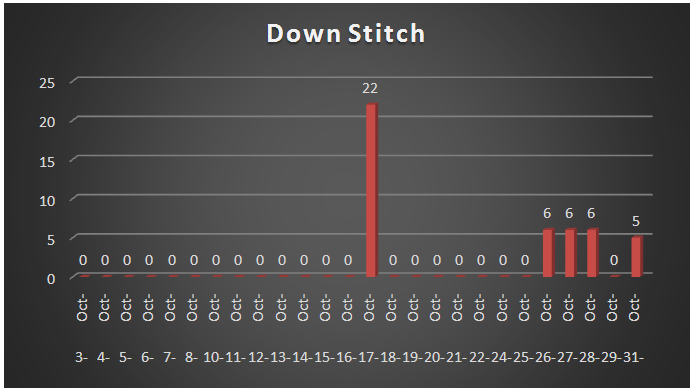
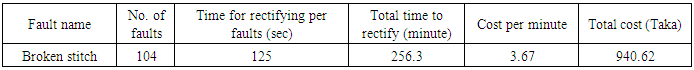
3.3.4. Broken Stitch
Broken stitch appear as equidistant prominent horizontal lines along the width of the fabric tube when a yarn breaks or is exhausted. We see that the below graphs shows one month broken stitch sewing faults in a line. The graphs mentioned individual faults value per day. After collected the data analyze how many times required to rectify the specific faults and also observation how much losses per yearly for this rework. Table 8. Broken stitch Fault per day in per month
 |
| |
|
 | Figure 5. Broken stitch faults per month |
Table 9. Rectifying cost for broken stitch per month
 |
| |
|
Causes and Remedies for broken stitchCauses× It appears due to improper trimming o machine usage.× Uncarefully thread cutting.
× Lower thread material Remedies× Proper machine usage.× Proper trimming.× Good quality thread used.
× Carefully cutting of needed thread.
× Where the thread is being cut, use a large diameter thread on operations.
3.3.5. Raw- edge
Where the edge of the seam is either extremely "ragged" or "rolls" inside the stitch. Below this graphs show that one month raw-edge sewing faults in a production line. The graphs also highlighted the specific dated faults value. After collected the data analysis what is causes and how to way remedies this faults. And also observation how many times required per individual faults and yearly losses value for rework.Table 10. Raw-edge Fault per day in per month
 |
| |
|
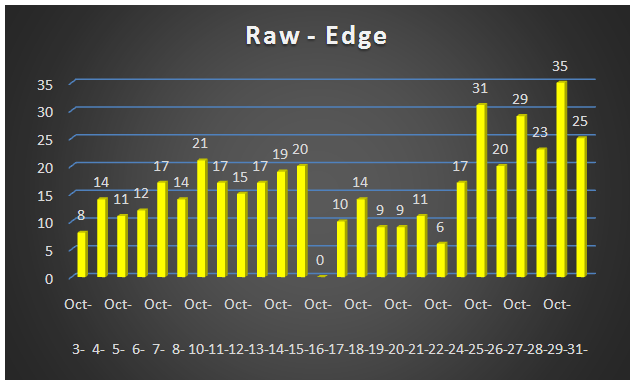 | Figure 6. Raw- edge faults per month |
Table 11. Rectifying cost for Raw edge per month
 |
| |
|
Causes and Remedies for broken stitchCauses× Not working the machine knife. × Fault of machine. × Uncarefully work. Remedies× Check the machine before sewing. × Machine knife check. × Carefully sewing
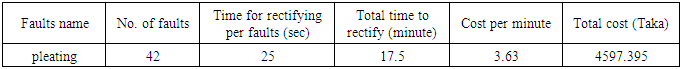
3.3.6. Pleating
The folded edge occurred during sewing. We see that below graphs show the one month pleating sewing faults in a line. And also indicate the specific faults value per day. After collected the data we observation how many times required for rectify the faults and how much money losses yearly to rework. Table 12. Pleating fault per day in per month with bar chart
 |
| |
|
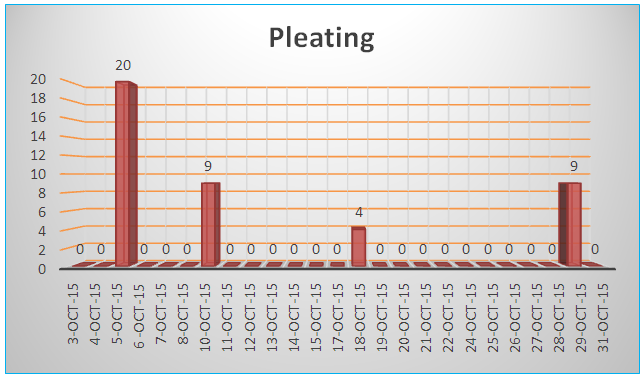 | Figure 7. Pleating faults per month |
Table 13. Rectifying cost for pleating per month
 |
| |
|
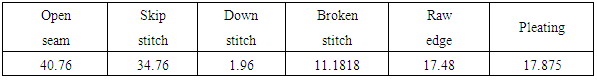
Causes and remedies for pleatingCauses× Work not carefully. × Fabric crease mark. Remedies× Carefully work. × Remove crease from fabric edge. This below table show that the average faults value per month. Where we see that the higher faults value open seam i.e whose value is 40.76 and the lowest value is down stitch faults i.e the value is 1.96, and also we see the raw-edge and pleating average rating value is similar. The second highest average faults value is skip stitch i,e the value is 34.76. Table 14. Average fault rating per day in 6 faults
 |
| |
|
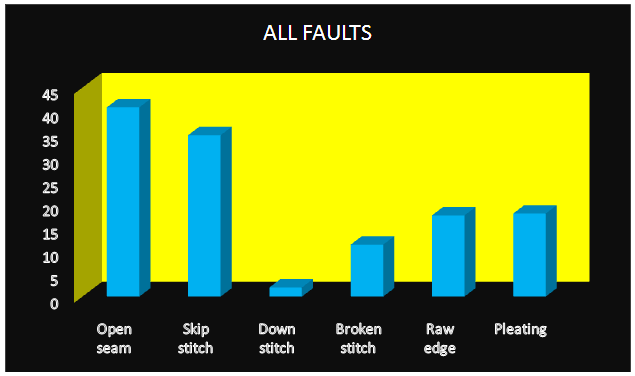 | Figure 8. All faults average rating |
Table 15. Fault of first day of our experiment
 |
| |
|
This is our first day experiment data. The graphs show that the higher faults skip stitch value 54, secondary faults is open seam value 51 and the broken stitch value 12 and also raw-edge value 8. We could not found any down stitch and broken stitch faults in our first day experiments. 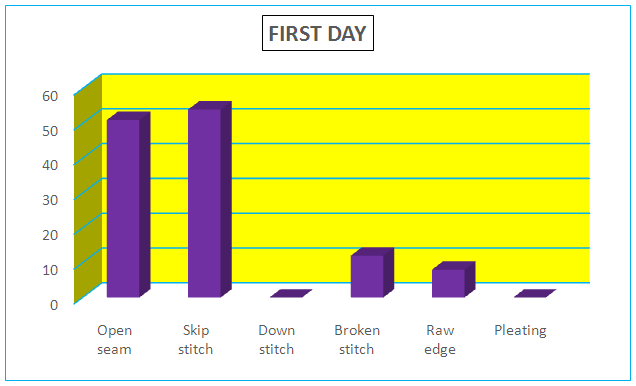 | Figure 9. Faults first day experiment data |
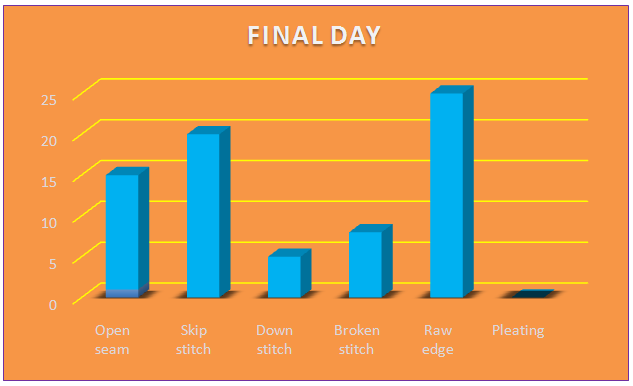
The below table are our last day experimental data. Where as we see that the too much improvement in average rating faults value reports. If we compare with our first day study its vary comparable results. The open seam faults show that the lowest vale than our first day experiment value and the skip stitch also more lowest value. The another faults down stitch, broken stitch, raw-edge and pleating sewing faults value also better improve. Table 16. Fault of final day of our experiment
 |
| |
|
 | Figure 10. Faults final day experiment data |
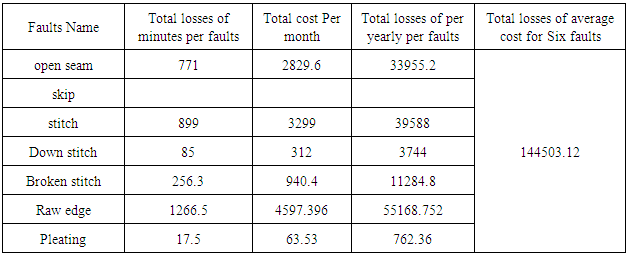
Table 17. Calculation of fault losses
 |
| |
|
We investigated that the total faults rating value is more improve then the first day experimental data. In this work we analysis how to make quality goods with less sewing faults. And also observation how to remedies of sewing faults and rework cost saving. The faults value decrease means ultimately production quality is increase. The minimizing of sewing fault in the sewing section of apparel industries by ensuring quality production. Sewing fault increases the cost of the product and also increase the wastes of time. Finally, we achieved our goals less sewing faults percentage with good quality products. The below table show that the total faults value and total time required for rework. And also mentioned the total cost per month per faults average cost and how much losses in yearly for rework.
4. Conclusions
The suggestive tools developed in this project cover a comprehensive series of aspects in minimizing sewing fault in the sewing section of apparel industries by ensuring quality production. The importance of the textile industry in the economy of Bangladesh is very high. The explosive growth of the RMG industry in the country, however, has not been enough supported by the growth of backward linkage facilities. So manufacturing the quality product is mandatory to sustain in this global competitive market. Quality is ultimately a question of customer satisfaction. Good Quality increases the value of a product or service, establishes brand name, and builds up good reputation for the garment exporter, which in turn results into consumer satisfaction, high sales and foreign exchange for the country. The perceived quality of a garment is the result of a number of aspects, which together help achieve the desired level of satisfaction for the customer. However, we should bear in mind that 1% defective product for an organization is 100% defective for the customer who buys that defective product. The project clearly indicates that by eliminating non-productive activities like uncut thread, open seam, skip stitch, oil stain, dirty spot, etc in the apparel industries time as well as cost is saved by ensuring quality production which have an important impact on overall factory economy.
ACKNOWLEDGEMENTS
We would like to thank to our gratitude to Prof. Syed Fakhrul Hassan, Dean, School of Science and Engineering, Southeast University. And we also like to give thanks especially to Md Jahangir Alam Deputy Manager, IE & planning department, Comfit composite knit ltd (Youth group, Bangladesh) for supervising and guidelines to Experimental work to complete our project. we wish to express our deepest sense of gratitude and sincere thanks to all the officials of administration, production department, maintenance department of Comfit composite knit Ltd. for permission to complete our project.
References
| [1] | Ujević, D., et al., Impact of sewing needle and thread on the technological process of sewing knitwear. Fibres & Textiles in Eastern Europe, 2008. 16(4): p. 69. |
| [2] | Catchpole, J., M. Sarhadi, and G. Stylios, Stitch quality monitoring in sewing operations. Textile Objective Measurement and Automation in Garment Manufacture, George Stylios, Ellis Harwood, New York, 1991: p. 229-250. |
| [3] | Kato, M., Multiple pattern sewing machine. 1981, Google Patents. |
| [4] | Bölümünde, B.K.F.K. and A. Uygulamasi, An Application of The FMEA Method to the Cutting Department of a Clothing Company. 2016. |
| [5] | Guyonnet-Benaize, C., et al., 3D structural modelling of small-deformations in poly-phase faults pattern. Application to the Mid-Cretaceous Durance uplift, Provence (SE France). Journal of Geodynamics, 2010. 50(2): p. 81-93. |
| [6] | Ashik, M., et al., Thesis report on Frequently Occurred Sewing Defects & Their Remedies. 2014. |
| [7] | Özeren, F. and İ. İlhan, A Statistical Process Control Application for Sewing Faults İn Men's Suit Production. Journal of Textile & Apparel/Tekstil ve Konfeksiyon, 2011. 21(4). |
| [8] | Park, C.K. and J.Y. Ha, A process for optimizing sewing conditions to minimize seam pucker using the Taguchi method. Textile research journal, 2005. 75(3): p. 245-252. |
| [9] | Bahadır, S.K., Assembly line balancing in garment production by simulation. Assembly Line–Theory and Practice, 2011. |
| [10] | Rahman, M.M. and M.M. Haque, Investigation of Fabric Wastages in Knit T-Shirt Manufacturing Industry in Bangladesh. |
| [11] | Carvalho, H., et al., Advancements in on-line monitoring and control of parameters in knitting and sewing processes. 2004. |
| [12] | Samuel Wesley, D. and V. Poojitha, A simple system for the online detection of skip/loop stitches in single needle lockstitch sewing machines. AUTEX Research Journal, 2010. 10: p. 69-72. |
| [13] | Harlock, S., D. Lloyd, and G. Stylios, Sensory Robotics: Identifying Sewing Problems, in Sensory robotics for the handling of limp materials. 1990, Springer. p. 85-96. |
| [14] | Mossoff, A., The rise and fall of the first American patent thicket: the sewing machine war of the 1850s. 2009. |
| [15] | Mridha, A.K., A. Sutradhar, and M. Khal, Investigation on causes and remedies of quality problems in knit garments production. 2016, Daffodil International University. |
| [16] | Brühl, L., E. Butzen, and K.-L. Manuel, Sewing machine with speed-dependent stitch correction. 2002, Google Patents. |
| [17] | Kerekes, L. and Z.C. Johanyák. Construction FMEA analysis of industrial sewing machines. in 2nd International Conference on Innovation, Techniques and Education in the Textile, Garment, Shoe and Leather Industry, Budapest. 1996. |
| [18] | Sadeh, Y., Y. Makover, and B.C. Mardix, Automatic sewing machine with scanning camera system. 1988, Google Patents. |
| [19] | Steedman, H. and K. Wagner, Productivity, machinery and skills: clothing manufacture in Britain and Germany. National Institute Economic Review, 1989. 128(1): p. 40-57. |

 Abstract
 Reference
 Full-Text PDF
 Full-text HTML