-
Paper Information
- Paper Submission
-
Journal Information
- About This Journal
- Editorial Board
- Current Issue
- Archive
- Author Guidelines
- Contact Us
American Journal of Chemistry
p-ISSN: 2165-8749 e-ISSN: 2165-8781
2024; 14(2): 13-26
doi:10.5923/j.chemistry.20241402.01
Received: Mar. 11, 2024; Accepted: Apr. 2, 2024; Published: Apr. 17, 2024

Synthesis, Spectroscopic Characterization, X-ray Structural Analysis and Theoretical Calculations of an Ester Derivative of the Coumarin Scaffold: (Coumarin-6-yl)-4-tert-Butylbenzoate
 Abstract
 Reference
 Full-Text PDF
 Full-text HTML
Honoré Kouadio Yao1, Koulabiga Zakaria2, Akoun Abou1, Abdoulaye Djandé2, Michel Giorgi3, Olivier Ouari4
1Department of Training and Research in Electrical and Electronic Engineering, Research Team: Instrumentation, Image and Spectroscopy, Felix Houphouet-Boigny National Polytechnic Institute, BP 1093 Yamoussoukro, Côte d’Ivoire
2Laboratory of Molecular Chemistry and Materials (LC2M), Research Team: Organic Chemistry and Phytochemistry, University Joseph KI-ZERBO, 03 BP 7021 Ouagadougou 03, Burkina Faso
3Spectropole, Federation of Chemical Sciences, Marseille FR1739 Campus St. Jérôme, 52 av. Escadrille Normandie-Niemen, 13013 Marseille, France
4Institut de Chimie Radicalaire, Equipe SREP, UMR 7273, Université Aix-Marseille, Avenue Escadrille Normandie-Niemen, Service 521, 13397 Marseille Cedex 20, France
Correspondence to: Akoun Abou, Department of Training and Research in Electrical and Electronic Engineering, Research Team: Instrumentation, Image and Spectroscopy, Felix Houphouet-Boigny National Polytechnic Institute, BP 1093 Yamoussoukro, Côte d’Ivoire.
| Email: |  |
Copyright © 2024 The Author(s). Published by Scientific & Academic Publishing.
This work is licensed under the Creative Commons Attribution International License (CC BY).
http://creativecommons.org/licenses/by/4.0/

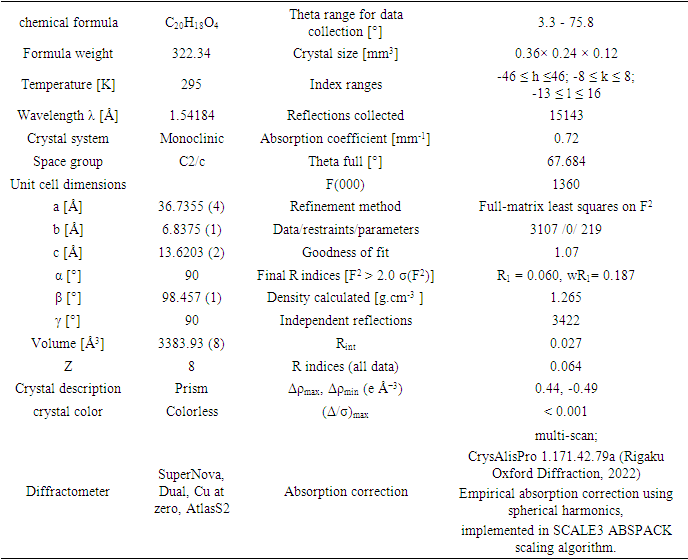
The title compound, C20H18O4 (I), was synthesized by O-acylation of 6-hydroxycoumarin with 4-tert-butylbenzoyl chloride. The compound was characterized with ESI-MS, FT-IR, 1H and 13C NMR spectroscopic analysis. Furthermore the single crystal X-ray structure obtained has C2/c space group and crystallizes in the monoclinic system with dimensions of 𝑎 = 36.7355 (4) Å, 𝑏 = 6.8375 (1) Å, and 𝑐 = 13.6203 (2) Å. In the structure, the planar coumarin ring system and the benzene ring of the benzoate group are almost perpendicular, forming a dihedral angle of 87.22 (8)°. These moieties are linked by the exocyclic ester (-COO-) fragment making a torsion angle of 66.0°. The molecules are associated via C—H···O interactions to form R22(24) dimers which arrange the coumarin moiety into layers nearly parallel to the (20
 ) plane. Likewise, the crystal structure is supported by C–H···π and π–π interactions between neighboring rings with centroid–centroid distances less than 3.8
 Å. Also, the DFT method was used to minimize the title compound and assess its HOMO and LUMO electron density plots, as well as its molecular electrostatic potentials. Additionally, the HOMO-LUMO energy gap and non-linear optical (NLO) effects were calculated to better understand the molecule's properties. These calculations yield dipole moment, HOMO–LUMO energy gap, polarizability and first-order hyperpolarizability values of 7.71 D, 4.45 eV, 39.2x10⁻²⁴ and 5.37x10⁻³⁰ esu, respectively and are compared with those of the urea molecule for the assessment of NLO properties, as well as with the related coumarin derivative 2-oxo-2H-chromen-6-yl-4-methoxybenzoate (II).
Keywords: 6-Substituted coumarin derivative, Spectroscopic analysis, Conformational analysis, Quantum chemical calculations
Cite this paper: Honoré Kouadio Yao, Koulabiga Zakaria, Akoun Abou, Abdoulaye Djandé, Michel Giorgi, Olivier Ouari, Synthesis, Spectroscopic Characterization, X-ray Structural Analysis and Theoretical Calculations of an Ester Derivative of the Coumarin Scaffold: (Coumarin-6-yl)-4-tert-Butylbenzoate, American Journal of Chemistry, Vol. 14 No. 2, 2024, pp. 13-26. doi: 10.5923/j.chemistry.20241402.01.
Article Outline
1. Introduction
- Coumarin derivatives are one of the important classes of naturally occurring compounds and interest in their chemistry continues because of their usefulness as biologically active agents. The synthesis of coumarin (2-oxo-2H-chromene) derivatives has attracted considerable attention of organic and medicinal chemists as these are widely used as fragrances, pharmaceuticals and agrochemicals. They are essential components of many pharmaceutical molecules, including anti-bacterial [1], antioxidant [2], and anti-inflammatory agents [3]. They are also utilized in the perfumery and agrochemical industries as activators and stabilizers [4,5]. Likewise, coumarin derivatives are used in the development of fields such as optical communications, optical computing, dynamic imaging and data storage combined with other desirable properties such as photoswitching. Considerable research into the discovery of new materials with more efficient nonlinear optical (NLO) properties has been carried out experimentally or guided by theoretical calculations to synthesizing more effective photon-manipulating materials [6-10]. Among these materials, we can find organic molecules constructed by a donor-acceptor pair linked to a
 -delocalized backbone such as coumarin which display attractive NLO properties. These properties can be assessed from their hyperpolarizabilities [6,10,11]. For instance, the first hyperpolarizability provides information about the material's ability to generate second-order nonlinear effects, such as second harmonic generation, sum frequency, and parametric amplification and others [11]. The quantum chemical methods generally used for these theoretical calculations of molecular hyperpolarizabilities values are Hartree-Fock and density functional theories [12-13].Having in mind the wide variety of their usage and as a continuation of our investigations on hydroxycoumarins acylation products and theoretical calculations [14-15], we report here the synthesis, characterization, crystal structure, geometry optimization, molecular orbital calculations of (coumarin-6-yl)-4-tert-butylbenzoate and the resulting results are compared to those of the related coumarin derivative, the 2-oxo-2H- chromen-6-yl 4-methoxybenzoate (II) [16].
2. Experimental and Theoretical Methods
2.1. Synthesis
- The following reaction describes an O-acylation of 6-hydroxycoumarin with 4-tert-butylbenzoyl chloride in the presence of tetrahydrofuran as a solvent and triethylamine as a base.
 | Figure 1. General reaction scheme for the preparation of the title compound |
 g, 6.17
 mmol) in dried tetrahydrofuran (30
 mL) was added dried triethylamine (2.6
 mL, 18.51mmol) and the substrate 6-hydroxycoumarin (1g, 6.17
 mmol) by small portions over 30
 min. The mixture was then refluxed for 4
 h and poured into 40
 mL of chloroform. The solution was acidified with diluted hydrochloric acid 5% until the pH was 2–3. The organic layer was extracted, washed four times with 25 ml of water to neutrality, dried over MgSO4 and the solvent removed. The resulting crude product was filtered off with suction, washed with n-hexane and recrystallized from acetone as colorless crystals of the title compound (I). Yield: 91%. The melting point was measured in open capillaries with a STUART SMP 11 apparatus and is thus uncorrected: m.p. 421–422
 K.
K. 2.2. Electrospray Ionization Mass Spectrum
- The analyses were carried out with a 3200 QTRAP spectrometer (Applied Biosystems SCIEX) equipped with a pneumatically assisted air pressure ionization (API) source for ESI-MS+ experiment. The sample in solution was ionized in the following conditions: electrospray tension (ISV): 5500 V; orifice tension (OR): 20 V; nebulizing gas pressure (air): 10 psi. The mass spectra (Figure 2 and 3) were obtained with a quadrupole analyzer.
2.3. ATR-FTIR Spectrum
- The Infrared spectrum (Figure 4) was recorded on a Bruker IFS 66/S Fourier Transform Infrared (FTIR) spectrometer, driven by the OPUS 6.5 software and using the ATR (Attenuated Total Reflectance) technique with Germanium tip. The absorption bands in the range 4000-400 are expressed in wavenumber ῡ (cm-1): resolution 1 cm-1, 300 scans.
2.4. NMR Spectra
- 1H and 13C-NMR spectra (Figures 5 and 6) were recorded on a Bruker AMX-400 spectrometer at 300 and 100 MHz respectively, using TMS as internal standard (chemical shifts in δ ppm, coupling constants J in Hz) and deuterated chloroform (CDCl3) as a solvent.The 13C spectrum was obtained from an experience APT (Attached Proton Test).
2.5. Crystal Structure Analysis
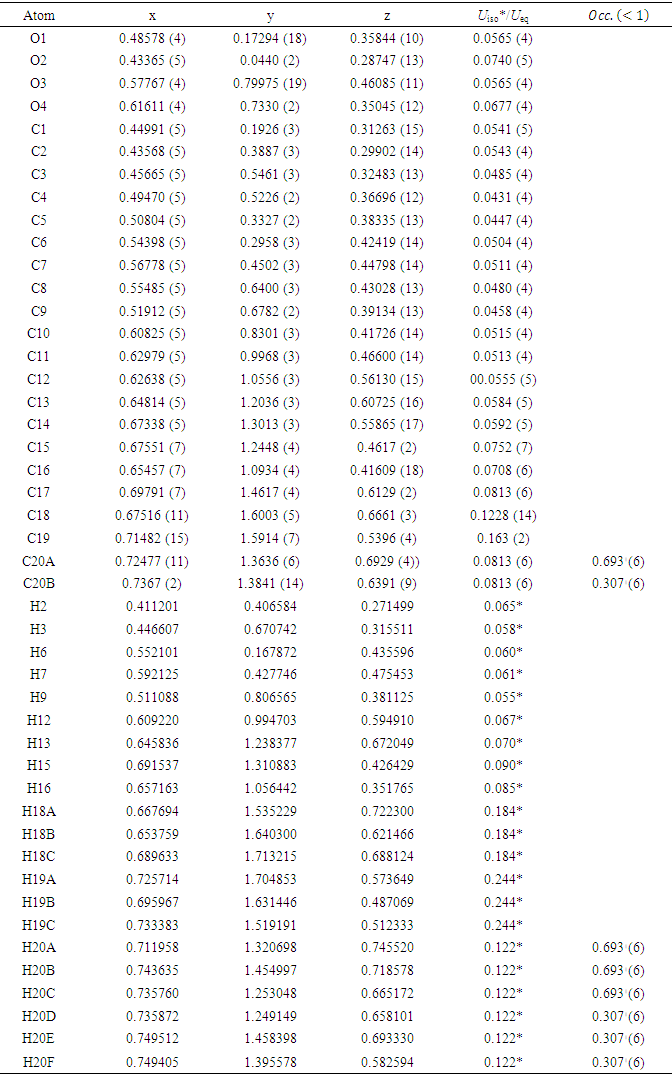
- Diffraction intensities of the title compound were measured utilizing a mirror monochromator and Cu Kα radiation (λ = 1.54184 Å) at 295 K on a Rigaku Oxford Diffraction SuperNova Dual, Cu to zero, AtlasS2 diffractometer [17]. The structure was determined by direct methods using SIR 2014 [18] and implemented in the WinGX programs [19]. The positional and anisotropic temperature parameters of the heavy atoms, which correspond to 201 crystallographic parameters, were refined utilizing the SHELXL2014 program [20] via a full matrix least squares method.All hydrogen atoms were fixed geometrically using HFIX geometric constraints [C-H = 0.93 (aromatic) and C-H = 0.96Å (methyl group)] and refined using a riding model with Uiso(H) = 1.2Ueq(C-aromatic) or 1.5Ueq(C-methyl).The title compound crystallized with disorder in one carbon atom of the tert-butyl group. Hence this carbon atom C20 was split over two positions (C20A and C20B) with site occupancies of 0.693
 (6) and 0.307
 (6), (Table 4). EADP commands in SHELXL were used for the Uij values of equivalent atom pairs of the tert-butyl group.
2.6. Computational Procedures
- The geometry optimization and some properties such as HOMO–LUMO energy gap, the molecular electrostatic potentials (MEP), the polarizability and the first-order hyperpolarizability of (I) was performed with Opt+Freq method using density functional theory (DFT) combine with restricted exchange correlation functional (RB3LYP) utilizing the 6-311++G(d,p) basis set in ground state. All the theoretical calculations were carried out with GAUSSIAN09 program package [21] using the crystal structure in the solid state as the starting geometry. The results are compared to the related structure, the 2-oxo-2H-Chromen-6-yl 4-methoxybenzoate, compound (II), (Figure 8.b) [16].
3. Results and Discussion
3.1. Spectra Analysis
3.1.1. Interpretation of Electrospray Ionization Mass Spectrum
- The mass spectrum (Figure 2) displayed two peaks detected at m/z 323 and 340 due respectively to the pseudo-molecular ion [M+H]+ and the ammonium adduct [M+NH4]+, which confirm the molecular weight of 322 g.mol-1, in accordance with the chemical formula C20H18O4.ESI-MS m/z 323 ([M+H]+); 340 ([M+NH4]+).ESI-MS/MS m/z (%): 323 (MH+, 81), 161.2 (100), 146.3 (3.17), 105.3 (1.06). (Figure 3)
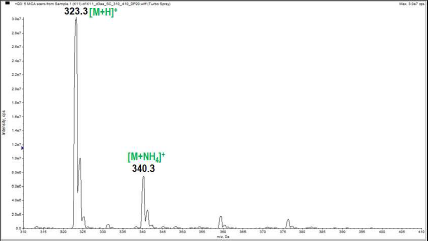 | Figure 2. Electrospray ionization mass spectrum of the studied sample |
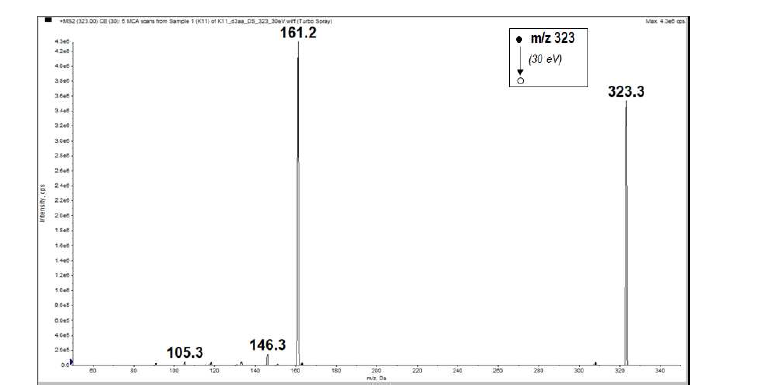 | Figure 3. MS/MS spectrum of the protonated molecular ion peak (MH+) at m/z 323 |
3.1.2. Infrared Spectrum
- For the studied compound, the FTIR spectrum showed absorption bands at 3203.4 cm-1 (C-H, aromatic), 2966.1 cm-1 (C-H, aliphatic), 1754.2 cm-1 and 1728.8 cm-1 for the two carbonyls, 1254.2 cm−1 (C−O−C, lactone), and 1084.7 cm-1 (C−O−C, ester). C=C signals were in the range of 1542.4 cm−1 to 1677.9 cm−1, (Figure 4).
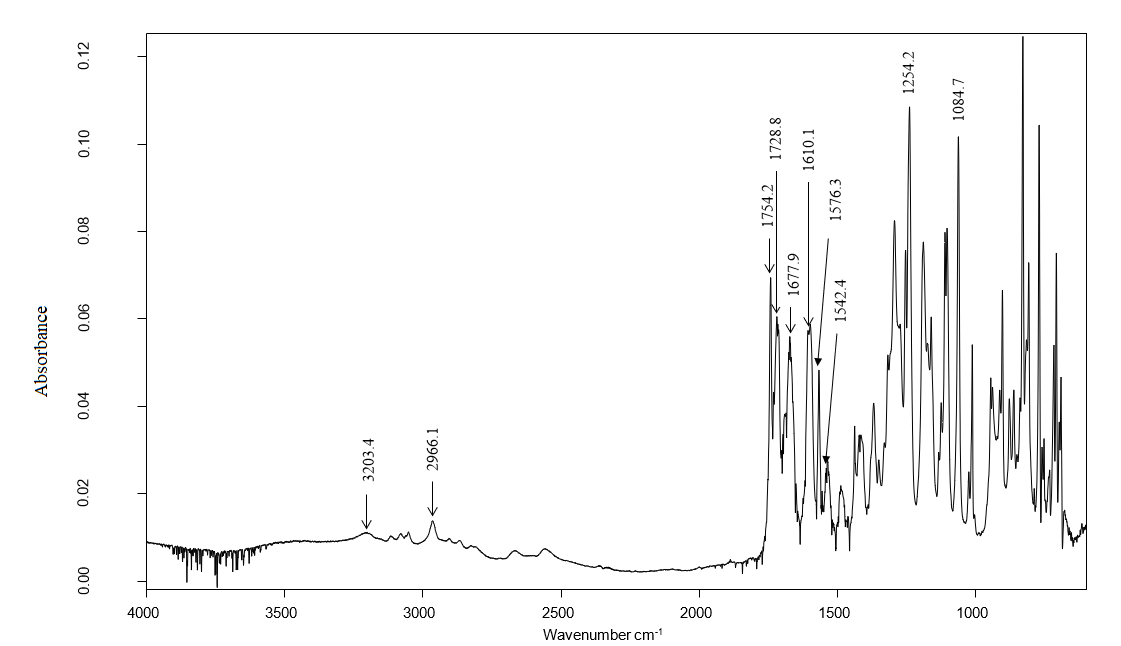 | Figure 4. Experimental ATR-FTIR Spectrum |
3.1.3. 1H-NMR Spectrum
- The analysis (chemical shifts and coupling constants) of the 1H NMR spectrum (Figure 5) revealed six signals with five in the range 6-8.5 ppm due to aromatic hydrogens, the nine equivalent methyl protons appeared unambiguously at 1.3 ppm.1H-NMR (CDCl3, 300 MHz, δ ppm): 1.3 (s, 9H, 3CH3); 6.5 (d, 1H, J = 9.6 Hz, H-3); 7.3 (m, 3H, H-5, H-7 and H-8); 7.6 (d, 2H, H-14 and H-16); 7.7 (d, 1H, J = 9.6 Hz, H-4); 8.2 (d, 2H, H-13 and H-17).
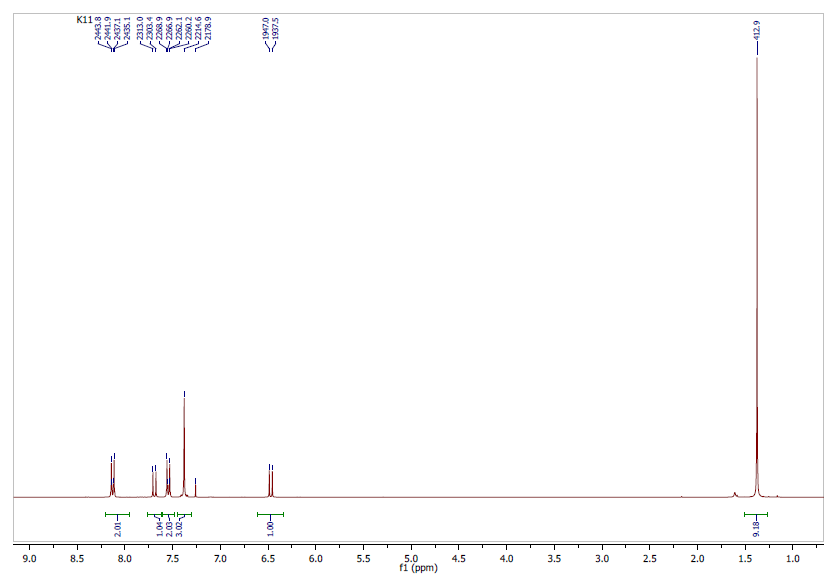 | Figure 5. Experimental 1H-NMR Spectrum: CDCl3, 300 MHz |
3.1.4. 13C (APT)-NMR Spectrum
- 13C (APT)-NMR sequence provides information on attached protons: CH3 and CH signals are positive while CH2 and quaternary carbons signals are negative.The spectrum of the molecule consisted of 16 signals as expected (Figure 6). Eight positive peaks were observed suggesting the nine aromatic tertiary carbons and the shielded primary carbons of methyl groups, whereas eight peaks were inverted, indicating quaternary carbons (C-2, C-6, C-9, C- 10, C-11, C-12, C-15 and C-18).13C (APT)-NMR (CDCl3, 100 MHz, δ ppm): 31.2 (3CH3), 35.4 (C-18), 117.6 (C-3), 118.1 (C-5), 119.4 (C-12), 120.5 (C-7), 125.7 (C-8), 125.9 (C-14 and C-16), 126.2 (C-10), 130.3 (C-13 and C-17), 142.9 (C-4), 147.2 (C-9), 151.7 (C-6), 158.1 (C-15), 160.6 (C-2), 165.2 (C-11).
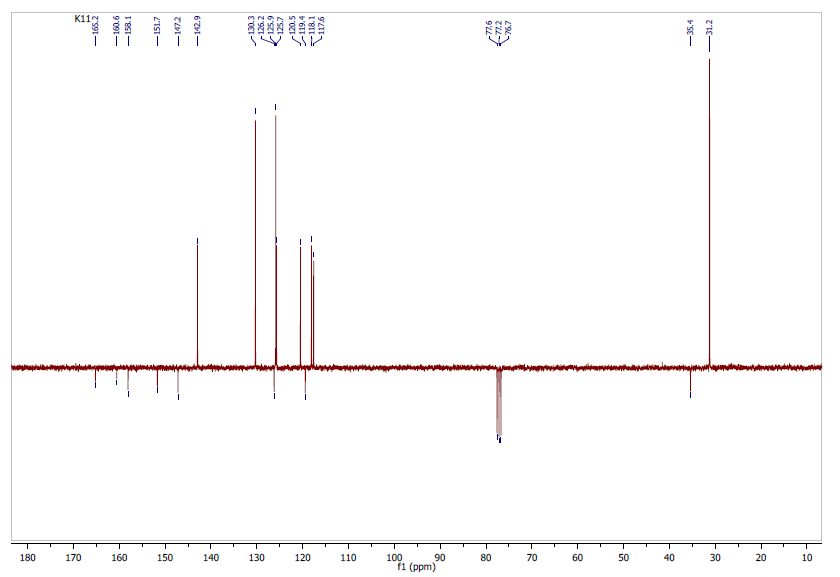 | Figure 6. Experimental 13C (APT)-NMR Spectrum: CDCl3, 100 MHz |
3.1.5. Heteronuclear Single-Quantum Correlation (HSQC) NMR Spectrum
- As expected, eight spots were observed in the 2D HSQC-NMR spectrum (Figure 7) providing correlations between the primary carbons and the protons of methyl groups as well as between tertiary carbons (C-3, C-4, C-5, C-7, C-8, C-14 and C-16, C-13 and C-17) and their directly attached proton via the 1JC-H scalar coupling.
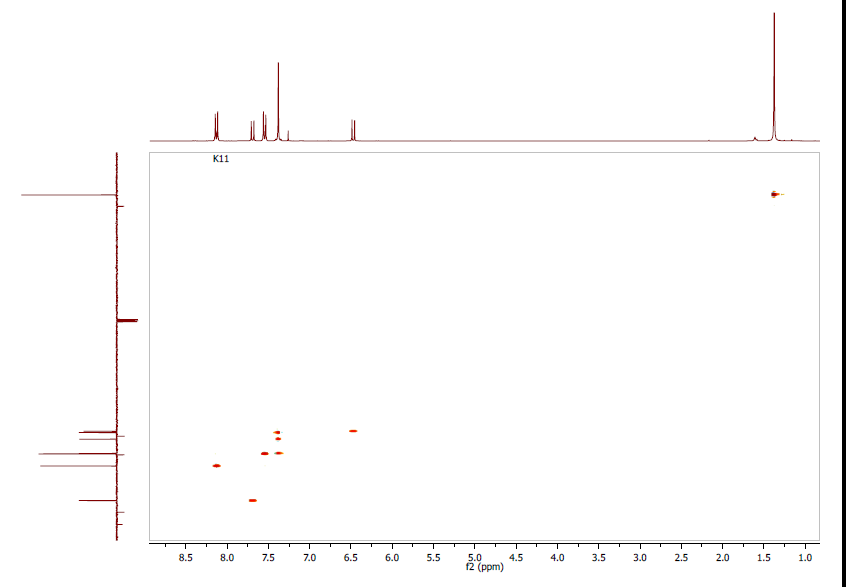 | Figure 7. Experimental HSQC Spectrum: CDCl3, 1H-NMR 300 MHz; 3C (APT)-NMR 100 MHz |
3.1.6. Conclusion of Spectra Analysis
- The overlaying of the spectroscopic outcomes originating from the spectral analysis validates the depicted coumarin molecule in Figure 1.
3.2. Structural Description
3.2.1. Structural Commentary
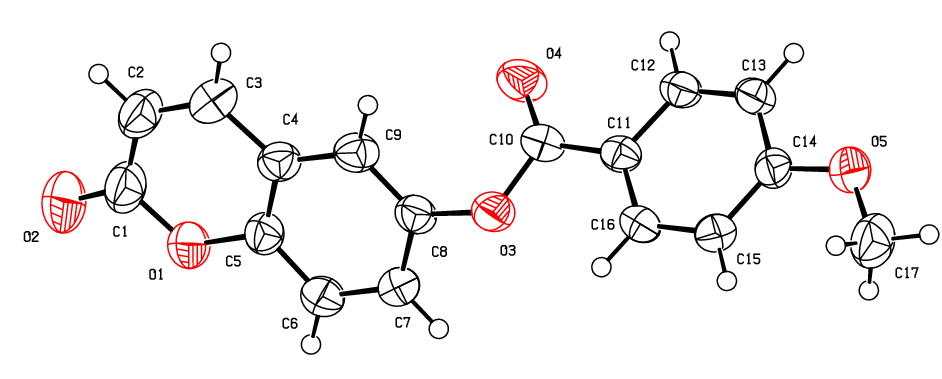
- The structure of the coumarin derivative (I) is illustrated in Figure 8.a. In the structure, a methyl group of the tert-butyl substituent exhibits a rotational disorder. This group is split over two positions, with refined site-occupation factors of 0.693
 (6) and 0.307
 (6), Table 4. The planar chromene ring system and the benzene ring of the benzoate group are nearly perpendicular (dihedral angle of 87.22
 (8)°). These perpendicular moeties are connected by the exocyclic (-COO-) moiety. An inspection of the bond lengths shows that there is a slight asymmetry of the electronic distribution around the pyrone ring: the C2—C3 [1.340 (3)
 Å] and C1—C2 [1.441 (1)
 Å] bond lengths are shorter and longer, respectively, than those expected for a Car—Car bond. This shows that the electron density is weaker in the C2-C3 bond of the pyran-2-one ring, leading to the formation of the double bond, as noticed in other coumarin ester derivatives [22-23].
|
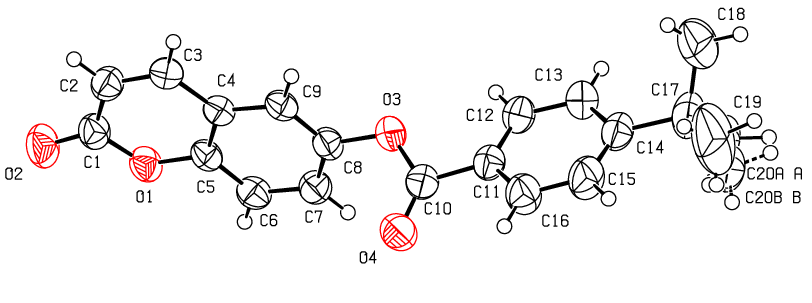 | Figure 8.a. An ORTEP view of the title compound (I) with the atomic numbering scheme. Displacement ellipsoids are shown at the 50% probability level |
 | Figure 8.b. An ORTEP view of compound (II) with the atomic numbering scheme for the sake of structural parameters comparison between (I) and (II) |
3.2.2. Supramolecular Features
- In the crystal, molecules form R22(24) dimeric units via C—H···O interactions that organize the coumarin moiety into layers almost parallel to the (hkl) plane (20
 ) with the 4-(tert-butyl)benzoate-benzene moiety nearly perpendicular to this plane (figure 9). These dimers are connected to each other by close intermolecular contacts with distances shorter than the sum of the van der Waals radii [C6···C2 (-x,y,-1/2-z) = 3.297 (3)Å, C1···C6 (-x,y,-1/2-z) = 3.342 (3)
 Å and C4···C4 (-x,y,-1/2-z) = 3.266 (3)Å (figure 9). In addition, C–H···π and π–π stacking interactions between neighbouring coumarin and pyrone or benzene rings with centroid–centroid or H–centroid distances less than 3.8
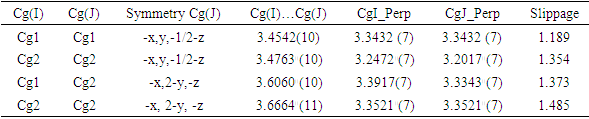
 Å, the maximum regarded as suitable for an effective C–H···π or π–π interaction [24], are also present and linked the dimers (fig.9), (Tables 2 and 3). All of the molecular interactions contribute to the stable assembly of the 3D crystals. The perpendicular distances of Cg(I) on ring J and distances between Cg(I) and perpendicular projection of Cg(J) on ring I (slippage) are summarized in Table 3.
|
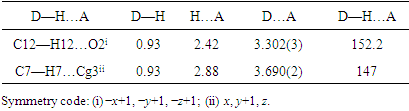
 | Figure 9. A view of the crystal packing, showing C—H···O hydrogen bonds, C—H···π and π···π stacking interactions connecting molecules into R22(24) dimeric units |
|
3.3. Theoretical Calculations
3.3.1. Comparison of Geometrical Parameters
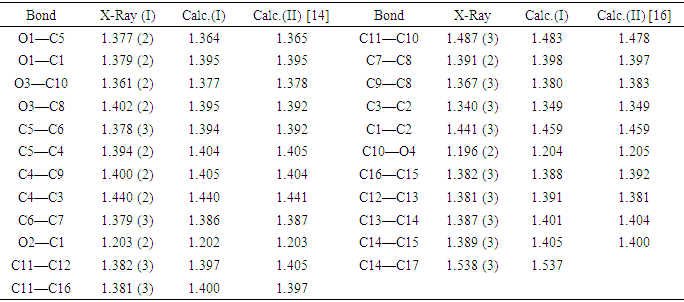
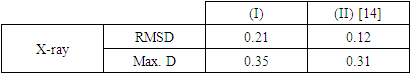
- In this work, we compared crystallographic (XRD) and computed structures using three methods. The first two methods are employed to compare geometric parameters, while the third is reserved for Atom-by-atom superimposition of the X-ray structure of (I) on the calculated structure of both structures (I and II, [16]).The geometrical parameters of (I) and (II) originating from the quantum computations are compared with those obtained from the X-ray crystallographic study in this first approach. An analysis of the calculated bond lengths and bond angles of (I) and comparison with the crystallographic results highlights a good agreement between them, with a root-mean-square deviation (RMSD) of 0.011
 Å for bond lengths and 0.7° for bond angles. The latter value is obtained by excluding bond angles involving carbon atoms in the tert-butyl group, one of which is disordered (Tables 5 and 6). Also, the inspection of the calculated torsion angles in (I) shows that the benzene ring in the 4-tert-butylbenzoate moiety and the coumarin ring system are flat, which agrees with the crystallographic foresight. although the observed O3—C10—C11—C12 and O4—C10—C11—C16 torsion angles between the benzene ring of the benzoate group and the exocyclic ester side-chain (22.3 (2)°) and (21.6 (2)°), respectively are somewhat larger than the calculated values (1.82°) and (-1.41°) respectively (Table 7). This feature is often observed in 7-substituted coumarin esters. Likewise, an examination of the calculated structure of the related compound namely 2-oxo-2H-chromen-6-yl 4-methoxybenzoate (II) in which the 6-substituted fragment i.e 4-methoxybenzoate is also consistent with the crystallographic structure of (I). Indeed, the RMSD used here as an indicator of the accuracy of the prediction errors gives a low value close to zero, i.e. 0.012, indicating a perfect fit to the data.
|
|

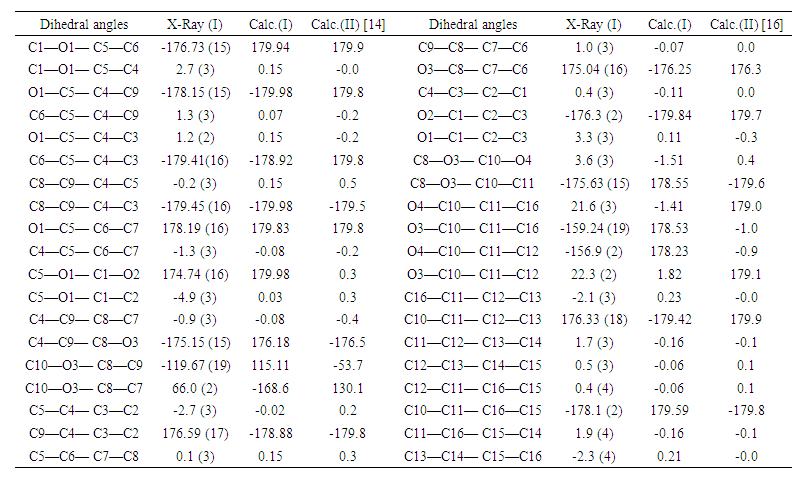 | Table 7. Experimental and DFT/ RB3LYP/6-311++G(d,p) calculated dihedral angles (°) for compounds (I) and (II) |
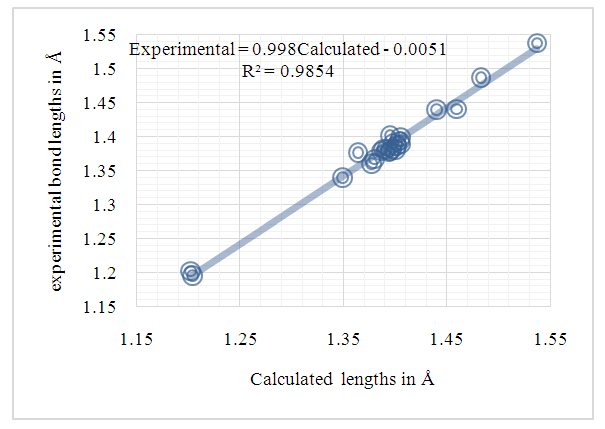 | Figure 10. Correlation plot between the experimental and the theoretical bond lengths from (I) (Å) |
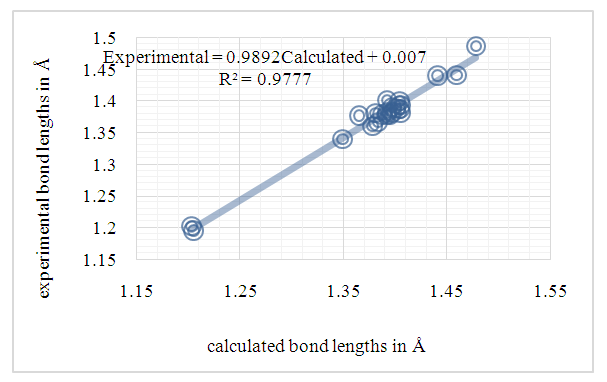 | Figure 11. Correlation plot between the experimental bond lengths from (I) and theoretical bond lengths from (II) [16] in (Å) |
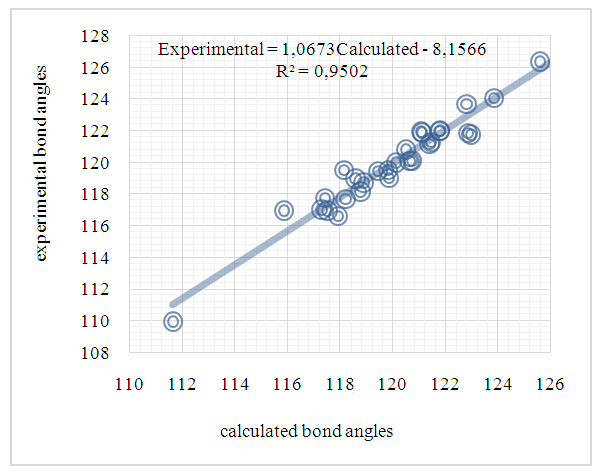 | Figure 12. Correlation plot between the experimental and theoretical bond angles frm (I) in (°) |
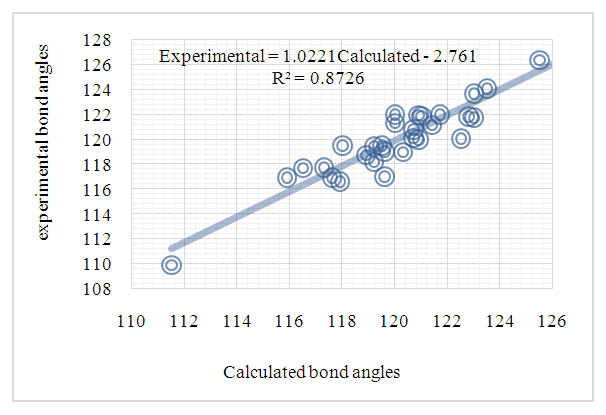 | Figure 13. Correlation plot between the experimental bond angles from (I) and theoretical bond angles from (II) [16] in (°) |
|
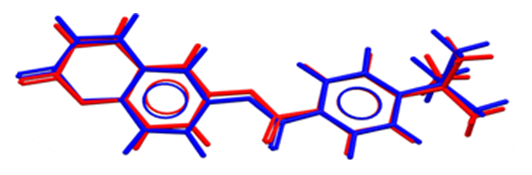 | Figure 14. Atom-by-atom superimposition of the X-ray structure (res) on the calculated structure of (I), blue, by (DFT/ B3LYP/6-311++G(d,p) |
 | Figure 15. Atom-by-atom superimposition of the X-ray structure (red) on the calculated structure of (II), green, by (DFT/ B3LYP/6-311++G(d,p) |
3.3.2. Molecular Electrostatic Potential (MEP)
- The molecular electrostatic potential (MEP) at a given point P(x,y,z) near a molecule is the force that acts on a positive test charge placed at P through the cloud of electric charge generated at through electrons and nuclei of molecules. Despite the fact that the repartition of the molecular charge remains unchanged thanks to the external test charge (no polarization occurs), the electrostatic potential of a molecule remains a good guide to assess the reactivity of molecules towards positively or negatively charged reactants. So, in this work, MEP is used to illustrate the electronic and nuclear charge distribution which is an appropriate feature for understanding the reactivity of various species [26]. For convenience, the potential, V(r), is written in terms of atomic units (a.u) as the following form [27]:
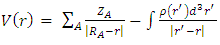 | (1) |
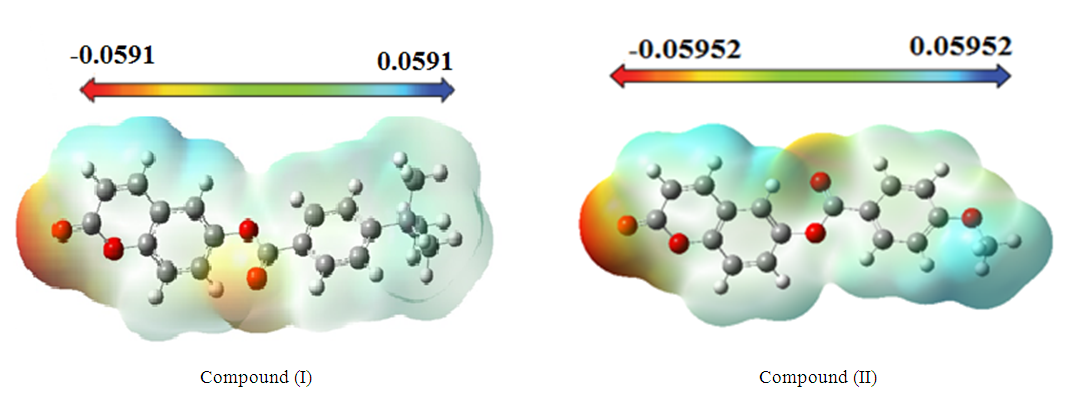 | Figure 16. MEP map (in atomic units) calculated using DFT/RB3LYP/6-311++G(d,p) |
3.3.3. HOMO-LUMO Analysis
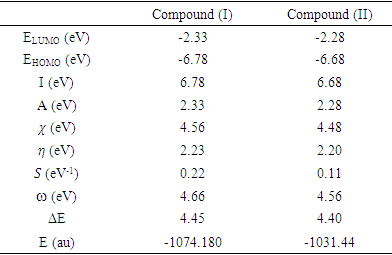
- The highest occupied molecular orbital (HOMO) and that of the lowest unoccupied molecular orbital (LUMO) were calculated for the title compound (I) with DFT/RB3LYP/6-311++G(d,p) and the outcomes are depicted in Figure 17. This figure shows that HOMO and LUMO are localized in the plane extending from the coumarin-6-yl moiety linked to the exocyclic ester group (HOMO) to the coumarin-6-yl moiety (LUMO). The calculations also reveal that (I) has 85 occupied molecular orbitals and the value of the energy separation between LUMO and HOMO is 4.45
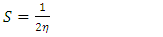
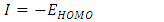
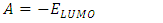
 eV. This large boundary orbital gap and the relative parameters (Table 9) show that (coumarin-6-yl)-4-tert-butylbenzoate is more stable and less chemical reactive and is also called hard molecule [28]. This assertion is corroborated by the absence of negative frequencies in frequency calculation performed by Gaussian. Analysis of the energy gap between the two molecules shows that they are both chemically stable. However, the compound (I) with the higher energy gap is the more chemically stable. Similarly, the highest electrophilicity index value for compound (I) also confirms its greater stability, as this parameter measures energy stabilization when the system acquires additional electronic charge from the environment. Expressions for stability characterization parameters such as energy gap (ΔE), ionization potential (I), electron affinity (A), absolute electronegativity (χ), absolute hardness (η), softness (S), electrophilicity index (ω), shown in Table 9, are defined as follows [29].
 | (2) |
 | (3) |
 | (4) |
 | (5) |
 | (6) |
 | (7) |
 | (8) |
 | (9) |
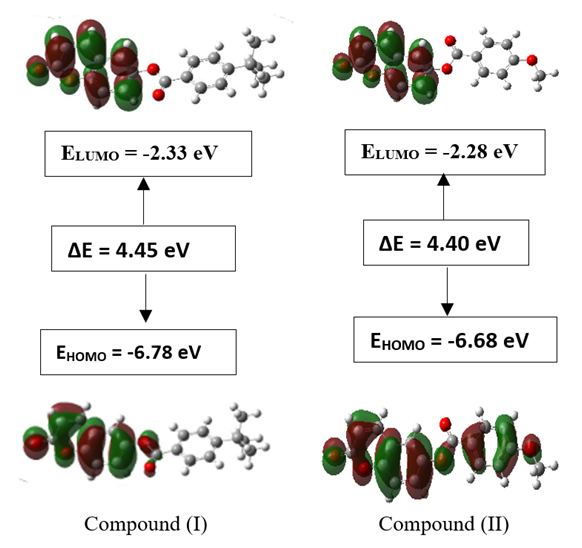 | Figure 17. Calculated HOMO and LUMO orbital distributions and energy levels for the molecule (I) |
|
3.3.4. Nonlinear Optical Properties
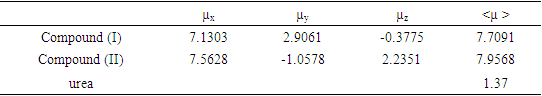
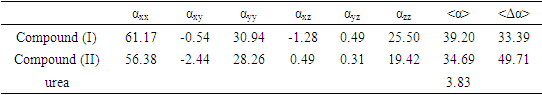
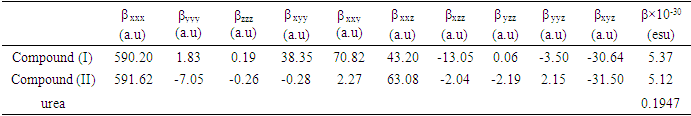
- Nonlinear optical (NLO) effects result from the interactions of electromagnetic fields in various media for produce new fields altered in phase, frequency, amplitude or other characteristics of propagation from incident fields [30]. In recent years, due to the potential applications in modern communication technology, data storage, communication and optical signal processing, a large number of research articles on new materials presenting the effective nonlinear optical properties (NLO) have been of great interest [31-35]. Thus, the use of quantum chemistry methods such as Hartree-Fock (HF) and density functional theory (DFT) for molecular hyperpolarizabilities are currently expected to guide and accelerate the upcoming experimental studies [12,13].Therefore, in this work, we have used GAUSSIAN-09W to compute the dipole moments (µ), the polarizabilities (<α>), the anisotropy of polarizabilities (<Δα>) and the first-order hyperpolarizabilities (β) which gives information about the ability of the material to generate second-order nonlinear effects [36]. These parameters are defined as follow [37-38]:
 | (10) |
 | (11) |
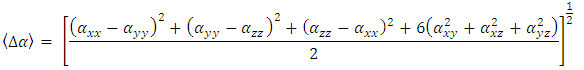 | (12) |
 | (13) |
|
|
|
4. Conclusions
- In this work the molecular structure of the title compound (I) was determined via spectroscopic methods and X-ray crystallography. Intermolecular interactions were also analyzed through the Multipurpose Crystallographic Tool Platon [43].Also, molecular electrostatic potential, HOMO-LUMO analysis and nonlinear optical properties of (coumarin-6-yl)-4-tert-butylbenzoate were investigated using DFT/RB3LYP/6-311++G(d,p) calculations. The computed geometric parameters, including bond lengths, bond angles, torsion angles were compared to the corresponding experimental data. The comparison reveals no significant differences between the experimental and theoretical structures, except for the experimental torsion angle, O3—C10—C11—C12 and O4—C10—C11—C16 which differs from the calculated value. The MEP maps indicate that negative potential sites reside on electronegative atoms, and positive potential sites are found around the hydrogen atoms. This information reveals the areas where intra- and intermolecular interactions can occur. Additionally, the estimated first-order hyperpolarizability value which provides information on the material's ability to generate second-order non-linear effects, suggests that both molecules ((I) and (II)) possess non-linear optical properties.
ACKNOWLEDGEMENTS
- The authors thank the Spectropole Service of the Federation of Chemical Sciences (Aix-Marseille University, France) for conducting the complete analysis.
References
| [1] | Basanagouda M, Kulkarni M V, Sharma D, Gupta V K, Pranesha P, Sandhyarani P and Rasal V P, J. Chem. Sci. (2009); 121: 485–495. |
| [2] | Vuković N, Sukdolak S, Solujić S and Niciforović N, Arch. Pharm. Res. (2010); 33: 5–15. |
| [3] | Emmanuel-Giota A A, Fylaktakidou K C, Litinas K E, Nicolaides D N and Hadjipavlou-Litina D J, Heterocycl. Chem. (2001); 38: 717–722. |
| [4] | Bauer, K., Garbe, D. & Surburg, H. (1988). Flavors and fragrances. In: Gerhartz, W., Yamamoto, Y. S., Elvers, B., Rounsaville, J. F. & Schulz, G., eds, Ullmann's Encyclopedia of Industrial Chemistry, 5th rev. Ed., Vol. A11, New York, VCH Publishers, pp. 208–209. |
| [5] | Boisde, P. M. & Meuly, W. C. (1993). Coumarin. In: Kroschwitz, J. I. & Howe-Grant, M., eds, Kirk-Othmer Encyclopedia of Chemical Technology, 4th Ed., Vol. 7, New York, John Wiley, pp. 647–658. |
| [6] | D.R. Kanis, M.A. Ratner, T.J. Marks, Chem. Rev. 94 (1994) 195–242. |
| [7] | D.J. Williams, Thin Solid Films 216 (1992) 117–122. |
| [8] | P.J. Mendes, J.P. Prates Ramalho, A.J.E. Candeias, M.P. Robalo, M.H. Garcia, J. Mol. Struct. (Theochem.) 729 (2005) 109–113. |
| [9] | N.M.F.S.A. Cerqueira, A.M.F. Oliveira-Campos, P.J. Coelho, L.H. Melo de Carvalho, A. Samat, R. Guglielmetti, Helv. Chim. Acta 85 (2005) 442–450. |
| [10] | (a) S.P.G. Costa, J. Griffiths, G. Kirsch, A.M.F. Oliveira-Campos, Ann. Quım. Int. ´ Ed. 94 (1998) 186–188; (b) V.A. Barachevsky, A.M.F. Oliveira-Campos, L.V. Stebunova, G.K. Chudinova, V.G. Avakyan, I.A. Maslianitsin, V.D. Shigorin, J. Sci. Appl. Photogr. (Russ.) 47 (2002) 4–8; (c) M.M.M. Raposo, A.M.R.C. Sousa, A.M.C. Fonseca, G. Kirsch, Tetrahedron 61 (2005) 8249–8256. |
| [11] | R. Prasad, D.J. Williams, Introduction to Nonlinear Optical Effects in Molecules and Polymers, Wiley-Interscience, New York, 1991. |
| [12] | Y.-X. Sun, Q. L. Hao, W. X. Wei, Z. X Yu, D. D. Lu, X. Wand, and Y. S. Wang. (2009) J. Mol. Struct. Theochem., 904, 74–82. |
| [13] | R. Zhang, B. Du, G. Sun, and Y. Sun. (2010) Spectrochim. Acta A, 75, 1115–1124. |
| [14] | Abou A.,Yoda J., Djandé A., Coussan S. and Zoueu T J. Acta Cryst. (2018). E74, 761–765. |
| [15] | Abou A., Sosso S., Kouassi A F., Zoueu T J., Djandé A., Ouari O. Sci. J. Chem. (2021); 9(2): 29-44. |
| [16] | Koulabiga Z., Yao K H., Abou A., Djandé A., Giorgi M., Coussan S. (2024) Am. J. Org. Chem., 12(1): 1-19. |
| [17] | Rigaku OD (2015). CrysAlis PRO. Rigaku Oxford Diffraction, Yarnton, England. |
| [18] | Burla M C, Caliandro R, Carrozzini B, Cascarano G L, Cuocci C, Giacovazzo C, Mallamo M, Mazzone A and Polidori G, J. Appl. Cryst. (2015), 48: 306–309. |
| [19] | Farrugia L J, J. Appl. Cryst. (2012); 45: 849–854. |
| [20] | Sheldrick G M, Acta Cryst. (2015); C71: 3–8. |
| [21] | Frisch M. J., Trucks G. W., Schlegel H. B., Scuseria G. E., Robb M. A., Cheeseman J. R., et al.; (2013) GAUSSIAN09. Gaussian, Inc., Wallingford, CT, USA. |
| [22] | Hamdane, D., Lechauve, C., Marden, M.C. and Golinelli-Pimpaneau, B., Acta Cryst. (2009). D65, 388–392. |
| [23] | Ziki E, Yoda J, Djandé A, Saba A and Kakou-Yao R, Acta Cryst. (2016); E72: 1562–1564. |
| [24] | Janiak J, J. Chem. Soc. Dalton Trans. (2000), 3885–3896 |
| [25] | Macrae, C.F., Sovago,I., Cottrell, S. J., Galek, P. T. A., McCabe, P., Pidcock, E., Platings, M., Shields, G. P., Stevens, J. S., Towler, M. and Wood, P. A., J. Appl. Cryst., 53, 226-235, 2020. |
| [26] | Politzer P. and J. S. Murray J. S.; (2002) Theor. Chem. Acc., 108(3), 134–142. |
| [27] | Cinar, E. B., Faizi, Md. S. H., Yagci, N. K., Dogan, O. E., Aydin, A. S., Agar, E., Dege, N. & Mashrai, A. (2020). Acta Cryst. E76, 1551–1556. |
| [28] | Pearson, R. G. (1986). Proc. Natl. Acad. Sci. U.S.A. Nov;. 83(22): 8440-8441. |
| [29] | S. Yazıcı, Ҫ. Albayrak, I. Gümrükçüoǧlu, I. Șenel, and O. Büyükgüngör; (2011) J. Mol. Struct., 985, 292–298. |
| [30] | D. S. Chemia and J. Zyss, Non LinearOptical Properties of Organic Molecules and Crystal, Academic Press, New York, NY, USA, 1987. |
| [31] | J. Zyss, Molecular Non Linear Optics, Academic Press, Boston, Mass, USA, 1994. |
| [32] | A. Ben Ahmed, H. Feki, Y. Abid, and C. Minot; (2010) Spectrochim. Acta A, 75, 1315–1320. |
| [33] | Suponitsky, K.Y., Tafur, S, Masunov A.E.; (2008) J. Chem. Phys., 129, 044109-11. |
| [34] | Avci, D., Başoğlu A., Atalay, Y.; (2011) Int. J. Quantum Chem., 111, 130-147. |
| [35] | A. E.H. Machado., N. M.B. Neto., L. T. Ueno., L. F. de Paula., D.M.S. Araújo., G.S. Oliveira., W.R. Gomes., R. de Paula., P.L. Franzen., S.C. Zilio., A.M.F. Oliveira-Campos., A.M. Fonseca., L.M. Rodrigues., P.O. Nkeonye., R. Hrdina. (2008) J. Photochem. Photobiol. A 199, 1, 23–33. |
| [36] | Abraham, J.P., Sajan, D., Hubert, Joe I.H. and Jayakumar, V.S.; (2008) Spectrochim. Acta A, 71, 355-367. |
| [37] | Karamanis, P, Pouchan, C. and Maroulis, G.; (2008) Phys. Rev. A 77, 013201-013208. |
| [38] | A. Ben Ahmed, H. Feki, Y. Abid, and C. Minot; (2010) Spectrochim. Acta A, 75, 1315–1320. |
| [39] | Nkungli, N.K.; Ghogomu, J.N.; (2016) J. Theor. Chem., 2016, 1–19. |
| [40] | Pluta, T.; Sadlej, A.J.; (2001) J. Chem. Phys., 114, 136. |
| [41] | Song, X.; Farwell, S.O.; (2004) J. Anal. Appl. Pyrolysis, 71, 901–915. |
| [42] | Eșme, A., Güneșdoǧdu Saǧdinç, S.; (2014) BAÜ Fen Bil. Enst. Dergisi Cilt. 16(1), 47-75. |
| [43] | Spek, A. L., 2009, Acta Cryst., D65, 148–155. |