-
Paper Information
- Paper Submission
-
Journal Information
- About This Journal
- Editorial Board
- Current Issue
- Archive
- Author Guidelines
- Contact Us
American Journal of Chemistry
p-ISSN: 2165-8749 e-ISSN: 2165-8781
2023; 13(3): 68-82
doi:10.5923/j.chemistry.20231303.02
Received: Jun. 29, 2023; Accepted: Jul. 17, 2023; Published: Jul. 21, 2023

Solid-State NMR & FT-IR Spectroscopic Analysis of Anhydrous & Hydrated Mixtures of Portland Cement and Calcined Clay Blended with Maize Cob & Saw Dust: An Innovative Utilization of Bio-Waste Products as Supplementary Cementitious Material
 Abstract
 Reference
 Full-Text PDF
 Full-text HTML
Sudhaunshu S. Purohit
ETS Laboratories, USA
Correspondence to: Sudhaunshu S. Purohit, ETS Laboratories, USA.
| Email: |  |
Copyright © 2023 The Author(s). Published by Scientific & Academic Publishing.
This work is licensed under the Creative Commons Attribution International License (CC BY).
http://creativecommons.org/licenses/by/4.0/

The construction industry of modern society is undoubtedly highly dependent on cement & concrete with Portland Cement (PC) being the most commonly used type. The crucially desired properties such as strength, impermeability, durability through the resistance to thermal, mechanical & chemical stresses that PC offers over the long time spans are practically unmatched till date which makes its incorporation inevitable. Nevertheless, the production of PC responsible for a large amounts of CO2 emissions (6-7% of the total), has received a significant attention from academic & industrial researchers to invent more sustainable alternatives. As the demand for concrete continues to grow exponentially around the globe, in order to reduce the environmental footprint of construction industries, the development of sustainable building materials is essential. Accordingly, various types of eco-friendly supplementary cementitious materials (SCMs) which are widely used in concrete have become the focus of studies due to their enhanced physical properties along with reaction mechanisms & kinetics when blended with PC. This specific publication is a continuation of a previous study which revolves around exploring a possibility of utilizing calcined clay mixed with certain naturally occurring bio-waste products such as maize cob & saw dust as SCMs. In order to understand the local atomic structure and subsequently the complex chemical nature of cement systems involving crystallographically disordered phases, the spectroscopic techniques such as Solid-State Nuclear Magnetic Resonance (SS NMR) in combination with Fourier Transformed Infrared (FT-IR) have played a pivotal role with proven capability of thoroughly analyzing both anhydrous & hydrated solid phases in cementitious materials. The advanced applications of SS MAS NMR probing 27Al & 29Si nuclei are the most routinely applied experiments proven to be useful in studying the cements have been instrumental in understanding the research project discussed herein.
Keywords: Supplementary Cementitious Materials, Calcined Clay Pozzolan, Portland Cement, Hydration, Bio-Waste Products, Maize Cob, Saw Dust, Spectroscopic Analysis, Fourier Transformed Infrared (FT-IR), Solid-State Magic Angle Spinning Nuclear Magnetic Resonance (SS MAS NMR)
Cite this paper: Sudhaunshu S. Purohit, Solid-State NMR & FT-IR Spectroscopic Analysis of Anhydrous & Hydrated Mixtures of Portland Cement and Calcined Clay Blended with Maize Cob & Saw Dust: An Innovative Utilization of Bio-Waste Products as Supplementary Cementitious Material, American Journal of Chemistry, Vol. 13 No. 3, 2023, pp. 68-82. doi: 10.5923/j.chemistry.20231303.02.
Article Outline
1. Introduction
- The construction and manufacturing business all around the world has incorporated supplementary cementitious material (SCM) such as coal fly ash, silica fume, finely ground limestone, metakaolin and blast furnace slag as cement substitutes in concrete in order to promote sustainable construction. SCMs are classified into 3 categories: 1) Filler Materials: the inert materials which contribute little to the hydration of cement pozzolanic and hydraulic materials, 2) Pozzolanic Materials: the fine alumino-silicates (without direct cementitious value) that chemically react with calcium hydroxide at ordinary temperatures to form additional calcium silicate hydrate and other cementitious compounds and 3) Hydraulic Materials: which chemically react with water to form cementitious compounds. Fillers include chalk & limestone, Pozzolans include fly ash, silica fume & calcined clays whereas, Hydraulic materials include steel slag & ground granulated blast furnace slag (slag cement). Raw clays which are infinitely available globally, after undergoing essential processes such as extraction, calcination & grinding transform into a reactive material termed as a calcined clay. In the recent times a growing interest in using the calcined clays as suitable SCMs for construction has been witnessed among construction professionals and researchers worldwide as pozzolanic materials are well known to contribute improved mechanical and durability properties to the cement based products including concrete, mortar & paste [1-5]. In addition, it has been well documented that pozzolans minimize energy consumption along with CO2 emission in cement producing plants. The conventional cement production generates between 5-8% of the total carbon emissions worldwide. The cementing efficiency factor k of a pozzolan is defined as the number of parts of cement in a concrete mixture that could be replaced by one part of pozzolan without changing the property being investigated. Accordingly, partially replacing the Portland Cement (PC) with clay pozzolans will result in a substantially reducing the carbon incorporated, would not be an understatement [6-11].Clays are classified into Kaolinitic, Smectite & Illite groups possessing the basic building blocks in the form of sheets of Silicon tetrahedral and Aluminum octahedral layer defining the atomic structure of every clay mineral where, a tetrahedral sheet is always combined with an octahedral sheet. The Kaolinitic groups are comprised of a 1:1 layers of tetrahedral & octahedral sheets. Both of the Smectite and the Illitic group are found to consist of a 2:1 layer where, an octahedral sheet is sandwiched in-between 2 opposing tetrahedral sheets. A Kaolinite with disorganized structure, using the correct calcination process & grinding will have its pozzolanic potential fully utilized, thus allowing higher replacement content while maintaining the same overall performance. Usually, dehydroxylization, calcination & crystallization are 3 common processes that occur during calcination. Octahedral sheets transform into a meta-stable state by losing water during dehydroxylization producing amorphous materials which are more reactive to free Calcium Hydroxide (Ca(OH)2) present during hydration. The end of the dehydroxylization process marks the calcination temperature influencing the environment of the layered silicate along with signifying the reactivity of calcined clays. Calcined clay is an important and well-researched material used as SCM in the production of concrete with its reactivity being primarily dependent on the crystalline structure of a raw clay. Kaolinitic clays are the most suitable for calcined clay production, presenting the highest potential for pozzolanic activity. The effective temperature of calcination also plays crucial role in the reactivity along with Kaolinite content. A restricted reactivity is detected at a low calcination temperature which are insufficient to convert Kaolinite into meta-Kaolin whereas, a high temperature leads to additional crystallization. It is observed that at appropriate calcination temperatures clay minerals become highly reactive with PC during hydration by undergoing the thermal activation process through calcination and thus deliver an improved strength & durability to the concrete. Generally, temperature in the range of 500-900°C is suitable to produce reactive clays with the exact calcination temperature optimum for thermal activation of any clay being dependent on its origin & chemistry along with its amount & the types of impurities contained within. It is experimental that at high temperatures of about 600°C the clay minerals begin crystallization thus decreasing the reactivity [13-17].
|
2. Materials
- The materials used for the study were clay, cement, silica, maize cob & saw dust, polycarboxylate ‘High Range Water Reducer’ (HRWR) along with potable water. The clay was obtained from Nyamebekyere area whereas, both of the maize cob & saw dust were obtained from Konongo & Fumesua area in the Ashanti Region of the country Ghana in the continent of Africa. Portland cement was conformed to ASTM C150 (both Type-I & Type-II) and was obtained from ‘Ash Grove Cement Company’ (acquired by an Irish company, CRH plc in 2018) plant located in Chanute, in the state of Kansas, USA. Graded silica conformed to ASTM was used. A polycarboxylate HRWR, obtained from BASF Chemical Company conformed to ASTM C595 was used.
2.1. Preparation of the Mixtures of Clay with Maize Cob (MC) & Saw Dust (SD) by Calcination
- The clay was preconditioned by air-drying for 3 days and then milled in a hammer mill to sizes 75 µm-2 mm. The maize cob & saw dust were also separately milled with the hammer mill into smaller particles and further used to replace the powder clay at 1, 1.5 & 2% by weight. The subsequent mixture was used to formulate pellets of sizes 1-3 mm. The pellets then placed in a ceramic bowl (diameter: 120 mm, depth: 90 mm) were calcined in a laboratory furnace (Barnstead Thermolyne 6000) at 800°C for 3 hours. In the previous study [18], the clay calcined at 800°C temperature, was observed to attain maximum pozzolanic reactivity index. After 3 hours, the ceramic bowl was removed from the furnace and was cooled down to room temperature for 24 hours. The cooled calcined materials were then milled in a laboratory hammer mill and sieved through 75 µm size using a mechanical sieve shaker. The powdered mixtures were then utilized in the preparation of the binder paste.
2.2. Preparation of the Anhydrous & Hydrated Mixtures of Portland Cement (PC) & Calcined Clay (CC) with Maize Cob (MC) & Saw Dust (SD)
- Anhydrous & hydrated mixtures used for spectroscopic studies were obtained from the binder paste which was prepared based on the optimum compressive strength value obtained by replacing PC with 20% by weight of the calcined material which in the previous study [18] was observed to attain maximum pozzolanic reactivity index. Exclusively for the PC, the normal consistency was obtained by the addition of potable water to the cement whereas, for the mixtures of cement & calcined pozzolan, the same was obtained by the addition of water along with iterative addition of HRWR. This paste of normal consistency was then cured under damp burlap for 24 hours after which, the hardened paste was removed from the Vicat mould and was segregated into 4 portions. The 1st portion was dried in an electric oven at 80°C for about 6 hours and later grounded into fine particles to be sieved on the 75 µm size. This, completed the preparation of anhydrous mixtures of PC & CC with MC & SD. The remaining 3 portions of the hardened paste were further subjected for curation using lime saturated water for 3, 7 & 28 days. After each curing period, the specimen were dried in an electric oven at 80°C for about 6 hours and later grounded into fine particles to be then sieved on the 75 µm size. 15 g of each sieved sample portions were collected and stored in a centrifuge bottle, mixed with methanol to completely cease the hydration process which were further dried in oven at 80°C. This, completed the preparation of hydrated mixtures of PC & CC with MC & SD. The anhydrous and hydrated samples prepared in this manner were then utilized for further FT-IR and SS-NMR spectroscopic analysis [20-23].
3. SS-NMR and FT-IR Experimental Methods
3.1. Multinuclear (Aluminum & Silicon) Solid-State Magic Angle Spinning Nuclear Magnetic Resonance Spectroscopy
- In NMR experiments the sample is held in an external magnetic field (B0) and a radiofrequency pulses equal to that of the Larmor frequency of the nucleus under focus is applied to induce precession of the nuclear spin. The electromagnetic response/signal produced as the nuclei relax back to their equilibrium states is then measured as a free induction decay, which is then converted to an NMR spectrum by applying a Fourier transform. The NMR spectrum contains resonances characteristic of near-neighbour atomic environments. Tecmag Apollo Console (Houston, TX) with 8.45 T magnet and homebuilt, single channel, 4 mm wide-bore NMR probe was used to obtain 27Al & 29Si NMR spectra. About 90 mg of the powdered sample was taken for each analysis and placed in a cylindrical zirconia rotor of 4.0 mm outer diameter. The signals are represented as chemical shift (δ) value in ppm. The 27Al & 29Si Larmor frequencies were 93.074 MHz & 70.958 MHz respectively. 27Al spectra were acquired with MAS spinning frequency, last delay & 90° pulse length to be 8 KHz, 1s & 2.5 μs, respectively. 29Si spectra were acquired with MAS spinning frequency, last delay & 60° pulse length to be 8 KHz, 20s & 5.5 μs, respectively. Aluminum Nitrate [Al(NO3)] and Tetramethyl Silane (TMS) were used as reference compounds for 27Al & 29Si spectra respectively. All experiments were performed at ambient temperature without any corrections for sample heating.
3.2. Fourier Transformed Infrared Spectroscopy
- Fourier Transform Infrared Spectroscopy (FT-IR) being a fast and simple technique for functional group identification, samples were tested for the structural changes within them. FT-IR experiments involve illuminating the samples with the radiations from the infra-red (near, middle & far) region. The bonds of certain functional groups of the sample molecules possessing the dipole moment after absorbing the energy from the radiations undergo vibrational fluctuations due to the net change in the dipole moment. The electromagnetic signal or Interferogram is then converted to a transmission spectrum by applying a Fourier transform.Attenuated Total Reflectance (ATR) Infrared spectroscopy was conducted using NICOLET iS10 FT-IR spectrometer equipped with a fast recovery Deuterated Triglycine Sulfate (DTGS) detector and an extended KBr beam-splitter. Infrared spectrum was obtained from 4000 to 600 wavenumbers (cm–1) and 512 acquisitions were added at a spectral resolution of 2 cm–1. All spectral measurements were carried out at room temperature.
4. Characterization of Cementitious Material Utilizing SS MAS NMR Spectroscopy
- The NMR spectra of solids (studying cements) in comparison to liquids are broadened due to magnetic dipolar interactions, anisotropy of the chemical shielding and quadrupolar interactions between the intrinsic nuclear electric quadrupolar moment and the surrounding electric field gradient which necessitates the application of sample spinning methods to reduce broadening. Spinning a sample at an angle of cos2 θ(MAS) = ⅓ θ(MAS ≈ 54.74°) with respect to that of the static magnetic field (B0) is an intrinsic part of the Magic Angle Spinning (MAS) technique in order to suppress the dipolar interactions and in turn to remove both chemical shielding anisotropy along with 1st order quadrupolar interactions thus, narrowing the spectral line-shapes [24].
4.1. 27Al SS MAS NMR
- 27Al SS MAS NMR spectroscopy is frequently used to characterize aluminate phases because it is a very sensitive nucleus to perform NMR studies on. Al sites are differentiated by the coordination number, with tetrahedral Al species identified using ‘qn’ notation. ‘q’ = Al in tetrahedral coordination linked to ‘n’ (0 ≤ n ≤ 4) tetrahedral silicon sites via Oxygen bridges.Tetrahedral Al sites are typically observed to resonate within 80-50 ppm whereas the same for octahedral within 20-0 ppm, relative to Al(H2O)6+3(aq). The 5-coordinated Al along with highly distorted tetrahedral Al environments on the other hand can be observed in the 50-20 ppm region. Although, 4 & 6-coordinated Aluminum can readily be distinguished, 27Al being a quadrupolar nucleus (spin = ⁵∕₂) contributes in causing difficulties in spectral interpretation. 27Al is affected by the quadrupolar interaction which in turn additionally gets affected by electric field gradients within the sample leading to a field-dependent shift in resonance position thus, broadening the peaks. Specifically, for disordered solids (cementitious phases) where the line shapes are not well defined, the spectra can become very difficult to resolve in the presence of overlapping quadrupolar resonances from several sites. In the case of solution state NMR, due to the large interactions the rapid relaxation of the quadrupolar nucleus occurs which at the most can result in very broad peaks [25-37]. In general, NMR of half-integer, quadrupolar nucleus have become prevalent allowing an investigation of a broad array of materials. Recent technological advancements along with new pulse sequences have opened up the periodic table (73% of NMR active nuclei are quadrupolar) to solid-state NMR. It is rather essential to discuss the theoretical aspects of NMR of quadrupolar nucleus in order to be able to interpret its spectra. The asymmetric charge distribution (an intrinsic property) in the nucleus, expressed as the nuclear electric quadrupole moment, eQ is always the same regardless of the environment. Similar to the dipolar interaction, the quadrupolar interaction is also a ground state interaction, specifically dependent upon the distribution of electric point charges in the molecule resulting in electric field gradients with which a quadrupolar nuclei interacts. In the center of a spherically symmetric molecule, the electric field gradients for a quadrupolar nuclei are observed to decrease by canceling each other, whereas, they are observed to grow as the spherical symmetry breaks down. In contrast to the nuclei with spin = ½ possessing a spherical distribution of positive electric charge, a quadrupolar nuclei with a spin > ½ (experiencing additional 2nd order quadrupolar interactions) & an asymmetric distribution of nucleons gives rise to a non-spherical distribution of the same which limits spectral resolution due to anisotropic broadening of the signals. However, through the use of high magnetic fields, these 2nd order quadrupolar interactions being inversely proportional to the strength of B0 can be reduced [38-41].
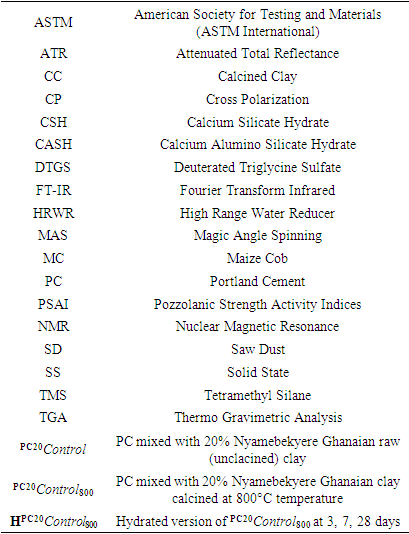
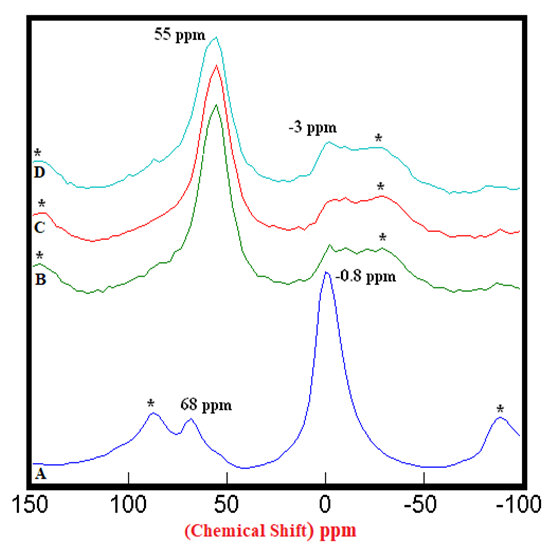
4.1.1. 27Al SS MAS NMR of Anhydrous Mixtures
- The 27Al SS MAS NMR spectra of anhydrous mixtures of PC & CC (at 800°C) with MC & SD are presented in Figures 1.1 & 1.2. It has been experimental that the tetrahedral sheet resonates from 50 ppm to 80 ppm whereas the octahedral sheet resonates from -20 to 20 ppm which was confirmed by the Spectrum-A of PC20Control. The raw clay showed 2 distinct peaks resonating at 68 ppm & -0.8 ppm indicating a 1:1 Kaolinite group representing an octahedral & a tetrahedral sheets. The mixtures of PC & CC (at 800°C) with MC & SD depicted in Spectra-B, C, D in both of these figures through distinct peaks at 55 ppm & -3 ppm, exhibited an increase in the intensities of Al(iv) and decrease in the intensities of the Al(vi) environments with reference to that of the raw clay indicating greater reactivity of calcined clay mixtures with bio-waste material. The intensities of the peaks at 55 ppm (the 4-coordinated environment of Al) were difficult to attain because of the nature of the reference peak of raw clay at 68 ppm that can potentially produce higher error of margin being merged with the adjacent spinning side band (indicated by Asterisk). This limitation hindered our interest in calculating the respective peak areas of all the peaks at 68 ppm & 55 ppm.
 | Figure 1.1. 27Al SS MAS NMR of Anhydrous Mixtures of [PC & CC with MC]. A) PC20Control (-0.8 ppm) = 100%, B) [PC20Control800 + 1% MC] (-3 ppm) = 24%, C) [PC20Control800 + 1.5% MC] (-3 ppm) = 27%, D) [PC20Control800 + 2% MC] (-3 ppm) = 34%, § Peak areas are normalized w.r.t. that of PC20Control; Side-Bands are denoted by Asterix |
 | Figure 1.2. 27Al SS MAS NMR of Anhydrous Mixtures of [PC & CC with SD]. A) PC20Control (-0.8 ppm) = 100%, B) [PC20Control800 + 1% SD] (-3 ppm) = 27%, C) [PC20Control800 + 1.5% SD] (-3 ppm) = 29%, D) [PC20Control800 + 2% SD] (-3 ppm) = 36%, § Peak areas are normalized w.r.t. that of PC20Control; Side-Bands are denoted by Asterix |
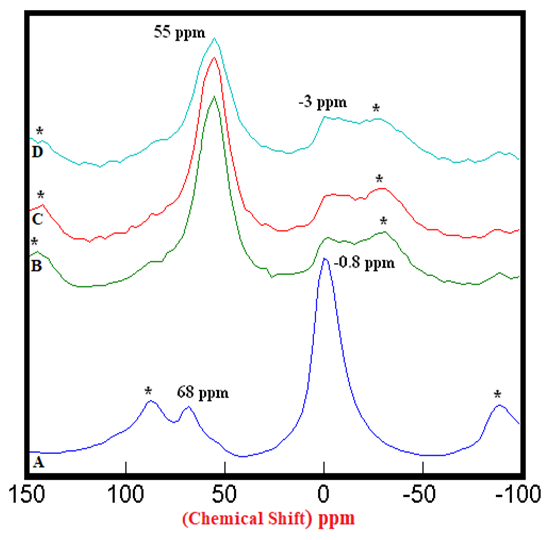
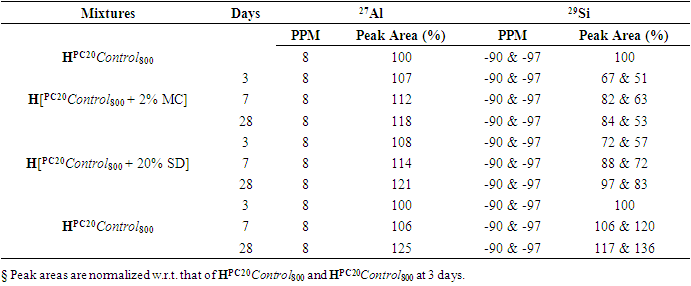
4.1.2. 27Al SS MAS NMR of Hydrated Mixtures
- The 27Al SS MAS NMR spectra of mixtures of PC & CC (at 800°C) with MC & SD hydrated at different timelines viz. 3, 7, 28 days are presented in Figures 2.1, 2.2, 2.3, and Figure 2.4 is specifically presented to show the comparison of exclusively HPC20Control800 at 3, 7, 28 days. Each of these figures consist of 3 spectra-A, B, C representing the hydrated binder paste mixtures of MC & SD along with their controls at 3, 7, 28 days with distinctive peaks at chemical shifts of 8 ppm & 68 ppm. The peak at 68 ppm corresponds to Al environment replacing Si and the CSH in the tetrahedral environment of Al to form a metastable Hydrogarnet or CASH. The intensities of this peak were difficult to attain because of its nature that can potentially produce higher error of margin being merged with the adjacent spinning side band (indicated by Asterisk), the limitation which further hindered our interest in calculating the respective peak areas of all the peaks at 68 ppm. The peak at 8 ppm corresponds to thermodynamically more stable mono-sulphates (AFm) present in the Aluminosilicate Hydrates or Stratlingite (C2AH8) formed. The increasing intensities of the peak at 8 ppm over the time from 3 to 28 days indicates more Aluminum passing into cement solution forming Stratlingite containing Afm phases along with the substitution of Al3+ for Si4+ promoting the stability to form Calcium Aluminosilicate Hydrates (CASH). The process of hydration is observed to progress gradually from 3 to 28 days with an increased Aluminum phase in the tetrahedral Al(iv) environment that dissolved in the solution into the octahedral Al(vi) environment due to the presence and the reactions of the pozzolanic material. This explained the reason for the higher strength of hydrated mixtures of PC & CC (at 800°C) with MC & SD more than that of their respective control and this trend is more prominent in the case of blends with SD in comparison to that of MC.
 | Figure 2.1. 27Al SS MAS NMR of Hydrated Mixtures of [PC & CC with 2% MC & 20% SD] at 3 Days (8 ppm). A) HPC20Control800 = 100%, B) H[PC20Control800 + 2% MC] = 107%, C) H[PC20Control800 + 20% SD] = 108%, § Peak areas are normalized w.r.t. that of HPC20Control800; Side-Bands are denoted by Asterix |
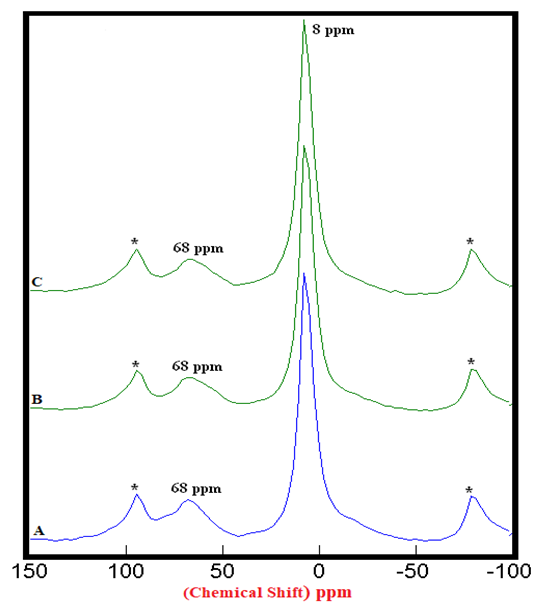 | Figure 2.2. 27Al SS MAS NMR of Hydrated Mixtures of [PC & CC with 2% MC & 20% SD] at 7 Days (8 ppm). A) HPC20Control800 = 100%, B) H[PC20Control800 + 2% MC] = 112%, C) H[PC20Control800 + 20% SD] = 114%, § Peak areas are normalized w.r.t. that of HPC20Control800; Side-Bands are denoted by Asterix |
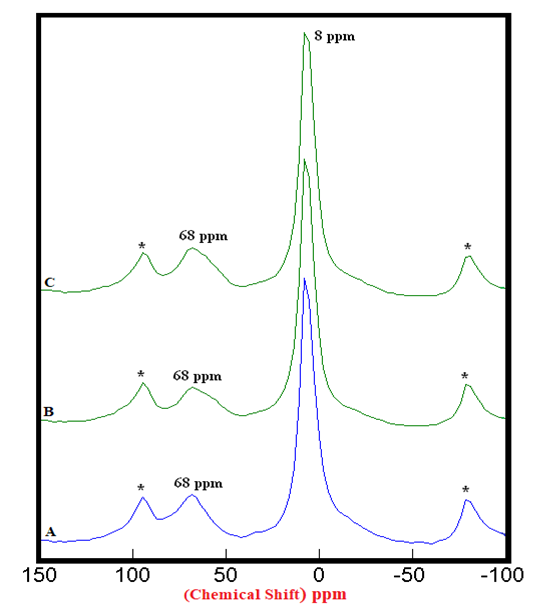 | Figure 2.3. 27Al SS MAS NMR of Hydrated Mixtures of [PC & CC with 2% MC & 20% SD] at 28 Days (8 ppm). A) HPC20Control800 = 100%, B) H[PC20Control800 + 2% MC] = 118%, C) H[PC20Control800 + 20% SD] = 121%, § Peak areas are normalized w.r.t. that of HPC20Control800; Side-Bands are denoted by Asterix. |
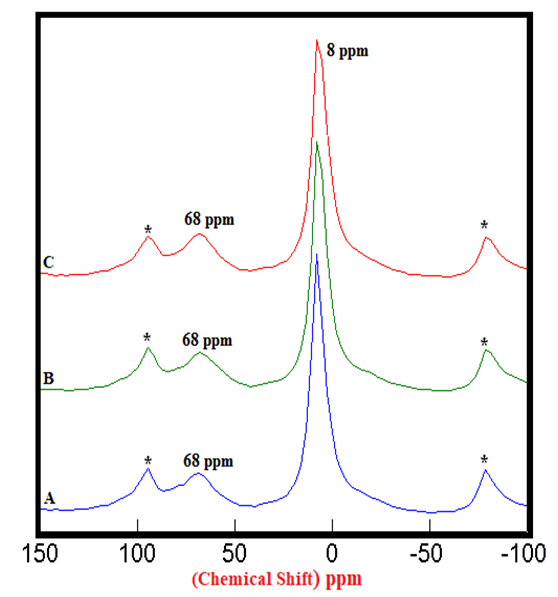 | Figure 2.4. 27Al SS MAS NMR of Hydrated Control Mixtures of [PC & CC] i.e. HPC20Control800 at 3, 7, 28 days (8 ppm). A) 3 Days = 100%, B) 7 Days = 106%, C) 28 Days = 125%, § Peak areas are normalized w.r.t. that of HPC20Control800 at 3 days; Side-Bands are denoted by Asterix |
4.2. 29Si SS MAS NMR
- 29Si SS MAS NMR being a powerful, well-established & largely used technique for probing the structural environments of silicon-containing solid materials can dramatically decrease the longitudinal relaxation time T1, consequently allows the rapid data collection of the spectrum. 29Si chemical shifts are highly diagnostic of the variety of functional groups involving silicon in both solution & solid-state NMR. In the field of ‘Cement Science & Technology’, 29Si SS MAS NMR spectroscopy has proven to be extremely useful in the structural determination of silicates, ordinary Portland cements and also to investigate the hydration & setting reactions of pure tricalcium silicate (C3S) & pure dicalcium silicate (β-C2S) phases. Additionally, it is a feasible method for characterization because of its effectiveness towards the structural determination of both crystalline & amorphous materials as it does not rely on long-range order. 29Si SS MAS NMR can be used to differentiate among the various Qn species to calculate the degree of hydration and average silicate chain length of the Calcium Silicate Hydrate (C-S-H) gel and silicate tetrahedra within the anhydrous phases. In order to attain the best combination of accuracy, speed & ease of processing various 29Si NMR relaxation techniques such as inversion recovery, variable-delay Bloch decay and saturation recovery can be experimented to determine the relative concentrations of C3S/C2S ratios. Accordingly, this technique has the potential to provide valuable information on the effects of cement composition, particle size, additives and contaminants on the structure of calcium silicate-based endodontic cements that cannot be obtained by other instrumental methods [24,32-37].Usually, 29Si NMR spectra are interpreted in terms of the difference in silicon ‘Q’ environments where, Si in tetrahedral coordination (Q) is bonded to ‘n’ other tetrahedral atoms via Oxygen bridges. Type Qn(mAl) with 0 ≤ m ≤ n ≤ 4‘n’ = number of bridging Oxygen for each Q (SiO) unit. The silicon atoms involved in siloxane bridges (Q4), single silanol (Q3) & geminal silanol groups (Q2) on the surface of silica can be distinguished through 29Si SS NMR spectra. The relative proportions of each species can be obtained by the cross-polarization (CP-MAS) associated with 1H → 29Si. Qn(mAl) Si sites within cementitious materials typically resonating in the region from -60 ppm to -140 ppm relative to TMS, with significant overlap between the broad resonances observable in the disordered solid phases with a more negative chemical shift induced by a higher connectivity (higher n). Each additional tetrahedral Al atom replacing a Si, neighboring a Qn(mAl) silicon site also causes rise in the chemical shift by ~5 ppm providing an important point of differentiation between Qn(mAl) sites as a function of ‘n’ & ‘m’. The hydrated cement shows the presence of Q0 units due to ortho-silicate groups, Q1 units from Si-O-SO3 groups in dimers or in terminating polymers and Q2 units from Si-O-Si-O-Si groups in trimers & in higher polymers. On mixing with water the C3S & C2S phases undergo exothermic hydration reactions to form hexagonal crystals of calcium hydroxide (CaOH2) and an adhesive C-S-H gel network resulting in the setting of mixture. C-S-H, a poorly crystalline, layered, nano-porous phase of nonstoichiometric composition contains capillary water in its nano-pores whereas its meso- & macro-pores within the hydrated cement matrix contain free residual water. C-S-H is ideally comprised of double layers of Calcium Oxide (CaO) polyhedra linked on both sides to silicate chains. Anhydrous, unpolymerized, isolated (Q0) silicate tetrahedra in C3S & C2S are hydroxylated during hydration, which further dissolve and subsequently condense to form dimers (Q1). Additional condensation leads to the formation of short silicate chains comprising mid-chain (Q2) species facing into the CaO layer, bridging species (Q2B) that link the Q2 species and chain-end (Q1) groups [42-53].
4.2.1. 29Si SS MAS NMR of Anhydrous Mixtures
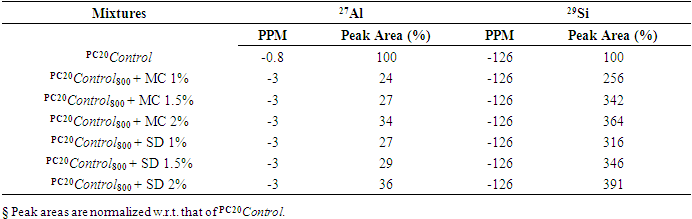
- The 29Si SS MAS NMR spectra of anhydrous mixtures of PC & CC (at 800°C) with MC & SD are presented in Figures 3.1 & 3.2. The figures show the Spectra-A, B, C, D with distinct chemical shifts at -110 ppm & -126 ppm corresponding to Q4 silicon coordinated environment. The process of calcination along with mixing of bio-waste materials in the raw clay, collapsed one of the Q4 population in the PC20Control with the remaining Q4 population increasing progressively in their intensities as the amount of MC & SD gradually increased from 1% to 2%. These increased intensities can be attributed to the presence of recrystallized quartz. The high intensity obtained at the Q4 silicon population depicted in both of these figures confirm the presence of more reactive phases in the mixtures than the raw clay control with this trend being more prominent in the case of blends with SD in comparison to that of MC.
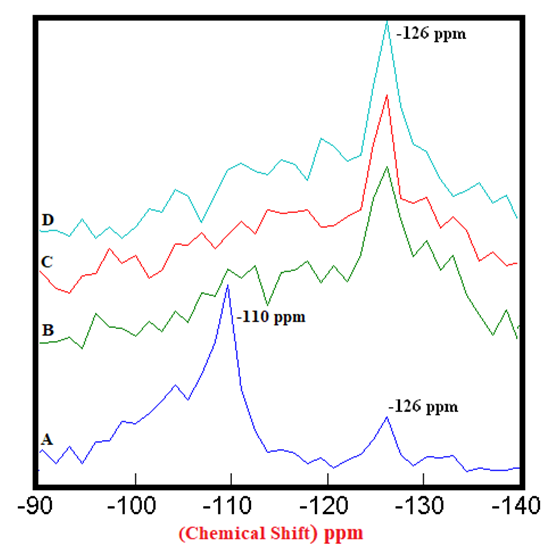 | Figure 3.1. 29Si SS MAS NMR of Anhydrous Mixtures of [PC & CC with MC] (-126 ppm). A) PC20Control = 100%, B) [PC20Control800 + 1% MC] = 256%, C) [PC20Control800 + 1.5% MC] = 342%, D) [PC20Control800 + 2% MC] = 364%, § Peak areas are normalized w.r.t. that of PC20Control |
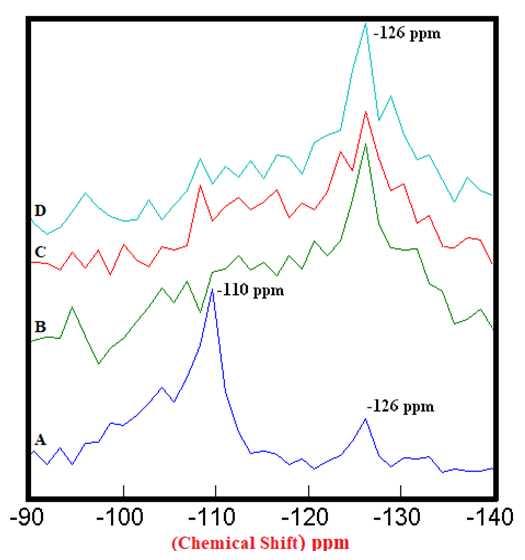 | Figure 3.2. 29Si SS MAS NMR of Anhydrous Mixtures of [PC & CC with SD] (-126 ppm). A) PC20Control = 100%, B) [PC20Control800 + 1% SD] = 316%, C) [PC20Control800 + 1.5% SD] = 346%, D) [PC20Control800 + 2% SD] = 391%, § Peak areas are normalized w.r.t. that of PC20Control |
4.2.2. 29Si SS MAS NMR of Hydrated Mixtures
- The 29Si SS MAS NMR spectra of mixtures of PC & CC (at 800°C) with MC & SD hydrated at different timelines viz. 3, 7, 28 days are presented in Figures 4.1, 4.2, 4.3 and Figure 4.4 is specifically presented to show the comparison of exclusively HPC20Control800 at 3, 7, 28 days. Each of these figures consist of 3 spectra-A, B, C representing the hydrated binder paste mixtures of MC & SD along with their controls at 3, 7, 28 days with distinctive peaks at chemical shift of -90 ppm & -97 ppm. The peak at -90 ppm indicates partly a Q2 & Q3 (1Al) unit where Al3+ enters the C-S-H structure forming Gehlenite, an Aluminum rich compound. The incorporation of MC & SD in the PC partially responded to pozzolanic reaction after 3 days, which is indicated as a slightly intense peak in spectra-B & C w.r.t that of spectrum-A. At 7 days, the spectra of the control and MC & SD show an increase in polymerization with time along with the formation of an additional peak at −103 ppm which could be attributed to the effect of pozzolanic action (C-S-H formation). The spectra obtained after 28 days of hydration, indicates a decrease in the crystallinity of the C-S-H content in the Q2 & Q3 units with increase in the polymerization as well as the formation of an additional (Q4(01Al)) unit confirming the addition of calcined clay to cement causing a significantly enhanced polymerized material. This trend is more prominent in the case of blends with SD in comparison to that of MC as the peak intensities for SD are seen to be increased noticeably indicating the occurrence of pozzolanic reaction causing an increased strength due to the addition of both MC & SD in PC.
|
|
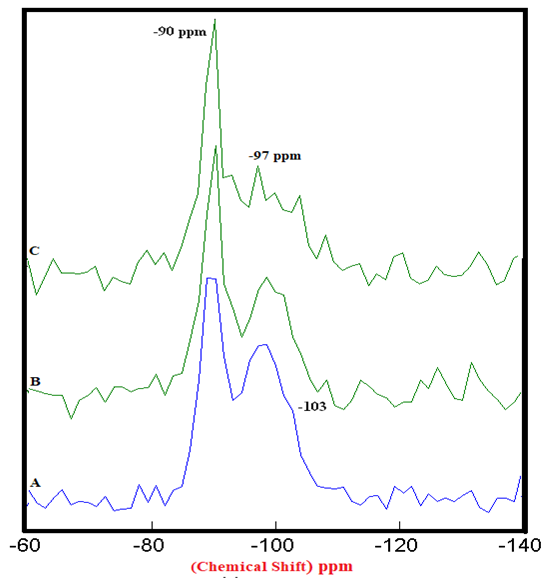 | Figure 4.1. 29Si SS MAS NMR of Hydrated Mixtures of [PC & CC with 2% MC & 20% SD] at 3 Days (-90 & -97 ppm). A) HPC20Control800 = 100%, B) H[PC20Control800 + 2% MC] = 67% & 51%, C) H[PC20Control800 + 20% SD] = 72% & 57%, § Peak areas are normalized w.r.t. that of HPC20Control800 |
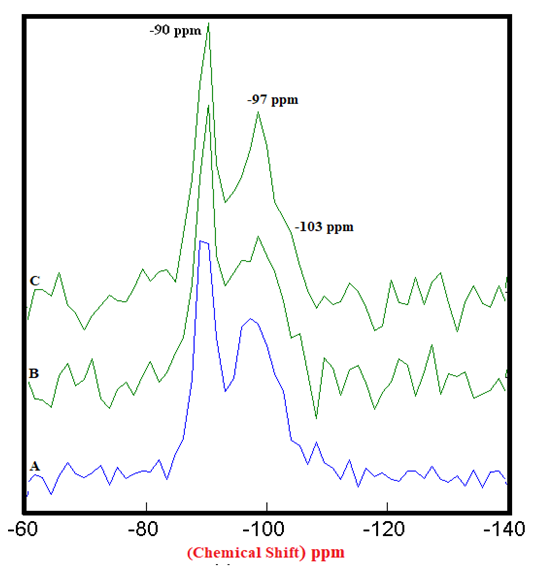 | Figure 4.2. 29Si SS MAS NMR of Hydrated Mixtures of [PC & CC with 2% MC & 20% SD] at 7 Days (-90 & -97 ppm). A) HPC20Control800 = 100%, B) H[PC20Control800 + 2% MC] = 82% & 63%, C) H[PC20Control800 + 20% SD] = 88% & 72%, § Peak areas are normalized w.r.t. that of HPC20Control800 |
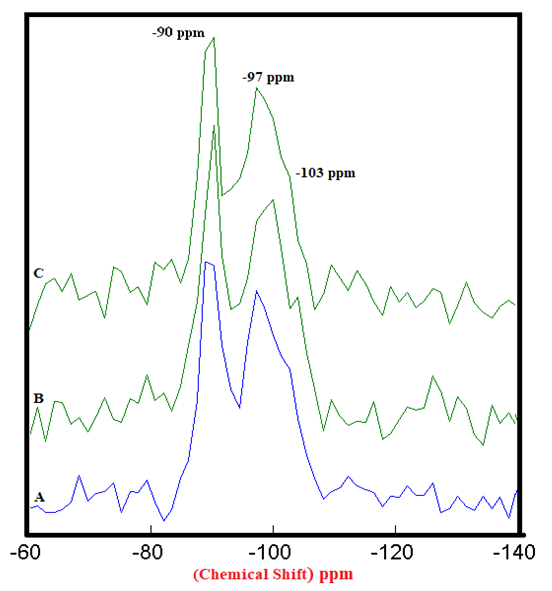 | Figure 4.3. 29Si SS MAS NMR of Hydrated Mixtures of [PC & CC with 2% MC & 20% SD] at 28 Days (-90 & -97 ppm). A) HPC20Control800 = 100%, B) H[PC20Control800 + 2% MC] = 84% & 53%, C) H[PC20Control800 + 20% SD] = 97% & 83%, § Peak areas are normalized w.r.t. that of HPC20Control800 |
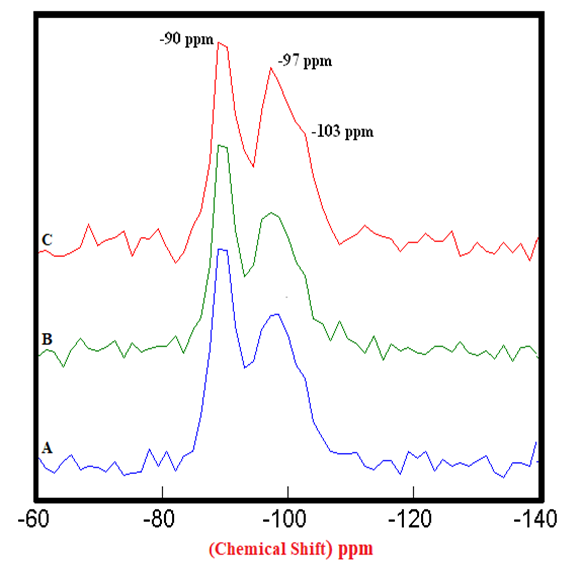 | Figure 4.4. 29Si SS MAS NMR of Hydrated Control Mixtures of [PC & CC] i.e. HPC20Control800 at 3, 7, 28 Days (-90 & -97 ppm). A) 3 Days = 100%, B) 7 Days = 106% & 120%, C) 28 Days = 117% & 136%, § Peak areas are normalized w.r.t. that of HPC20Control800 at 3 days |
5. Characterization of Cementitious Material Utilizing FT-IR Spectroscopy
- The purpose of conducting FT-IR experiments in the field of ‘Cement Science & Technology’ is, it being a rapid technique can be used to provide information in addition to and in support of SS-NMR by relating bond characteristics to that of the minerals. Similar to NMR spectroscopy; FT-IR can provide not only qualitative but also semi-quantitative & quantitative information. To designate a few, typical examples of paving materials characterization include identification & quantification of polymers in polymer-modified asphalt, aging & oxidation of asphalt binders, characterization of concrete curing membranes along with determining the constituting phases, analysis of alkali content & pozzollons in the concrete. The analysis done in ATR mode allows studying the surface of materials without any particular sampling method. It is a versatile tool for bond characterization of alumino-silicate and hydroxyl-based compounds which could also be used to differentiate between amorphous and crystalline products with linear or cross-link chain products. FT-IR is also capable of detecting the presence of anhydrous C3S & C2S and can monitor the development of the C-S-H gel via shifting to higher wavenumbers of the O-Si-O stretching vibrations as polymerization proceeds. Also, in order to study the polymerization of the silicates & decalcification process according to the conditions of cure & ageing, the shift of the peaks assigned to C-S-H can be detected using transmission mode. FT-IR spectroscopy has proven to be immensely helpful in investigating the bulk of lightweight mortar containing aggregates made of polymer waste and detecting residues of demolding agents & the presence of CaCO3 efflorescences. This technique is also observed to be efficient in studying AFt & AFm phases such as Ettringite, Sulfoaluminate or Hemicarbonate along with identifying the interface between concrete & the protective coating comprised of polymer or organic compounds. In general, a large number of FT-IR spectral studies on cement material have been conducted by various research groups. An investigation of oxide glasses indicated absorption band at 750 cm-1 belonging to K2O·2SiO2 whereas, the studies on OPC-fly ash cementitious systems proved the appearance of absorption band of 927 cm-1 belonging to clinkers are few of the inferences to mention about [54-68].
5.1. FT-IR of Anhydrous Mixtures
- The FT-IR spectra of anhydrous mixtures of PC & CC (at 800°C) combined with varying amounts of MC & SD are presented in Figures 5.1 & 5.2. The figures show vibrational spectral bands occurring between approximately 650 to 1850 cm-1 and molecular vibration from 2750 to 3700 cm-1. The spectrum-A of raw uncalcined clay, (PC20Control) in both of the figures showed distinctive vibration bands at 3693, 3651 & 3619 cm-1 conforming a metal bonded to hydroxide group attributed most likely to be a Kaolinite structure. Absorption bands corresponding to Al-O & Si-O were also observed at 1162, 1109, 1025, 999, 910, 777 & 692 cm-1. The spectra-B, C, D in both of the figures 5.1 & 5.2 belonging to the mixtures of various combinations with MC & SD demonstrated the disappearance of the Kaolinite structures as well as the water molecules. This indicates a change from a crystalline structure to an amorphous or metastable structure. The vibrational atoms that corresponded to Al/Si-O at 1162, 1109, 1025, 999 & 910 cm-1 were seen disappearing after calcination, whilst absorption bands at 777 & 692 cm-1 were observed to reduce in intensities which meant a change from octahedral coordination of Al+3 to a tetrahedral coordinated environment. The peak at 1629-1648 cm-1 (hydroxyl stretching wavenumbers) can be assigned to the water H-OH bending mode in raw uncalcined clay (spectrum-A). This Hydrogen bonded water mode is seen to appear protruding as the amount of MC & SD increases in the mixtures and this trend is more prominent in the case of blends with SD in comparison to that of MC.
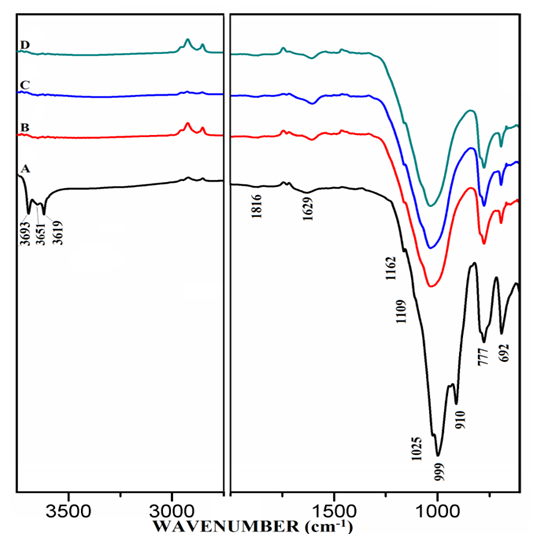 | Figure 5.1. FT-IR of Anhydrous Mixtures of [PC & CC with MC]. A) PC20Control, B) PC20Control800 + 1% MC, C) PC20Control800 + 1.5% MC, D) PC20Control800 + 2% MC |
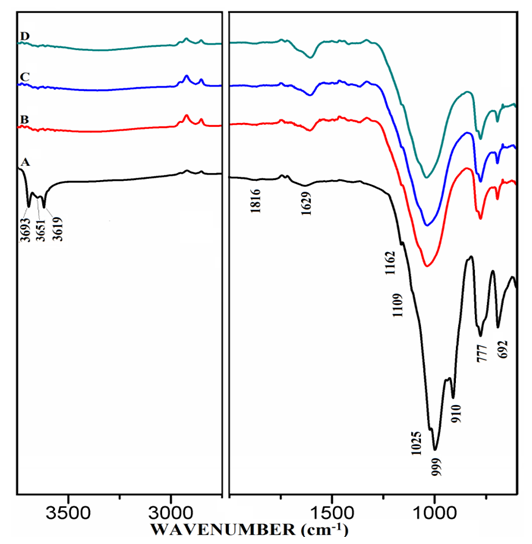 | Figure 5.2. FT-IR of Anhydrous Mixtures of [PC & CC with SD]. A) PC20Control, B) PC20Control800 + 1% SD, C) PC20Control800 + 1.5% SD, D) PC20Control800 + 2% SD |
5.2. FT-IR of Hydrated Mixtures
- The FT-IR spectra of mixtures of PC & CC (at 800°C) with MC & SD hydrated at different timelines viz. 3, 7, 28 days are presented in Figures 6.1, 6.2, 6.3. Specifically, Figure 6.4 is presented to show the comparison of exclusively HPC20Control800 at 3, 7, 28 days where, the frequencies of vibrational bands were observed at 3642, 3334, 1647, 1716, 1470, 1417, 1098, 953 & 871 cm-1. The infrared spectral data of hydrated cement materials could be identified broadly under 3 regions viz. water (beyond 1600 cm-1), sulphate (1100-1150 cm-1) & materials (below 1100 cm-1). The vibrational frequency band appearing at 3642 cm-1 is assigned to metal (usually Ca) bonded hydroxide (-OH) phase whereas, 3334 cm-1 & 1647 cm-1 can be assigned to stretching vibrational frequency of hydrogen bonded -OH (water molecules) respectively. The bands at 1470 cm-1 & 1417 cm-1 are related to stretching vibrational frequency of carbonate (CO3-2). The S-O stretching vibration appearing at 1098 cm-1 shows the presence of sulphate (SO4-2) in gypsum which participates in the hydration of cement. The band appearing at 953 cm-1 represents stretching vibrational frequency of Si-O-Si indicating the formation of C-S-H or Si-O-Al due to the formation of Calcium Alumino Silicate Hydrate (C-A-S-H). At this point, aluminate phase can possibly begin the formation of the C-A-S-H by entering into the silicate environment. The development of a peak is observed at 1716 cm-1 a characteristic of carbonyl group (C=O), specifically in the Spectrum-C of Figure 6.4 along with in the Spectra-B & C of Figure 6.3. It is rather interesting to notice that these particular spectra presented in both of the Figures 6.3 & 6.4 are pertaining to mixtures & controls that were subjected to the 28 days of hydration process. The emergence of this same peak can be first seen in the Spectra-B & C (absent in Spectrum-A) of Figures 6.1 & 6.2 are pertaining to mixtures of MC & SD that were subjected to the 3 & 7 days of hydration process with increased peak intensity for SD (Spectrum-C) in comparison to that of MC (Spectrum-B). The water region indicates a decrease in the intensity of the metal bonded hydroxide at 3642 cm-1 and increase in the content of the water molecules of the cement-pozzolan spectrum compared to that of the control (Spectrum-A). The reduction in the calcium hydroxide content indicates that the pozzolanic reaction has occurred by the 7th day (and continued till 28th day) which allowed the pozzolan to take up a portion of the portlandite (Ca(OH)2) in cement during hydration. The absorption bands at 1470 cm-1 & 1417 cm-1 show the persistence of carbonate-based compounds within the two binder pastes after 7 days of curing. The carbonate compounds which could be CaCO3 is high as indicated by its intensity on the Spectra-B & C compared to that of the Spectrum-A. Similarly, the vibrational frequency of Si-O-Si/Al due to CSH or CASH at 953 cm-1 with increasing intensity in the Spectra-B & C than that of the Spectrum-A indicate a high condensation of silicate/aluminate phases which can explain the high compressive strength value. The analysis of vibrational spectra of the hydrated pastes of PC & PC-pozzolan mixture pastes at various timelines clearly indicate the formation of the compounds such as Ca(OH)2, H2O, CaCO3, Sulphate & CSH/CASH during the period of curing step as hydration process and pozzolanic reaction progress along with a more condensed silicate environment supporting the reason behind the enhanced strength performance of the mixtures than the controls.
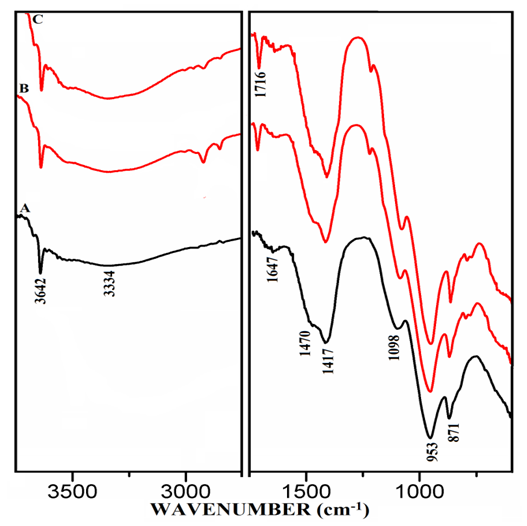 | Figure 6.1. FT-IR of Hydrated Mixtures of [PC & CC with 2% MC & 20% SD] at 3 Days. A) HPC20Control800, B) H[PC20Control800 + 2% MC], C) H[PC20Control800 + 20% SD] |
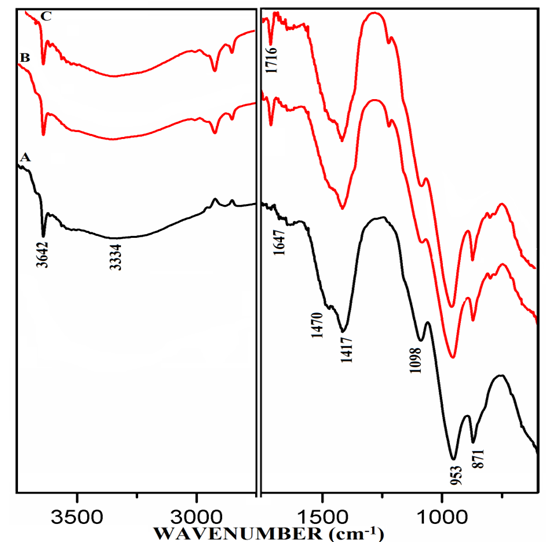 | Figure 6.2. FT-IR of Hydrated Mixtures of [PC & CC with 2% MC & 20% SD] at 7 Days. A) HPC20Control800, B) H[PC20Control800 + 2% MC], C) H[PC20Control800 + 20% SD] |
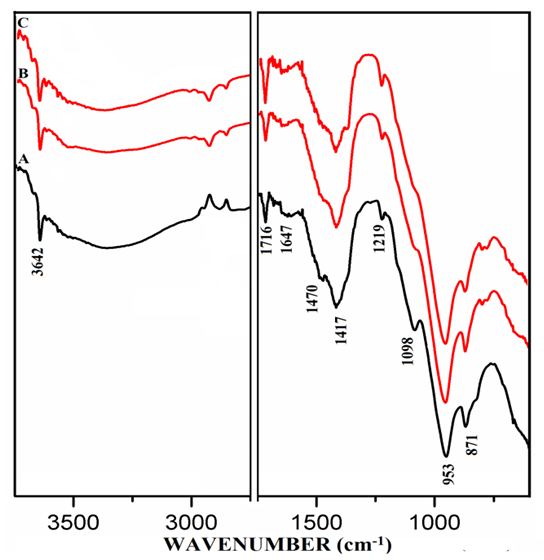 | Figure 6.3. FT-IR of Hydrated Mixtures of [PC & CC with 2% MC & 20% SD] at 28 Days. A) HPC20Control800, B) H[PC20Control800 + 2% MC], C) H[PC20Control800 + 20% SD] |
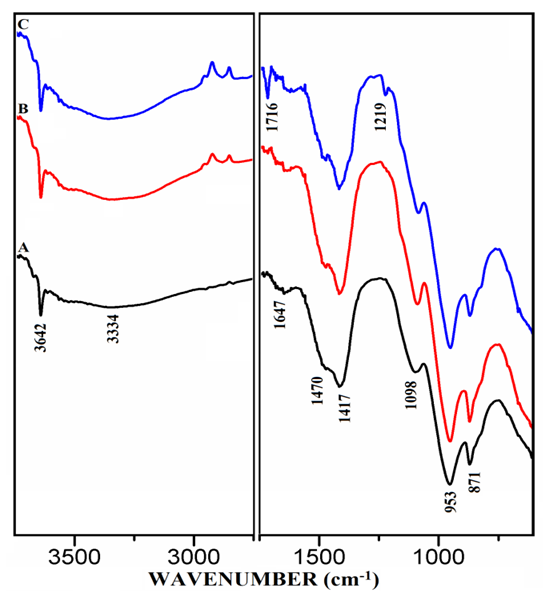 | Figure 6.4. FT-IR of Hydrated Control Mixtures of [PC & CC] i.e. HPC20 Control800 at 3, 7, 28 Days. A) 3 Days, B) 7 Days, C) 28 Days |
6. Conclusions
- The use of co-fired clays; grounded and mixed with limestone to produce materials for construction, pre-dates the global industrial revolution. The post industrial revolution era has also witnessed major advancements regarding the use of calcined clays as a material that can partially replace the cement. Many developing nations around the world such as African and Asian countries lacking ample amounts of commonly used supplementary cementitious material (SCM) but rich in clay minerals can provide a sustainable alternative with regards to SCMs application. This in turn can benefit the developed nations such as USA, Canada & Western European countries as the demand for concrete continually increases. The anticipated surge in the demand of Portland cement due to the population growth and subsequent urbanization are bound to result in an increased concentrations of CO2 and other greenhouse gases emitted from the cement & concrete industry. Calcined clay minerals utilized as SCMs will considerably reduce the harmful anthropogenic gases contributed by conventional cement manufacturing plants along with our dependence on natural resources for cement production and the associated cost. This particular study delivered a crucial information to the scientific community on the phase transformation, strength performance and their relation with pozzolanic activity to best understand the potential of this abundant resource to alleviate the burden of supplying cement. The current state of the art spectroscopic techniques such as SS-NMR & FT-IR provided insight in understanding, modelling & predicting the compositional & structural aspects of PC blended with both anhydrous & hydrated solid phase mixtures of Ghanaian clay and maize cob & saw dust calcined at 800°C. The spectral data made it evident that the incorporation of naturally occurring bio-waste material along with the CC certainly added more strength to the PC through improved bonding within the mixture and this trend is more substantial in the case of blends with SD in comparison to that of MC. Thus accordingly the mechanisms controlling the physical properties of cements can now also be thoroughly understood at an unprecedented level of details. An advancement in the understanding of various properties of cementitious materials can be achieved by investigating more of the relevant NMR active nuclei such as 1H, 13C, 17O, 19F, 23Na, 25Mg, 27Al, 29Si, 31P, 33S, 35Cl, 39K & 43Ca.
ACKNOWLEDGEMENTS
- The SS-NMR & FT-IR experiments of an interdepartmental collaborative translational research presented herein were conducted at the Department of Chemistry, University of Missouri Kansas City (UMKC). The author of this manuscript who is responsible for conducting the quantitative analysis and structural determination of anhydrous & hydrated calcined clay-cement mixture using 27Al & 29Si solid-state Nuclear Magnetic Resonance (NMR) spectroscopy and Fourier Transform-Infrared (FT-IR) spectroscopy experiments; cordially appreciates the previous research work contributed by Dr. Mark Bediako of CSIR-Building & Road Research Institute, Ghana and Prof. John T. Kevern of Department of Civil-Mechanical Engineering, UMKC which are responsible for the heat treatment by pyrolysis, hydration process & Thermo Gravimetric Analysis (TGA) of the calcined clay-cement mixture. The author of this manuscript is also immensely grateful to Prof. Nathan A. Oyler of Department of Chemistry, UMKC for his invaluable guidance.