-
Paper Information
- Paper Submission
-
Journal Information
- About This Journal
- Editorial Board
- Current Issue
- Archive
- Author Guidelines
- Contact Us
American Journal of Chemistry
p-ISSN: 2165-8749 e-ISSN: 2165-8781
2022; 12(4): 76-84
doi:10.5923/j.chemistry.20221204.03
Received: Sep. 12, 2022; Accepted: Sep. 25, 2022; Published: Sep. 28, 2022

Physicochemical Studies of Tiger Nut Oil Incorporation in Cosmetic Products Formulation (Face Cream, Body Lotion, and Soap)
 Abstract
 Reference
 Full-Text PDF
 Full-text HTML
Bou Ndiaye1, 2, 3, El Hadj Moussa Diop1, 3, Mouhamed Ndoye1, Oumar Ibn Khatab Cisse1, 2, 4, Binta Fall3, Seyni Ndiaye1, 2, Nicolas C. M. Ayessou1, 2
1Laboratoire Eau, Energie, Environnement et Procédés Industriel (LE3PI), Ecole Supérieure Polytechnique / Université Cheikh Anta Diop, Dakar, Sénégal
2Center for Studies on Food Safety and Functional Molecules (CESAM-RESCIF) ESP-UCAD, Dakar, Senegal
3Ecole Supérieure de Génie Industriel et Biologique (ESGIB), Dakar, Senegal
4Ecole Nationale Superieure d’Agriculture (ENSA), UIDT, Thies, Senegal
Correspondence to: Bou Ndiaye, Laboratoire Eau, Energie, Environnement et Procédés Industriel (LE3PI), Ecole Supérieure Polytechnique / Université Cheikh Anta Diop, Dakar, Sénégal.
| Email: |  |
Copyright © 2022 The Author(s). Published by Scientific & Academic Publishing.
This work is licensed under the Creative Commons Attribution International License (CC BY).
http://creativecommons.org/licenses/by/4.0/

Tiger nut (Cyprus esculentus) is an underused crop that has longtime been focused in the food field either by consuming the flour, milk, or tubers directly. Tiger nut has a very nutritional oil which is rich in unsaturated fatty acid and bioactive compounds. Thus, the use of tiger nut oil on the skin can be beneficial due to its antioxidant, healing, and regenerative properties. Its use in cosmetics should be consider. The aim of this present study is to develop cosmetic products based on this oil. The tiger oil is used in combination with Balanites aegyptiaca and Moringa oleifera seed oils. The analysis reveals that a specific gravity, acid value, peroxide value, and saponification value range respectively from 0.85 to 0.90; 2.24 to 23.79 meq O2/kg; 5.40 to 7.10 mg KOH/g, and 192.84 to 202.66 mg KOH/g. The refractive index is 1.465 for all oils. Color analysis shows a significant difference between oils. The saponification value shows that the oils are good materials for soap processing. The analysis of the soaps shows a pH ranging between 9.92 and 10.29. The moisture content, free alkalinity, and foam heigh range respectively from 9.99 to 11.85%; 0.022 0.040%; 16.25 to 18.50 9.92 cm. They have a higher foaming power compared to the reference soap. The melting temperature is 150°C for all soap samples. The soaps resulting from this preparation are hard and are resistant to the solubilizing action of water. Formulations made with more tiger nut oil (SF2 and SF3) are the most adapted. The analysis of creams and lotions shows densities within the standards. The monitoring of the pH of lotion and cream shows values ranging from 4.43 and 5.10. The sensory analysis shows that formulation LF2 for lotion and CF2 for creams are the most appreciated. The results obtained in this study show that all the oils are suitable for cosmetic production. Thus, the results of the analysis show that tiger nut oil is a good material for cosmetic products.
Keywords: Vegetable oil, Tiger nut oil, Soap, Lotion, Cream
Cite this paper: Bou Ndiaye, El Hadj Moussa Diop, Mouhamed Ndoye, Oumar Ibn Khatab Cisse, Binta Fall, Seyni Ndiaye, Nicolas C. M. Ayessou, Physicochemical Studies of Tiger Nut Oil Incorporation in Cosmetic Products Formulation (Face Cream, Body Lotion, and Soap), American Journal of Chemistry, Vol. 12 No. 4, 2022, pp. 76-84. doi: 10.5923/j.chemistry.20221204.03.
Article Outline
1. Introduction
- Seeds such as peanut, soybean, rapeseed, sunflower and palm, coconut, olive and argan nuts are the main sources of vegetable oils most traded in the world [1], [2], [3]. Oil demand is constantly increasing, hence the use of non-conventional oil-producing plant species to find alternative sources of lipids with better nutritional value as well as to improve commercial application [4] [5] [6]. Beyond their inclusion in food preparation, the important presence of bioactive compounds could direct their use in cosmetics. Indeed, the use of natural products such as seed oils for skin application is known for a long time [7]. Plant oils have important pharmacological properties, which have gained ground in the pharmaceutical field [8]. The demand for natural or organic cosmetic products in the community has become a fundamental need, especially with the harmful consequences that chemical cosmetics have on human skin as well as on the environment. The current trend of replacing synthetic products in the cosmetic and pharmaceutical industry is becoming more and more important [9]. As a result, non-conventional vegetable oils from oilseeds have the potential to become the main raw materials for the production of cosmetics. Vegetable oils are good sources of bioactive compounds including unsaturated fatty acids and antioxidants (phenolic compounds, vitamins A and E…) [10] [11] [12] [13] [14]. Depending on the presence of numerous substances, vegetable oils can help fight several human pathologies [15], [16], [17], [18]. Thus, in order to follow the evolution of organic cosmetics, it would be interesting to exploit Senegalese vegetable oils as the main raw material. The Senegalese flora is known for its richness in plants providing oil seeds [19], [20], [21]. Among these seeds, the use of certain plants in cosmetics has been experimented notably moringa and balanites. Known as Moringa oleifera, the plant produces seeds that are a good source of fat with high levels of vitamin E [9], [12], [22]. Moringa oil has also been a part of folk medicine for thousands of years. In the past, it was used as a perfume and skin lotion by the Egyptians, Romans and Greeks [7]. Moringa oleifera seed oil possesses a skin protecting effect and was suggested to maintain the natural skin pigmentation as it possesses a mild sun protective activity [23]. Balanites aegytiaca is an abundant plant in the south of Saharan Africa. It is a source of fats used by some populations in agri-food and in the production of cosmetics [3], [24]. Tiger nut (Cyperus esculentus) present an oil rich in unsaturated fatty acids and fat-soluble vitamins [25], [26], [27], [14]. The use of tiger nut has long been focused in the food field either by consuming the flour, milk or tubers directly [27], [28]. The application of tiger nut oil on the skin could be beneficial due to the presence of numerous components which have antioxidant, healing, and regenerator effect. The objective of this work is to study tiger nut oil effect in cosmetic products.
2. Material and Methods
2.1. Material
- For the conception of the products, we used as biological material: tiger nut oil, coconut oil, Moringa olifera seed oil and Balanites aegyptiaca seed oil, shea and mango butter. The production of cream required the use of tiger nut, moringa and Balanites oils and shea butter. The body lotion is made from tiger nut, balanites and moringa oils and mango butter. The soaps are made from tiger nut and coconut oils and shea butter. The oils are purchased from approved distributors.
2.2. Methods
2.2.1. Lotion and Cream and Production Method
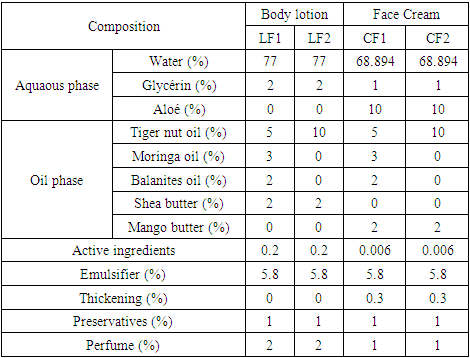
- Lotion and cream are obtained from an oil-in-water (O/W) emulsion using a stirrer and made according to precautions such as the respect of the temperature, operating mode and agitation. The oil and water phases are mixed at a temperature of 70°C under a stirring of 600 rpm. After cooling, the production is stored in bottles. The composition of each formulation is established in Table 1.
|
2.2.2. Soap Production Method
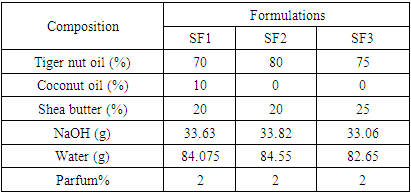
- The oil phase is composed of tiger nuts, coconut oil, and shea butter. The caustic solution is prepared by calculating the mass of soda needed to saponify the oils and deducting the mass of water to dissolve the soda. The mass of sodium hydroxide pellets used is equal to the sum of the masses of the various fats to saponify multiplied by their saponification index. An overgreasing of 5% was made by multiplying the mass of sodium hydroxide pellets obtained by 95%. This gives the final mass of sodium hydroxide pellets. This mass of final NaOH was multiplied by 2.5 to obtain the mass of water necessary for its dissolution. The saponification was carried out cold. The composition of each formulation is shown in Table 2.
|
2.3. Analysis Method
2.3.1. Oil Caracteristics
- The peroxide value was determined by titrimetric methods using NE 2658-91standard method. Acid value was evaluated with AFNOR NFT 60-204. According to the method NFT 60-206, saponification value here determined. The refractive index was measured with a refractometer (CONVEX N° 042952, CETI-BELGIUM). A colorimeter (CM-5, Konica Minolta, Japon) was used to determine color parameters (L*, a*, b*) of the different oils. Specific Gravity : The specific gravity (SG) of the oil was determined according to the method described by Zand et al [3] with little modifications. The weight of 50 mL empty flask (wo) was taken and recorded. The test tube was first filled with water (w1), weighed and recorded. After drying, an equivalent quantity of oil was replaced with the water in the same test tube and weighed (w2). The specific density of the oil was determined as follows:

2.3.2. Soap Analysis
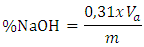
- pH analysis: The pH of the sample was determined using pH-meter (FI24-2). 2g of the sample was weighed into a flask and then 50 mL of distilled water was added and agitated to dissolve the sample. The electrodes were placed in the sample solution then pH was recorded [29].Free Caustic alcali : soap sample (5g) were digested in freshly boiled ethanol (30 mL) on steam bath until the soap sample was dissolved. This was followed by the addition of about 5 drops of phenolphthalein indicator and 5 mL of BaCl2 (20%). The resultant solution was titrated against H2SO4 (0.05 M), to the disappearance of pink [3] The total free alkali is calculated using the relationship weight (g) of:
 Va: acid volume and m: soap mass Foam capacity: About 2.0g of the soap (shavings) was added to a 100 ml measuring cylinder containing 50 mL of distilled water. The mixture was shaken vigorously so as to generate foams. After shaking for about 2 minutes, the cylinder was allowed to stand for about 10 minutes. The height of the foam in the solution was measured and recorded [29].Foam capacity test in HCl and in NaCl solutions: A soap solution is prepared by dissolving 3 g of soap in 100 ml of distilled water in a screw tube, adding dropwise 1 ml of a hydrochloric acid solution (1mmol/l) to 2 ml of the soap solution. The tube is tightly closed and shaken vigorously in a horizontal position for about 15 seconds. After 5 min at rest, the height of the foam is measured. In a screw tube, 1 ml of a saline solution of NaCl (30%) is added dropwise to 2 ml of soap solution. The tube is capped and shaken vigorously in a horizontal position for about 15 seconds. After 5 min of rest, the height of the foam is measured [30].Moisture content: water content was determined by gravimetric method. 2.0 g of samples were taken in dried and tarred moisture dish and dried in an oven at 105°C for 4 hours. It was cooled in a desiccator and weighed. Solubility test: A volume of 100 cm3 of distilled water was added to 5.0g of soap in a beaker. The solution was left for a moment and the time taken for complete dissolution was recorded.
2.3.3. Sensory Analysis of the Lotions and Creams
- Body lotions and face creams produced were subjected to a sensory evaluation by a group of 20 randomly selected people, consisting of 6 men and 14 women. The products were evaluated on the following criteria: hydration, penetration, greasiness. These different criteria were chosen by preference for each tester. For each product, lotion (LF1 and LF2) and cream CF1 and CF2), the two formulations were applied at the same time by the testers who then gave their appreciation a few minutes later. These appreciations are noted according to the chosen criterion from "more pleasant" to "less pleasant".
2.3.4. Processing of Statistical Data
- The analysis of variance (ANOVA) is performed using Statistica version 7.1 software. The level of significance of the results is taken at the probability p<0.05.
3. Results and Discussion
3.1. Oil Characteristics
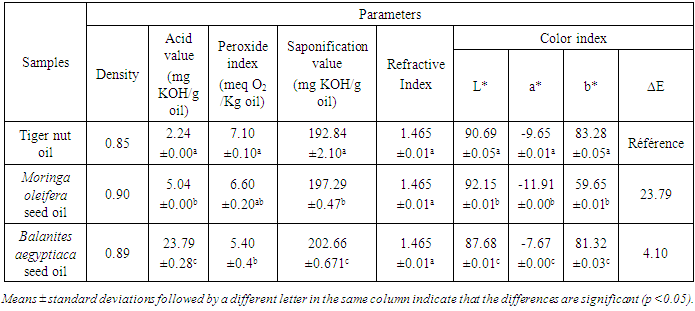
- The quality parameters of the oils used in this study are established in Table 3. They concern density, acid, peroxide, saponification and refraction indices.
|
3.1.1. Specific Gravity
- The densities of the different oil samples are respectively 0.85, 0.89 and 0.90 for tiger nut, Balanites and Moringa oils. This value found in tiger nut is lower than those found by Adel et al. (2015) [31], which range from 0.89 to 0.92. The specific gravity value in moringa is higher than the result of Hanna et al. [12], which is 0.82. The values are slightly higher than those obtained by Uzair et al. [32] in moringa oil which are 0.876 and 0.88 in different processing extraction. Balanites oil density is similar of the of Zang et al. (2018) [3] which are 0.90. A high value of 0.95 is obseved in Balanites oil [33].
3.1.2. Peroxide Value
- Peroxide value is a very useful criterion to appreciate the first stages of oxidative deterioration of an oil [12]. The peroxide value determined for tiger nut, Moringa and Balanites oils are respectively 5.40, 6.60 and 7.10 meq O2/Kg. Analysis of variance shows that the peroxide value of tiger nut and moringa oils are statistically different (p<0.05). The work of Adel et al. [31] reveals lower peroxide value ranging from 0.79 to 1.52 meq O2/Kg on different types of tiger nut oils studied. However, the peroxide value of tiger nut oil is lower than the results of Awulu, et al. (2018) [34], which range from 7.63 to 9.95 meq O2/Kg. The study of zang et al. [3] revealed a peroxide value 2.95 mEq/kg in Balanites aegyptiaca oil. The noticed peroxide value in moringa was is higher than the 0.01 meq O2/kg oil reported by El Beky et al. [12]. Lower peroxide values were found in moringa oil, which range from 0.36 to 1.80 meq O2/kg of oil obtained in different extraction method [14]. The peroxide indices from these analyses are lower than the maximum allowable value 10 meq O2/Kg prescribed by the Codex Alimentarius Standards [35].
3.1.3. Acid Value
- The oil acidity gives information on its free fatty acid content. It evolves according to the duration and the mode of conservation of the oil. The acid values are 2.24, 5.05 and 23.80 mg KOH/g respectively for tiger nut, moringa and Balanites oils. The analysis of variance shows that the acid indices are significantly different (p<0.05) for all samples. It was found that only tiger nut oil complies with the limits established by CODEX STAN 210-1999 [36] which are 0.6 and 4.0 mg KOH/g oil respectively for refined and cold pressed oils. The acid value of Balanites aegyptiaca oil is higher than the result of Zang et al., [3] which was 2.14 ± 0.28 mg KOH/g and the result of Diedhiou et al. [22]. The acid value found by Hanna et al., [12] was 0.02 mg KOH/g in moringa oil. The elevated acid value observed in Balanites oil could be due to the hydrolysis of triacylglycerides caused by the high water content. Lower value of 0.84 mg KOH/g oil is observed in moringa seed oil [37]. The study of Ogbunugafor et al. [38] shows an acid value of 3.8 mg KOH/g of moringa oil. In fact, the oxidation reaction is so rapid that the formation of secondary compounds takes precedence over the hydroperoxides. This could explain the low peroxide value observed while the acid value is very high.
3.1.4. Saponification Value
- The analytical results reveal a saponification value of 192.84 mg KOH/g oil in tiger nut. This result is identical to the one observed in the work of El-Naggar [25], which is 192.88 mg KOH/g oil. The values observed for the physicochemical properties were significantly in favor of using the tiger oil for soap production. Saponification value of Moringa oleifera seed oil in this study is higher than those found by Hanaa et al., (2013) [12] and SURYADEVARA et al. [37] which is 179 and 152.14 mg KOH/g of oil respectively. Saponification value of Balanites aegyptiaca seed oil is 202.66. The study of Kaoke et al. [40] shows a saponification values of the B. aegyptiaca kernel oil ranging between 123.6 and 139.5 mg KOH/g. A saponification value of 182.2 mg KOH/g is observed in the study of Diedhiou et al. [22].
3.1.5. Refraction Index
- The analyses reveal equal refractive indices, the value found is 1.465. This value is similar to those observed in tiger nut oil samples obtained under different conditions 1.464-1.465 [31]. In the study of Ahmed and Eid (2015) [33], results reveal that Balanites oil had a refractive index of 1.4699. Balanites aegyptiaca seed oil refraction index value is lower than the results of the refractive index of the sampling of Balanites aegyptiaca kernel seed oil in North Cameroon, wich vary between 1.471 and 1.476 [40]. Refraction index value is higher than the observed refraction values in moringa oil seed obtained in different extraction method which range from 1.4549 to 1.4591 [14]. The study of Ogbunugafor et al. (2011) [38] shows a refractive index of 1.4713 in moringa oil.
3.1.6. Color Parameters
- The color parameters of the vegetable oils are presented in the table 3. A highly significant difference (p≤0.05) was observed in the color characteristics of the three types of oils. Thus, the luminosity (L*) value of moringa oil followed by tiger nut and Balanites oil respectively. This indicates that Moringa oil is whiter than the other oils. The results of color measurement showed that color index (L* and b*) were positive values. On the other hand, the yellow index (b*) is higher in tiger nut oil. It is deduced that tiger nut oil is more yellow than the other oils. Balanites oil, given its a* values, proves the nature of its dark yellow color. This difference in color between the three types of oils could be due to the extraction method but also to the presence of colored compounds in the oils such as carotenoids. The ∆E Cosmetics less than 1.0 indicated an unnoticeable difference of two colors [23]. This result suggests that tiger nut oil has a consistent yellow color. The evaluation of the color difference shows a significant difference which confirms the previous results.
3.2. Soap Analysis
- After drying, the soaps formulation (SF1, SF2 and SF3) obtained from different formulations are shown in Figure 1. The results of physicochemical analysis are reported in Table 4.
|
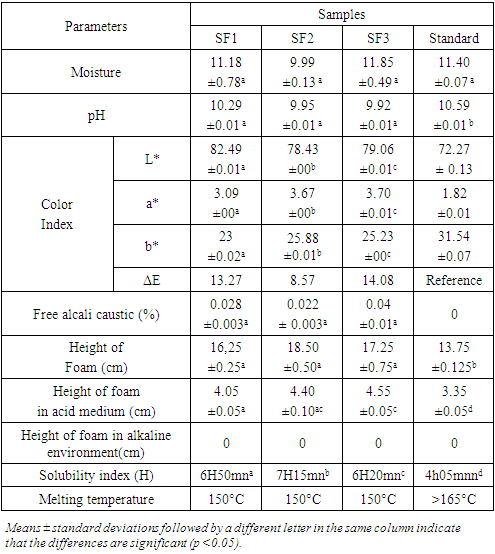
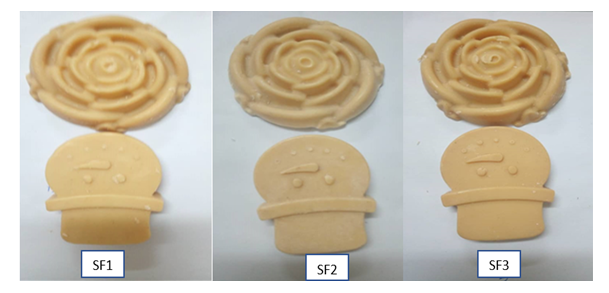 | Figure 1. Soap samples |
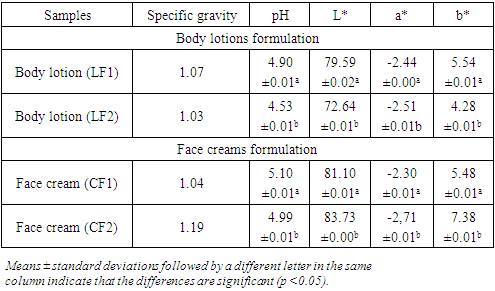
3.3. Lotions and Creams Analysis
- The parameters studied for lotions and creams are specific gravity, pH and color parameters (L*, a*, b*) are stablished in table 5.
|
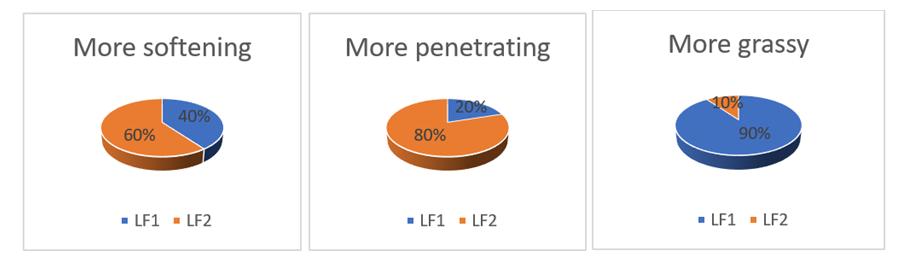 | Figure 2. Sensory criteria curve of body lotions (LF1 and LF2) |
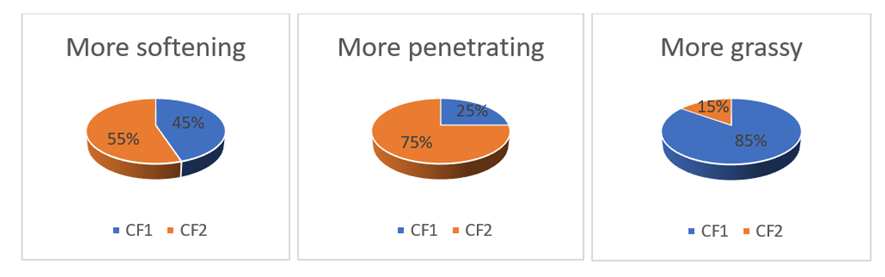 | Figure 3. Sensory criteria curve of face creams (CF1 and CF2) |
4. Conclusions
- The objective of this work was to study the effect of tiger nut oil incorporation in cosmetic products. The physicochemical tests carried out on the oils show that they are suitable for cosmetic production. Soap made with high proportion of tiger oil show the best physicochemical proprieties. It can be noted a preference for the formulation SF2 which contains more tiger nut oil. The physical analyses carried out on and lotions and creams show that they respect the cosmetological standards and can be applied to the skin. Sensory tests carried on lotions and cream show a preference for the formulation LF2 and CF2 for lotion and creams respectively. Considering the results obtained it can be deduced that tiger nut is good material for cosmetic products. Further analysis is required in order to study the oxidative stability of lotions and creams.
 2020.
2020. 2020.
2020.