-
Paper Information
- Paper Submission
-
Journal Information
- About This Journal
- Editorial Board
- Current Issue
- Archive
- Author Guidelines
- Contact Us
American Journal of Chemistry
p-ISSN: 2165-8749 e-ISSN: 2165-8781
2022; 12(1): 1-9
doi:10.5923/j.chemistry.20221201.01
Received: Nov. 30, 2021; Accepted: Dec. 29, 2021; Published: Jan. 13, 2022

Optimization of Methylene Blue Adsorption onto Activated Carbon from Bos Indicus Gudali Bones Using a Box Behnken Experimental Design
 Abstract
 Reference
 Full-Text PDF
 Full-text HTML
Domga Richard1, Abia Daouda2, Mouthe Anombogo Ghislain Arnaud3, Musongo Balike4, Domga1, Wangmene Bagamla5, Tchatchueng Jean Bosco1
1Department of Applied Chemistry, National Advanced School of Agro- Industrial Sciences ENSAI, University of Ngaoundere, Cameroon
2Department of Chemistry, Faculty of Sciences, University of Ngaoundere, Cameroon
3Department of Environmental Sciences, National Advanced School of Engineering (ENSPM), University of Maroua, Cameroon
4Department of Chemical Engineering, School of Chemical Engineering and Mineral Industries, University of Ngaoundere, Cameroon
5Department of Chemistry, Faculty of Science, University of Maroua, Cameroon
Correspondence to: Domga Richard, Department of Applied Chemistry, National Advanced School of Agro- Industrial Sciences ENSAI, University of Ngaoundere, Cameroon.
| Email: |  |
Copyright © 2022 The Author(s). Published by Scientific & Academic Publishing.
This work is licensed under the Creative Commons Attribution International License (CC BY).
http://creativecommons.org/licenses/by/4.0/

A phosphoric acid activated adsorbent produced from Bos Gudali Indicus bones (BGIB) was used for Methylene Blue adsorption in aqueous solution. Adsorption performances were assessed using a Box Behnken Experimental Design (BBED). Three fundamental parameters were investigated: adsorbent mass, initial dye concentration and temperature while a pH at 5 was considered from passed studied as convenient. The amount of adsorbed Methylene Blue regards the responses was used for modeling and optimization. From obtained result, it appeared that Methylene blue adsorption was significantly affected by singular and quadratic interaction effects of temperature, adsorbent mass and initial dye concentration. Optimal adsorbed dye amount of 15.08 mg.g-1 was achieved with an initial concentration of 45 mg.L-1, a temperature of 45°C, and adsorbent mass of 0.2 g. Statistical analysis were performed using analysis of variances (ANOVA) and R2 = 98.99 lack of fit adequacy which gave good interpretation of different interactions of experimental parameters, with highly significant with confidential level > 99%. It was then observed that, when adsorbent mass increases, temperature and initial dye concentration decrease considerably. The quadratic effect of adsorbent mass is 5 times greater than adsorbent mass while decreasing when the first one is increasing.
Keywords: Box-Behnken Experimental Design, Methylene Blue, Adsorption Modeling and Optimization
Cite this paper: Domga Richard, Abia Daouda, Mouthe Anombogo Ghislain Arnaud, Musongo Balike, Domga, Wangmene Bagamla, Tchatchueng Jean Bosco, Optimization of Methylene Blue Adsorption onto Activated Carbon from Bos Indicus Gudali Bones Using a Box Behnken Experimental Design, American Journal of Chemistry, Vol. 12 No. 1, 2022, pp. 1-9. doi: 10.5923/j.chemistry.20221201.01.
Article Outline
1. Introduction
- Many interesting organic molecules where developed and produced by chemical industries all over the 20th century. These molecules are used in many fields as medicine, agriculture, chemistry and chemical formulation (ref). Some of these molecules are called "micropollutants" because they present known or suspected harmful effects even at low concentrations (Halling-Sorensen et al., 1998). However, in recent years, recently, scientific community paid particular attention to micropollutants mainly on their occurrence and their fate in the environment. These molecules include formulation additives, hormones, metabolites, pharmaceutical residues and organic dyes (Deblonde et al., 2011; Murray et al., 2010). Organic dyes are commonly used in many industrial activities such as dyeing leather, paper, textiles, wood, silk, plastics, as well as in the cosmetic, food and pharmaceutical industries. Among these organic dyes is methylene blue (Domga et al., 2015).Methylene blue is one of the most widely used dyes for dyeing many substrates, including silk, cotton, and wood, and for temporarily coloring paper ref. It is used as a colored redox indicator, histological dye, antiseptic in the treatment of superficial wounds (Atef, 2009). Maurya et al (2008), and Vanessa et al. (2017) reported that organic dyes damages human health; some dyes are carcinogenic, mutagenic and teratogenic and can cause several conditions such as nausea, hemorrhoids, ulcers of the skin and mucous membranes, severe irritation of the respiratory system. Madhura et al (2014) indicated that wastewater from processes using organic dyes has high BOD and COD. Their elimination calls for appropriate methods (Zidane et al., 2011).Removal of organic dyes as well as organic or inorganic pollutants from wastewater is necessary. Many water treatment processes have been developed for the reduction and elimination of pollutant load from organic dyes in wastewater, including biological, chemical and physical methods. These methods include, among others, flocculation, precipitation, membrane filtration, ion exchange, ozonation, irradiation and adsorption (Kifuani et al., 2004; Hameed et al., 2007; Li et al., 2009; Muswema et al., 2010; Sun et al., 2012; Balogoun et al., 2015; Kassale et al., 2015; Berradi et al., 2016; Ousmaila et al., 2016; Oliveira et al., 2017). Most of these methods are expensive, require a lot of energy, produce huge quantities of sludge or generate derivatives that sometimes are more toxic than the initial products (Masson, 2015; Tchuifon, 2015). Among water polluted (organic dyes) treatment processes, adsorption is found to be the most efficient (Ertaş et al., 2010; Yao and Kouassi, 2015). Activated carbon is one of the most widely used adsorbents (Sark et al., 2015), but the high cost production remains a challenge. However, Several works are being carried for the preparation of low-cost adsorbent using inexpensive precursor, available locally from renewable natural sources, such as agro-industrial waste (Arivoli et al., 2009; Kazlauskieni et al., 2009; Li et al., 2009; Laximi and Ahmazzaman, 2010). To study the adsorption process, several parameters can be followed and the experimentation should be repeated for each parameter. To solve this problem, it is necessary to reduce the number of experiments to be carried out without losing the quality of the results sought. The use of experimental design method gives a strategy in the choice of experimental methods. Their success in research and industry is linked to need of competitiveness, improvement in quality and a low-costs (Domga et al., 2015; Domga et al., 2016; Domga et al., 2018). There are two approaches for this: The first is a classic intuitive application that consists of setting the level of all but one factor, then repeating the procedure until the last factor (Dejaegher et al., 2011). This method does not allow to study the evolution of the system compared to the variation of a single factor: mathematical model is impossible to adjust. The second is a multivariate approach which consists in variating several factors simultaneously. This approach is subdivided into sequential and simultaneous approaches (Massart et al., 1997. Vander Heyden et al., 2000). The sequential approach consists of carrying out some initial experiments and uses their results to define experiments (Dejaegher and Vander Heyden, 2009). This approach can be applied when the experimental domain contains an unknown optimum. The simultaneous approach gives a representation of the predefined number of experiments, according to a precise experimental organization as an experimental design (Montgomery, 1997; Dejaegher and Vander Heyden, 2009; Dejaegher et al., 2010).Experimental design method is introduced mainly to evaluate several factors simultaneously and to predict interactions between factors, hence the choice of modeling designs or response surfaces mainly on the Box-Behnken model. The latter is from the three large families of design of experiments with the mixing and screening designs (Dejaegher et al., 2011; Cobas et al., 2014). Experimental technical design is a very tool for this purpose, as it provides statistical models which help in understanding the interactions among the parameters that have been optimized. Another important advantage of the use of statistical models in optimization processes is the requirement of very small number of experiments and therefore minimizes time required to carry out the experiments, also minimizes the amount of chemicals, glassware, and manpower needed (Cobas et al., 2011; Dejaegher et al., 2011). In contrast to the classical optimization processes, which did not account the effect of different combination of parameters, response surface methodology (RSM) provides elaborative vision over various combinations of parameters. RSM is essentially a particular set of mathematical and statistical methods for designing experiments, building models, evaluating the effects of variables, and searching optimum conditions of variables to predict targeted responses (Myers and Montgomery, 2002). RSM is an important tool to develop novel processes, optimizing their performance and improving their design and formulation of new products. RSM shows promising results in industrial research, especially where large number of variables influences the system (Myers and Montgomery, 2002). The adsorption capacity of the adsorbent was assess using a Box-Behnken Experimental Design (BBED).The Box-Behnken (BB) model therefore has the advantage of being less costly in terms of time (reduced number of tests) and resources to invest in experimentation. The BB model does not allow to test treatments for which all the factors are placed simultaneously at their high or low level. Box-Behnken matrix therefore minimizes the combinations located at the ends of the variation domain of the factors, where generally an unsatisfactory response (high or low response) is observed. This can be advantageous when points on the corners of the cube represent combinations of factor levels that are expensive or impossible to test due to physical constraints of the process (Nosrati et al., 2011; Cobas et al., 2011;Yazici and Deveci, 2013; Yazici and Deveci, 2013; Cobas et al., 2014). The present work interest is to develop a potential adsorbent for the adsorption of organic dyes using waste cattle’s (Bos Indicus Gudali) bones from the slaughterhouse of Dang (Ngaoundéré 3 sub-division) in Adamawa region. Almost 40% of these bones are released as waste into environment. Converting these bones into a potential adsorbent thus constitutes a way of recovering waste and cleaning up the environment. The adsorption performances of Gudali species (Bos Indicus) activated carbon bones was evaluated using an aqueous solution of methylene blue (BM). Several parameters influence this adsorption process, hence the need an experimental design. Hence, the aim of the present study was to optimize the adsorption of Methylene Blue using Response Surface Method: Box Behnken experimental design.
2. Material and Methods
2.1. Preparation of Activated Carbon
- Zebu cattle bones are degreased Gudali collected and thoroughly washed with distilled water and dried in an oven at 110°C for 24h, 200g Gudali bone were dried, milled and sieved (0.2-5mm) for 18 h and impregnated with a solution of phosphoric acid H3PO4 85%. Impregnated bones were washed with hot distilled water until neutral pH and dried at 110°C for 24h. Samples were then pyrolyzed during 2 h at 500°C. Pyrolysis was conducted in a muffle furnace Heraeus, MR model 260E with a heating rate of 5°C. min-1.
2.2. Preparation of Methylene Blue Solutions
- Methylene blue (MB) is a cationic dye with a molecular formula C16H18N3SCl (Figure 1) was purchased without any treatment from Merck. The dye stock solution was prepared by dissolving accurately weighted MB in distilled water. Experimental solutions were obtained by diluting MB in accurate proportions to required initial concentrations.
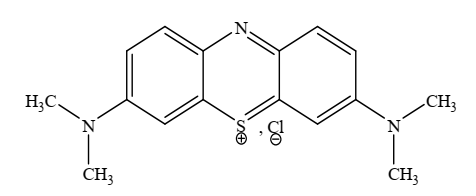 | Figure 1. Methylene blue molecule |
2.3. Determination of MB Concentration
- UV-visible spectrum of MB absorption was obtained by a spectral scan from 300 to 1100 nm, of a 10 ppm solution (Figure 2). This spectrum shows that the peak of absorption of is 664 nm. The concentrations of MB solution are obtained by measuring the absorbance at 664.5 nm by a spectrophotometer “Pharo 100”.
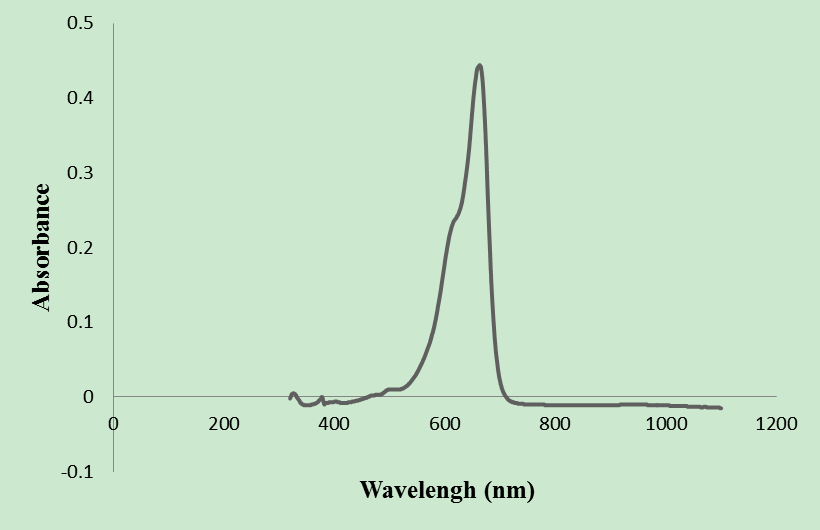 | Figure 2. Absorption spectrum of methylene blue |
2.4. Batch Equilibrium Adsorption Studies
- Adsorption studies were carried out at room temperature in a 250 mL reactor. For each experiment, dose of 0.2-0.6 g of adsorbent was weighed and put in reactors containing 50 mL of concentration ranging from 10-70 ppm, pH increasing from 3 to 11 (Domga et al., 2015). The mixture was subjected to magnetic stirring over the interval of time between 10 to 60 minutes, using a magnetic stirrer. The suspension was filtered and the residual concentration was determined by UV-visible spectrophotometry. Concentration of remaining MB in the solution was calculated by the difference of the initial and the final BM concentrations. The research work of Domga et al (2015) allows us to fix the most influential factors in this work.Dye removal efficiency was expressed as:
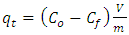 | (1) |
2.5. Response Surface Methodology (RSM)
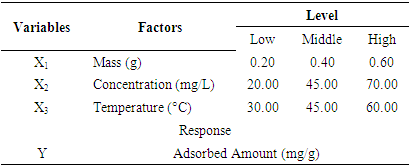
- A 3-factor 3-level factorial Box–Behnken experimental design (BBED) matrix was used to investigate the effects of selected parameters. BB designs are response surface methods (RSM), specially made to require only 3 levels, coded as −1, 0, and +1. BB designs are formed by combining two-level factorial designs with incomplete block designs that the geometry of this design suggests a sphere within the process space such that the surface of the sphere protrudes through each face with the surface of the sphere tangential to the midpoint of each edge of the space (Myers and Montgomery, 2002). This procedure creates designs with desirable statistical properties but, most importantly, with only a fraction of the experiments required for a three-level factorial (3k−p) designs. Since there are only three levels, the quadratic model is appropriate. Observations were fitted to a second order polynomial model as given below:
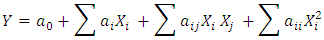 | (2) |
|
2.6. Statistical Analysis
- Regression analysis, statistical significance and response surfaces were obtained to find the most suitable combination of factors resulting in optimal Methylene Blue adsorption capacity of BGI. Statistical significance of variables was evaluated using Analysis of Variance (ANOVA). Constructed model adequacy was investigated via lack of fit, coefficient of determination (R2) and F-values. Statgraphics and sigma plot software packages were used for the regression, residual and graphical analyses.
3. Results and Discussion
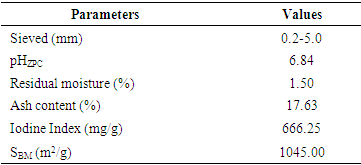
3.1. Textural Characteristics of the Adsorbent
- Table 2 shows the iodine value of 666.251 mg/g. This high value of iodine index makes it possible to conclude that adsorbent has micropores on its surface available to fix polluting micromolecules (Domga et al., 2016).Adsorbent specific surface (Table 2) shows a significant exchange surfaces reaching 1045 m2/g. This high value of the specific surface makes it possible to assume that this adsorbent complies with standards of adsorbents specific surface and it justifies good adsorbent capacity (Domga et al., 2018).
|
3.2. Development of Regression Model Equation for Methylene Blue Removal
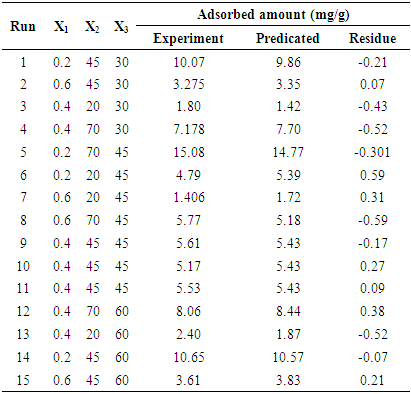
- The complete design matrix and values of both responses obtained from the experimental works are given in Table 3. BBED is a modeling technique used to evaluate correlation between experimental variables for MB adsorption and corresponding response of adsorbed dye quantity from aqueous solution. The second order polynomial equation fitted between responses represents adsorbed quantities (Y) and input variable of mass (X1), initial concentration of dye (X2) and temperature (X3). Empirical model for adsorption MB is given in Eq 3:
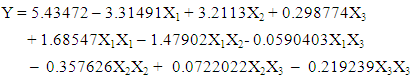 | (3) |
|
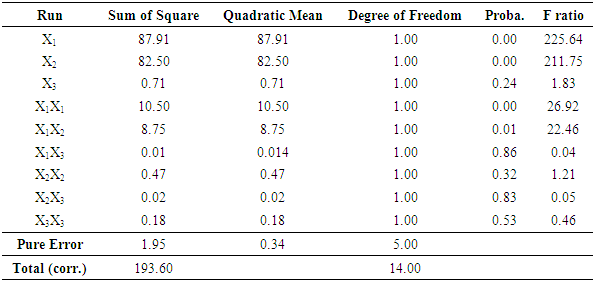
3.3. Analysis of Variance (ANOVA) BBED for Methylene Blue Uptake
- ANOVA of MB removal obtained in the study is presented in the Table 4. In general terms, ANOVA explains any variation in the statistically derived model and significance of the model parameters. Degrees of Freedom (DF), Sum of Squares (SS), quadratic mean standard deviation probability (P) and F ratio are calculated and tabulated in the ANOVA table. Normally, a lower P value of a model term in ANOVA indicates good significance of the term over others. In this study, the models obtained for MB dye removal were able to explain experimental results on color removal. Regression model, linear model and square model well fitted with 100% confidential level. The interaction of the parameter temperature, adsorbent mass and initial concentration of MB adsorption is also highly significant with confidential level > 95%. Figure 3 shows predicted versus actual plots for adsorbed amount, demonstrating that the values are distributed relatively near to the straight line. This indicates that models are adequate for predicting color removal efficiency within the range of studied variables. Test of lack of adequacy is used to determine if selected model can be used to describe experimental data or if another complicated one should be chosen. If probability for lack of fit is bigger than 0.05 there is evidence that quadratic linear regression model is more appropriate to explain parameters relationship on Methylene Blue adsorption. In the present study, probability of lack of fit is lower than that of pure errors sum of square and quadratic mean.
|
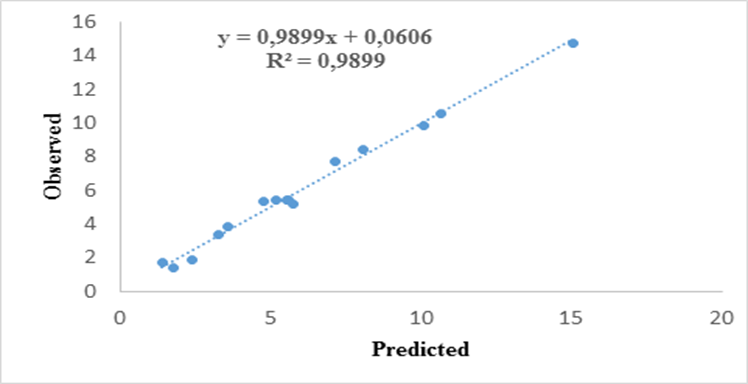 | Figure 3. Experimental vs. Predicted of Methylene Blue adsorbed |
3.4. Graphic Representation of Effects a. Pareto Chart
- This diagram (figure 4) makes it possible to extract the most important parameters. Among all the factors studied and at chosen confidence level (α = 0.05), concentration (B) appears to be the very influential factor. The temperature (C) can according to this same diagram have an effect on the answer. Mass (A) has no significant effect on response. The positive sign of each of the factors (B, C) indicates that the maximum value of these factors results in a higher response than with the minimum value. The factor (A) has a negative sign indicating that the minimum value of this factor results in a higher response. The quadratic factors have respectively a significant (AA) and insignificant (B, C) effect on the response, while the quadratic effects (AB) influence the response less. The quadratic effects (BB, CC, AC) influence the response less and less.
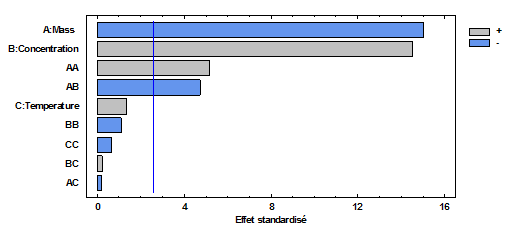 | Figure 4. Pareto plot of normalized effects |
3.5. Estimation of Quantitative Effects of the Factors
- Three dimensional surface responses obtained from second polynomial equations are shown in figures ranging from 5 to 10. Optimum values of variables were obtained as maximized response using RSM. The best response range is obtained by analyzing response surface plots and iso-responses curves. Combined effect of temperature, adsorbent mass, at constant initial dye concentration (45 mg.L-1) and pH (5), for MB adsorption from aqueous solution are made. Adsorbed quantity increased with increasing temperature and initial dye concentration. This is due to the increase in number of binding sites on adsorbent surface. It is clear from figures 5-10 that adsorbed amount decreases with increase of adsorbent mass from 0.2 to 0.6 g. It is also noted, that maximum adsorption at all temperature takes place at 0.20g. Maximum adsorbed amount (15.08 mg.g-1) was observed at constant temperature (45°C), initial dye concentration (45 mg.L-1) and pH (5).
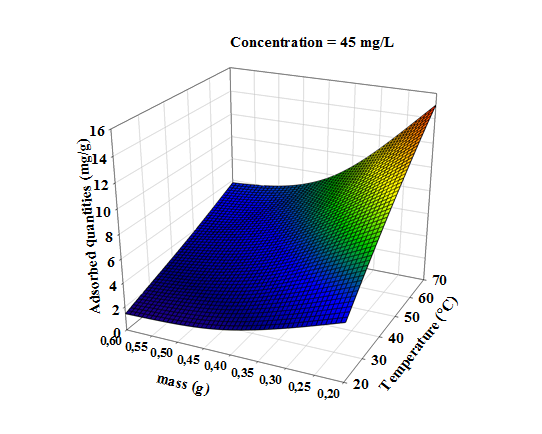 | Figure 5. Response surfaces of the effect of temperature and adsorbent dosage, on the adsorption of MB at constant initial concentration of dye (45 mg.L-1) and pH (5) |
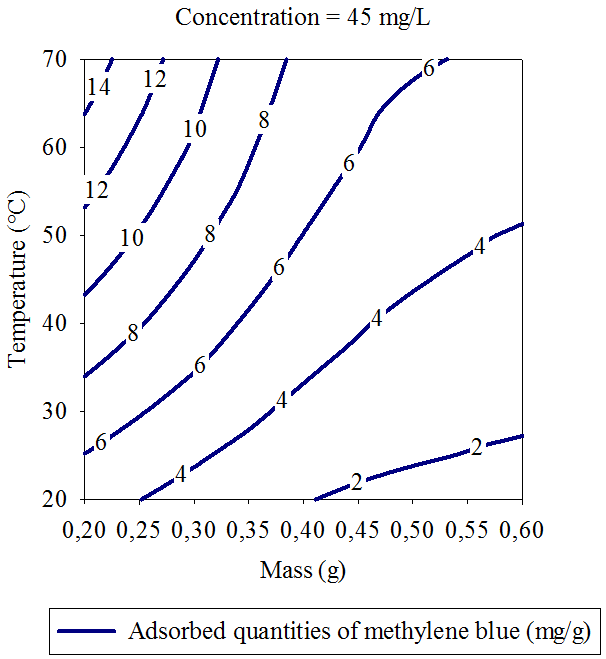 | Figure 6. Iso-response curves of the effect of temperature and adsorbent dosage, on the adsorption of MB at constant initial concentration of dye (45 mg.L-1) and pH (5) |
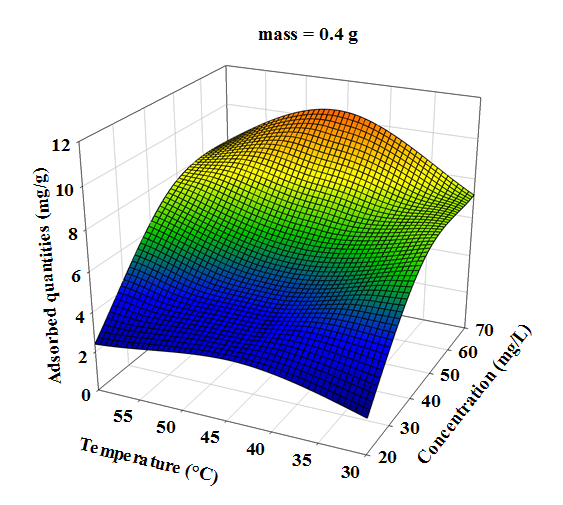 | Figure 7. Response area of the effect of temperature and initial concentration, on the adsorption of Methylene Blue at constant adsorbent dosage (0.4 g) and pH (5) |
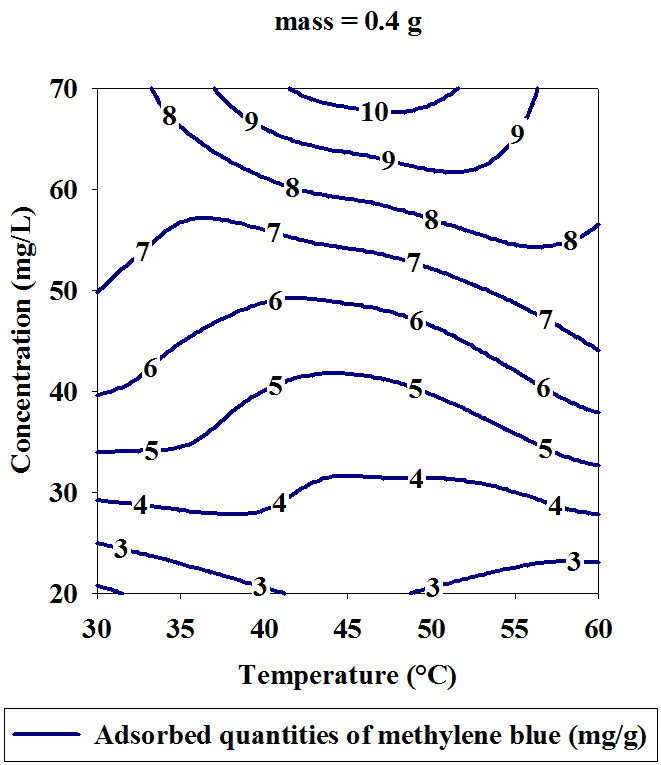 | Figure 8. Iso-response curves of the effect of temperature and initial concentration, on the adsorption of Methylene Blue at constant adsorbent dosage (0.4 g) and pH (5) |
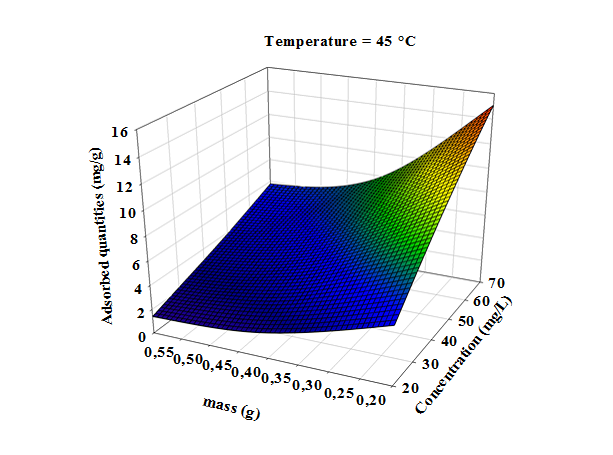 | Figure 9. Response surfaces of the effect of adsorbent dosage and initial concentration, on the adsorption of Methylene Blue at constant temperature (45.0°C) and pH (5) |
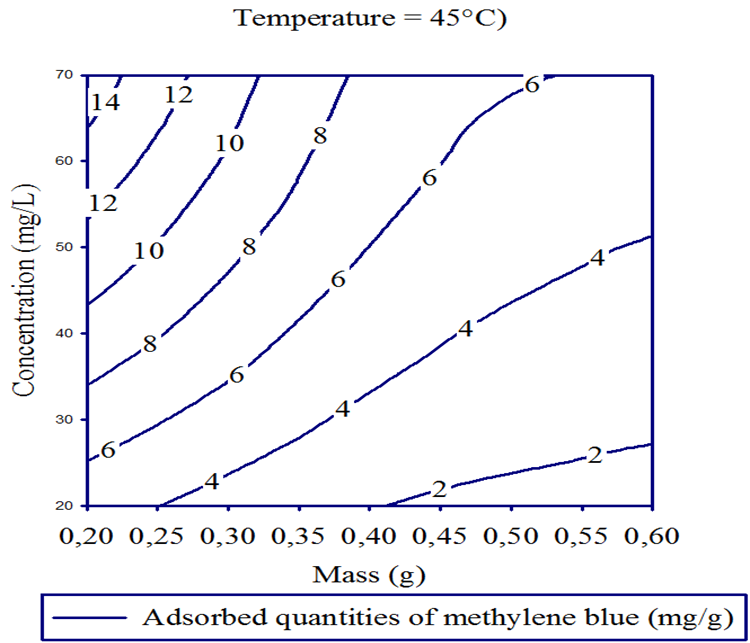 | Figure 10. Iso-response curves for the effect of adsorbent dosage and initial concentration, on the adsorption of Methylene Blue at constant adsorbent dosage (0.4 g) and pH (5) |
4. Conclusions
- The adsorption efficiency of Bos Gudali Inducus was studied using Methylene Blue dye solution. Adsorption experimental process parameters namely temperature, initial concentration and adsorbent mass were considered to optimize the removal of Methylene Blue using response surface methodology. Experimental design approach consists of organizing the experimental approach and decision analysis by applying several tools and statistical tests. The use of experimental designs leads to establish a design with maximum precision with minimum experiments. In this work, we first used as preliminary step Domga et al (2015) work, in order to select most influencing factors. Among studied factors, temperature, initial dye concentration and adsorbent mass appeared to be the most influential parameters on the amount of methylene blue adsorbed on Gudali bones activated carbon. These factors were then examined by the response surface methodology using the Box-Behnken design. Adsorption experimental process parameters like temperature, initial concentration and adsorbent mass were optimized using RSM for removal of Methylene Blue. Furthermore, interactions among all variables were investigated. Regression analysis, statistical significance and response surface well predicted responses in experimental regions. Multiple correlation coefficient of determination R2 was 98.99%, showing that experimental data fitted well with the predicted data. The lack of adequacy test showed that this model fit very well experimental data. To study the effect of independent variables, we modeled the response as a polynomial based on these parameters. Obtained model is significant P = 0.02 (<0.05). There is a satisfactory correlation between measured values and adjusted values, R2 = 98.99% and R2 ajus = 97.18. Optimal adsorption of Methylene Blue using Bos Gudali Indicus activated carbon at temperature, initial concentration and adsorbent mass were found to be 45°C, 45 mg.L-1 and 0.2 g respectively with 15.08 mg.g-1 as dye adsorbed amount. This results shows Bos Gudali Inducus is better adsorbent for Methylene Blue adsorption from aqueous solution than many others adsorbents including some activated carbons and biosorbents.