-
Paper Information
- Paper Submission
-
Journal Information
- About This Journal
- Editorial Board
- Current Issue
- Archive
- Author Guidelines
- Contact Us
American Journal of Chemistry
p-ISSN: 2165-8749 e-ISSN: 2165-8781
2021; 11(3): 52-58
doi:10.5923/j.chemistry.20211103.03
Received: May 22, 2021; Accepted: Jul. 23, 2021; Published: Aug. 25, 2021

Water Quality Assessment of Well Water Samples Collected from Ewekoro and Ibeshe Limestone Mines in Ogun State
 Abstract
 Reference
 Full-Text PDF
 Full-text HTML
Moronkola B. A. , Alegbe M. J. , Omowonuola A. A.
Chemistry Department, Lagos State University Ojo campus, Lagos Badagry Expressway, Lagos, Nigeria
Correspondence to: Alegbe M. J. , Chemistry Department, Lagos State University Ojo campus, Lagos Badagry Expressway, Lagos, Nigeria.
| Email: |  |
Copyright © 2021 The Author(s). Published by Scientific & Academic Publishing.
This work is licensed under the Creative Commons Attribution International License (CC BY).
http://creativecommons.org/licenses/by/4.0/

Environment is being polluted by mines with industrial activities that is becoming more harmful by making the environment to be toxic. The aim of this study is to determine the water quality of well water samples around the two limestone mines located in (Ibeshe and Ewekoro) of Ogun State respectively. Physicochemical techniques was carried out to determine the following parameters such as temperature, turbidity, electrical conductivity (EC), dissolved oxygen (DO), acidity, alkalinity, colour, total dissolved solid (TDS) and some selected metals (Cd, Ni, Cr, Pb, Zn, Fe, and Mn) were analysed. The results total suspended solid (TSS) was studied and shows that the TDS of all the samples were found to be within NSDWQ value of 500 mg/L. The concentration of Cr, Pb, Zn, Fe, and Mn detected in the groundwater samples are within the range of 0.007 - 0.012, 0.001 - 0.029, 1.342 - 1.743, 0.13 - 0.20 and 0.17 - 0.22 mg/L respectively. Cd and Ni were not detected in the water samples. In conclusion, limestone mine has impacted negatively on its surrounding well water due to leaching of the metals into the ground and underground water. The pH and EC of the fresh well water from Ewekoro and Ibeshe sites are (6.76 ± 0.02 and 7.46 ± 0.02) and (370 – 675 µS/cm) respectively and it fall within the water quality range for potable water of WHO and NSDWQ. Some of the heavy metals found in the well water were within while others were above WHO and NSDWQ standard limit.
Keywords: Well water, Limestone mine, Physicochemical parameters, Heavy metals
Cite this paper: Moronkola B. A. , Alegbe M. J. , Omowonuola A. A. , Water Quality Assessment of Well Water Samples Collected from Ewekoro and Ibeshe Limestone Mines in Ogun State, American Journal of Chemistry, Vol. 11 No. 3, 2021, pp. 52-58. doi: 10.5923/j.chemistry.20211103.03.
Article Outline
1. Introduction
- The mining of limestone generates waste which could contaminate both underground soil and well water which is used for domestic purpose. Water and soil are important and valuable resources of the nature. All living things are directly and indirectly dependent on soil for day to day needs and 95% of the human food is derived from the earth. Making plan for having healthy and productive water is essential to human survival. The environmental pollution as a result of cement industry could be defined as an undesirable process that is responsible to pollute water, air and land through its various activities, right from the mining activity of the raw material (limestone, dolomite etc.) to its crushing, grinding and other associated processes in cement plant [1]. The presence of total solids in the form of salts of Ca, Na, K, Mg, Al as hydroxides sulphates and silicates leads to hardness of water which causes gastro intestinal disorders which have been found as quite common in the area. Soil pollution is developed due to constant fall of cement dust, resulted in the formation of colloidal gels of calcium silicate and calcium aluminate.The cement dust, produced by cement manufacturing units is considered one of the most hazardous pollutants which affect the surrounding environment. These particles can enter into soil as dry, humid or occult deposits and can undermine its physicochemical properties. The deposit of these particles is complex and it is controlled by the atmospheric stability, the roughness of the surfaces as well as the diameter of the particles. Indeed, it is relevant to mention that in the arid regions, the dry deposits are particularly more important [2].The atmospheric particles can have as consequence the reduction of biodiversity and the quality of goods and services offered by the ecosystems. The main visible pollution generated by the cement industry corresponds to the dusts. Indeed, the dusts can be emitted at every stage of the manufacturing process of the cement: extraction of the raw material, crushing, production, etc. The impact of the cement dust on soil properties and plant production has been investigated by some researchers [3]. Air pollution has been described as an additional stress on plants since they often respond to atmospheric contamination in the same way as they respond to drought and other environment stress. Especially, the role of cement pollutants causing injury to plants either by direct toxic effect or modifying the host physiology rendering it more susceptible to infection [4]. In severe case of pollution, the injury symptoms were expressed as foliar necrosis or completely disappearance of the plant. Samal and Santra, [5] have also reported from their previous study the impact of air pollution on plants with reference to foliar anatomical and biochemical changes by experimenting on various sensitive plants. Increased concentrations of the above pollutants cause progressive reduction in the photosynthetic ability of leaves, closure of leaf stomata and, mainly, a reduction in growth and productivity of plants [6]. These dust particulates are causing large scale deforestation, destruction of Biota [7] and other natural resources. Among these deposition of cement kiln dust in large quantities around cement factories causes changes in soil physical chemical properties [8]. The effect of such deposition affects the growth and biochemical characteristics of field crops has also been widely studied [9].Water is an essential natural resource for sustainability of life on earth. Humans may survive for several weeks without food, but barely few days without water because constant supply of water is needed to replenish the fluids lost through normal physiological activities, such as respiration, perspiration, urination [10]. Though the hydrosphere is estimated to contain about 1.36 billion Km3, only about 0.3% of the water, existing as fresh water in rivers, streams springs and aquifers, is available for human use; the remaining 99.7% is locked up in seas and oceans [12].The geological constraints limit accessibility of many human communities to water that is adequate in terms of quantity, quality and sustainability. Lack of adequate supply of potable water is a critical challenge in developing countries such as Nigeria. Potable water, also called drinking water in reference to its intended use, is defined as water which is fit for consumption by humans and other animals [9].The usual source of drinking water is the streams, rivers, wells and boreholes which are mostly untreated and associated with various health risks [10]. Paucity of infrastructure for effective treatment and distribution of water accounts for the incidence of high morbidity and mortality rate associated with water borne diseases in developing countries [11]. One of the targets of the millennium development goals (MDG) in terms of healthy living for the masses can be achieved through the supply of safe and convenient water [12]. The quality of water influences the health status of any populace, hence, analysis of water for physical, biological and chemical properties including trace element contents are very important for public health studies. Groundwater is an important water resource in both the urban and rural areas of Nigeria [13]. Pollution of surface water can create health risks because such waterways are often used directly as drinking water sources or connected with shallow well used for drinking water. In addition waterways have important roles for washing and cleaning, for fishing and fish farming and for recreation. Another major source of drinking water is ground water which often has low concentrations of pathogens because the water is filtered during its transit through underground layers of sand, clay or rocks. However toxic chemicals such as arsenic and fluoride can be dissolved from the soil or rock layers into well waters. The problem associated with mining of limestone production in an environment is the contamination of the surface and underground soil well water. The deposition of limestone wastes within the area of the mining can degrade the soil quality which makes farming difficult for the farmers in that locality. The dust generated during the production of limestone is one of the major causes of heavy metal contamination in soils. Dust pollution has been found to be problematic around limestone mines.The extent of pollution of water resources in an environment where the mine is situated decreases as the distance from the mine increases. This rate of decrease has not been mapped before or studied. The consistent discharge of wastes in form of dust into the water body around the mine area has led to pollution of the water resources. The pollution of the environment might affect the water and cause hazard to the people using it according to world health organization (WHO).The rationale of this study is to assess the quality of well water around limestone mining sites that the people use for cooking and drinking so as to provide information on the water quality. The environmental quality deterioration resulting from increase in the level of potentially toxic metals is becoming more rampant, thereby raising the questions on safety status of the environment. The aim of this study is to determine the quality of well water samples around the two limestone mines located in Ogun State.
2. Materials and Method
2.1. Study Area
- The mine was first set up fifty five years ago in Ewekoro, Ogun State by extracting and blasting limestone to make cement, West African Portland Cement (WAPCO). The Ewekoro plant of WAPCO is located in Ewekoro local government area Ogun state in the South West Nigeria. The mine is located at Ibeshe and Ewekoro town in Ewekoro local government area of Ogun State. The local government area is bounded in the north by Abeokuta, in the east by Obafemi-Owode, in the west by Yewa South and in the south by Ado-Odo Ota.Moreover, Ewekoro cement factory is on a latitude 5°.50’ N and longitude 3°.17’ E. Also, it is approximately 64 kilometers South of Abeokuta. Thus water samples was collected from a season of the year and analysed to determine the quality of the well around the mine. Majority of the inhabitants are farmers and the area is largely rural. Most of these farmers engaged in the planting of sugar cane, cassava, maize and vegetable. Cash crops such as cocoa, kolanut and oil palm are also cultivated. These farmers also engaged in the rearing of livestock’s like small ruminants, poultry and pigs.
 | Figure 1. Map of limestone mine location in Ogun State Ibeshe =  and Ewekoro = and Ewekoro =  |
3. Results and Discussions
3.1. Physical Analysis
- The physical parameters of the well water analyzed are pH, EC, TDS, turbidity, odour, taste, and colour. The results of these parameters are presented in Figures 2-3.Figures 2 and 3 presents the physical parameters of the well water samples collected around the Ibeshe and Ewekoro limestone mines. The pH values of the Ibeshe and Ewekoro limestone site well water are 7.0 and 6.7 respectively which revealed that they are acidic. The low pH shows the well water quality is poor because the values fell below the WHO and NSDWQ specification of 6.7-9. The EC value for Ibeshe and Ewekoro well water samples are 370 and 676.01 µS / cm which show that value of Ewekoro is higher than the Ibeshe and this could be linked to the age of the mining activity. The analysis of the EC for the well water samples collected Ibeshe and Ewekoro mines are 390 and 676 respectively and they fall within the WHO and NSDWQ specification for potable drinking water of 1000 and 900 respectively. The turbidity of Ibeshe and Ewekoro well water samples are 0.04 NTU each which is within the WHO and NSDWQ standard for potable water of 10 and 5 NTU respectively. The TDS of the Ibeshe and Ewekoro well water samples are 195 and 337.48 mg/L which falls within the WHO and NSDWQ standards for potable drinking water of 500 mg/L. The total suspended solids of the well water collected from Ibeshe and Ewekoro mines are 0.00 and 0.02 mg/L respectively in which WHO and NSDWQ have no specific value.
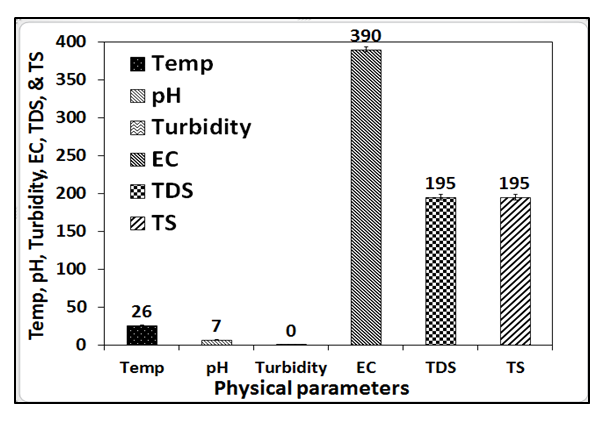 | Figure 2. Physical parameters of fresh well water collected around Ibeshe limestone mine residence |
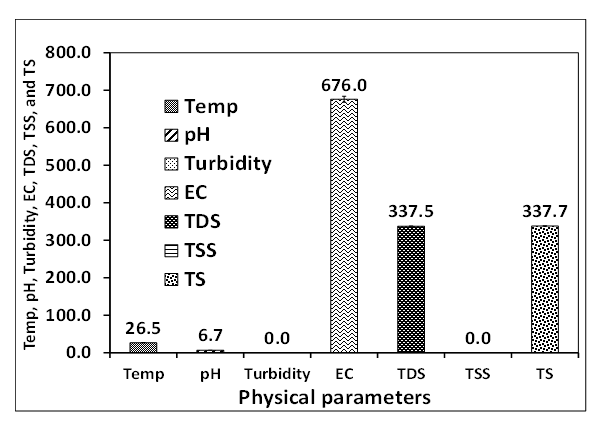 | Figure 3. Physical parameters of fresh well water collected around Ewekoro limestone mine residence |
3.2. Chemical Analysis
- The chemical parameters of the well water analyzed are total acidity, total alkalinity, total hardness, chloride and metals such as Ca, Mg, Mn, Fe, Zn, Pb, Cd, Ni and Cr.Figures 4 and 5 present the chemical analysis of acidity, alkalinity, hardness and chloride well water samples collected from residence around Ibeshe and Ewekoro limestone mines. The total acidity of the Ibeshe and Ewekoro well water samples around limestone mines are 2125 and 2128 mg / L which is not available in the WHO and NSDWQ standard specification. The values obtained for the total alkalinity of the Ibeshe and Ewekoro well water samples are 1450 and 1147 mg / L which are not available for the WHO and NSDWQ drinking water standards [14,15,16].
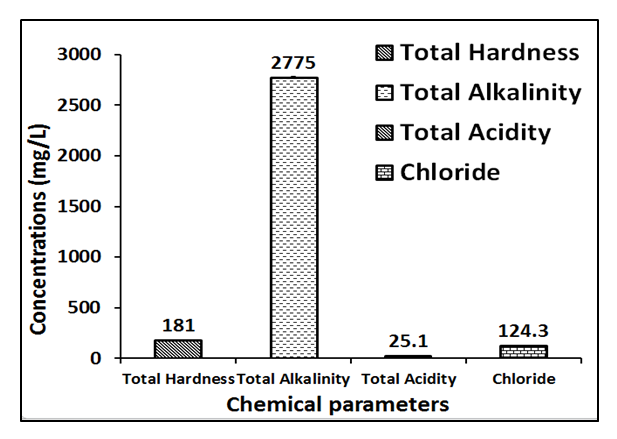 | Figure 4. Chemical parameters of fresh well water collected from Ibeshe |
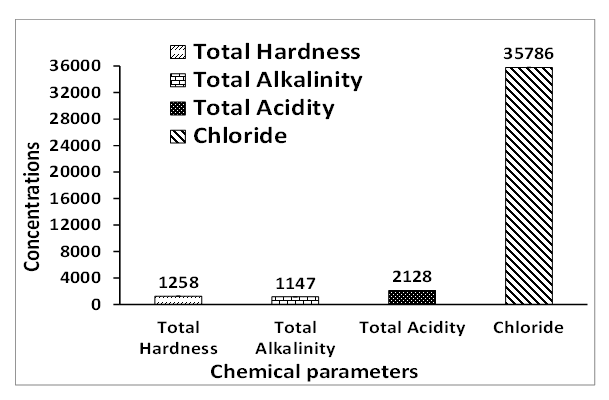 | Figure 5. Chemical parameters of fresh well water collected around Ewekoro mine residence |
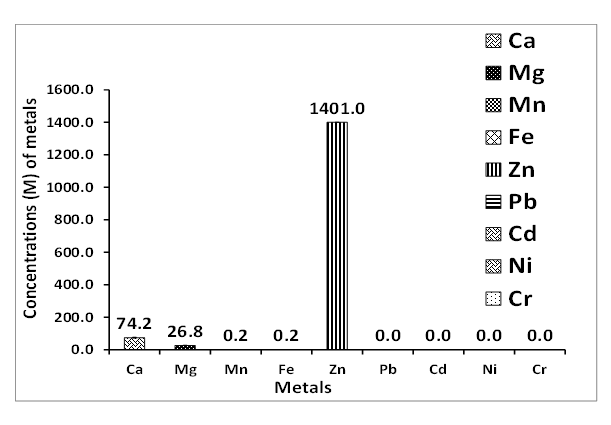 | Figure 6. Metal concentrations of fresh well water collected around Ibeshe mine residence |
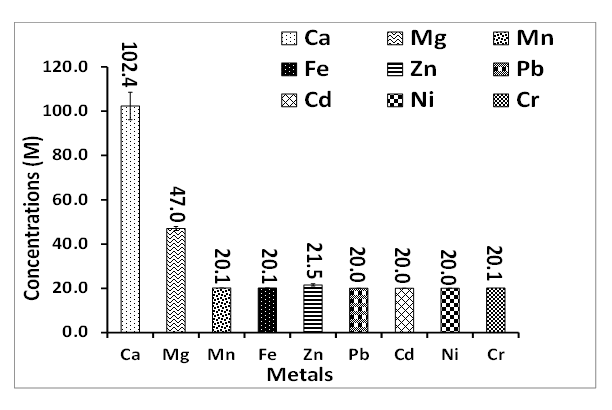 | Figure 7. Metal concentration in fresh well water collected around Ewekoro limestone mine residence |
4. Conclusions
- This study shows that the well water samples collected around limestone mines are contaminated with some metals which are injurious to human health. However, the level of pollution at Ewekoro limestone mine area is much higher than the Ibeshe mine which could be due to the long time existence of the Ewekoro mine. Hence, there is need for strict compliance to environmental rules and regulations by the government to curb the activities of the cement.