American Journal of Chemistry

p-ISSN: 2165-8749    e-ISSN: 2165-8781

2021;  11(1): 8-17

doi:10.5923/j.chemistry.20211101.02

Received: Jan. 15, 2021; Accepted: Jan. 30, 2021; Published: Feb. 6, 2021


Synthesis and Characterization of Nickel Doped Titanium Dioxide Nano Crystals Composite for the Treatment of Tannery Dye Wastewater

Amana B. S. 1, A. Giwa 2, H. R. Saliu 2, Ayebe B. 1, S. F. Tanko 1, J. D. Putshaka 3

1Nigerian Institute of Leather and Science Technology (NILEST), Zaria

2Department of Polymer and Textile Engineering, Ahmadu Bello University, Zaria

3Nigerian Institute of Leather and Science Technology (NILEST), Jos Extension Centre

Correspondence to: Amana B. S. , Nigerian Institute of Leather and Science Technology (NILEST), Zaria.

Email:

Copyright © 2021 The Author(s). Published by Scientific & Academic Publishing.

This work is licensed under the Creative Commons Attribution International License (CC BY).
http://creativecommons.org/licenses/by/4.0/

Abstract

Nickel doped Titanium dioxide nanocrystals composite was synthesized via wet-impregnation method for 0.5%, 1%, 1.5% and 2% Ni-TiO2 and characterized using X-ray diffraction pattern (XRD), X-ray florescence (XRF), Scanning Electron Microscopy (SEM) and band gap energy. The XRD results reveal that the phase structure of the synthesized samples was mainly in pure anatase phase having crystalline size in the range of 7nm-11nm, spherical shapes with moderate aggregation of the crystal particles were observed under the SEM, the XRF gives the exact percentage dopant in Ni-TiO2 nano-crystal and the band gap energy was lowered from 3.1ev-2.95ev. The presence of the NiNO3 at TiO2 site has not only affected the nano-crystals morphologically but also induce the electronic property of the TiO2 by lowering the band gap energy from 3.1ev-2.95ev which prone the decolouration of organic pollutants. The photocatalyst synthesized was found to effective in the mineralization of dye wastewater under visible light irradiation.

Keywords: Nanocrystal, Wet-impregnation, Nickel, Titanium dioxide, Dye waste water

Cite this paper: Amana B. S. , A. Giwa , H. R. Saliu , Ayebe B. , S. F. Tanko , J. D. Putshaka , Synthesis and Characterization of Nickel Doped Titanium Dioxide Nano Crystals Composite for the Treatment of Tannery Dye Wastewater, American Journal of Chemistry, Vol. 11 No. 1, 2021, pp. 8-17. doi: 10.5923/j.chemistry.20211101.02.

1. Introduction

Effluent being generated from synthetic dyes cannot be effectively treated using conventional processes due to their recalcitrant nature and are therefore candidates for Advanced Oxidation Processes (AOPs) [Han et al.; 2009, Martı´nez and Brillas, 2009]. AOPs is capable of mineralizing a wide variety of organic pollutants [O ¨ zcan et al.; 2009, Arshlan-Alaton, 2007; Rivas et al.; 2012, Forgacs et al.; 2004, Gomathi et al.; 2009] and Photocatalysis using metal doped Titanium dioxide has been widely reported as a promising technology for the removal of various organic and inorganic pollutants from wastewater and air because of its stability, low cost and non toxicity [Liu et al.; 2008, Zheng et al.; 2015]. Metal doped Titanium dioxide photocatalyst has consumed a great attention due to its enhanced photocatalytic activity at Visible region [Ganesh et al.; 2012, Yan-Hue et al.; 2012] and their wide band gap limits their photocatalytic activity in the ultraviolet region that contributes 3-5% of the total solar spectrum [Zheng et al.; 2015, Pouran et al.; 2016]. Nickel doped Titanium dioxide can therefore improved the visible responsive activity in environmental organic pollutant degradation through the utilization of solar energy [Visinescu et al.; 2015, Ahmed; 2012, Ahmed et al.; 2018]. This research focuses on Synthesising a Nickel doped Titanium dioxide that can utilized solar/electrical energy for the treatment of Tannery wastewater.

2. Preparation of Ni-doped TiO2

19.69 g of commercially available TiO2 was dissolved in 100ml of distilled water and 0.31 g of NiNO3 was then added to synthesize 0.5% Ni doped TiO2. The mixture was then stirred at room temperature for 4 hrs continuously and the powder was separated by decantation. The supernatant liquid was then discarded and dried in an oven at 100°C for 3 hrs and calcined for 4 hrs at 300°C and crushed manually in the form of very fine powder. Similarly, 1.0, 1.5 and 2.0% Ni-TiO2 were prepared only by changing the amount of NiNO3 to 0.62g, 0.93g, 1.24g and that of Titanium dioxide mass to 19.38, 19.07, 18.76 to obtain Ni-TiO2 in total mass of 20g respectively.

3. Result and Discussion

3.1. XRD Patterns of the Synthesized Ni-TiO2 Catalyst

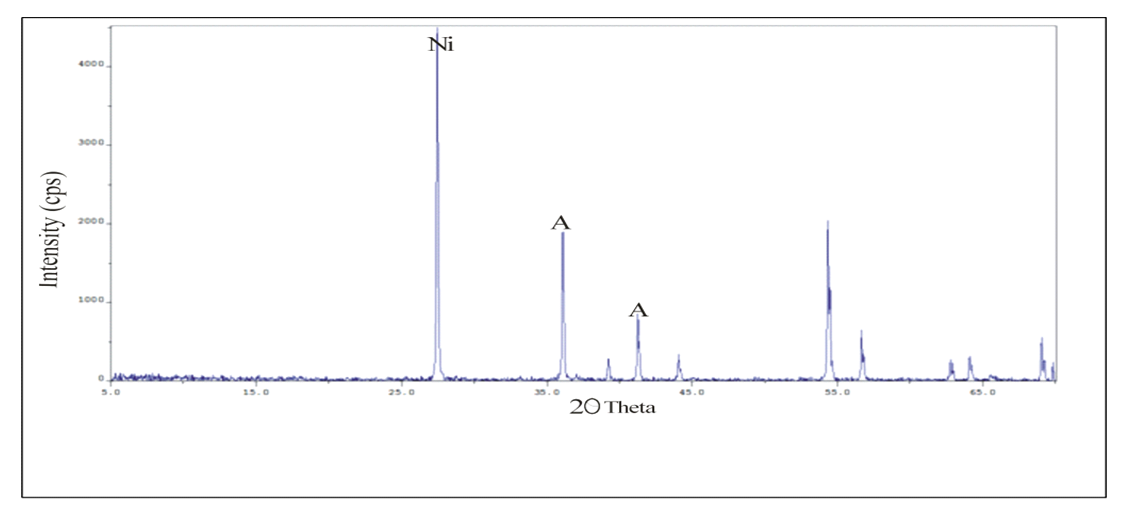
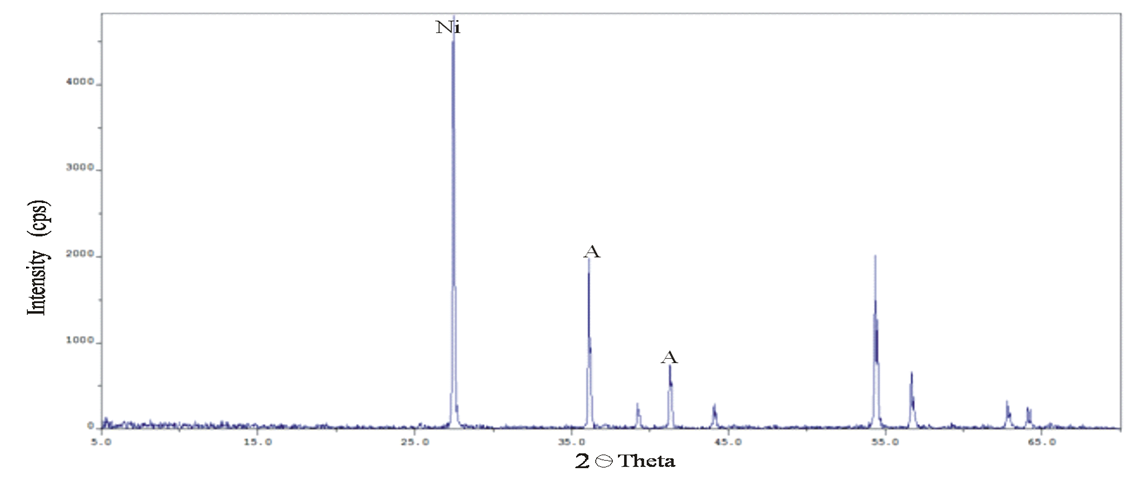
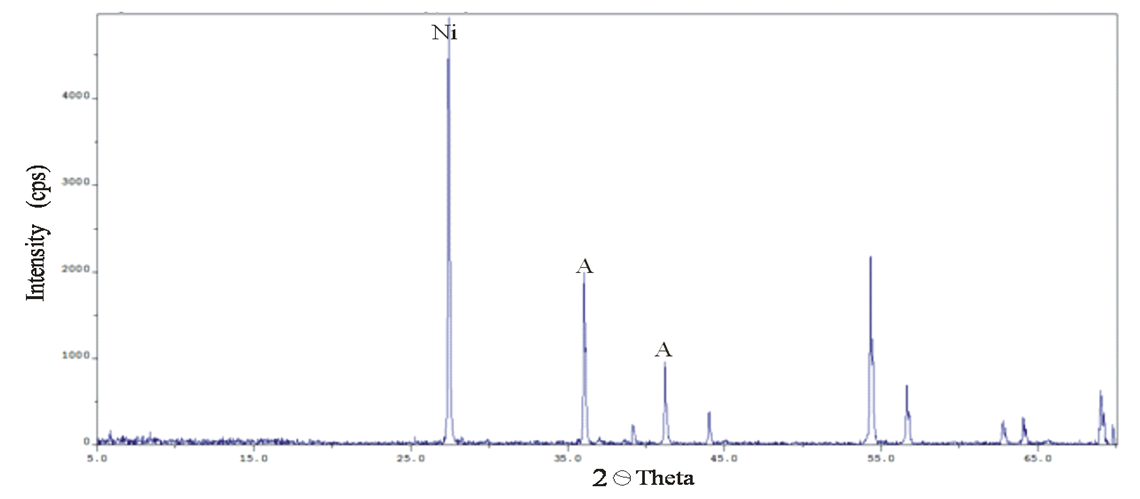
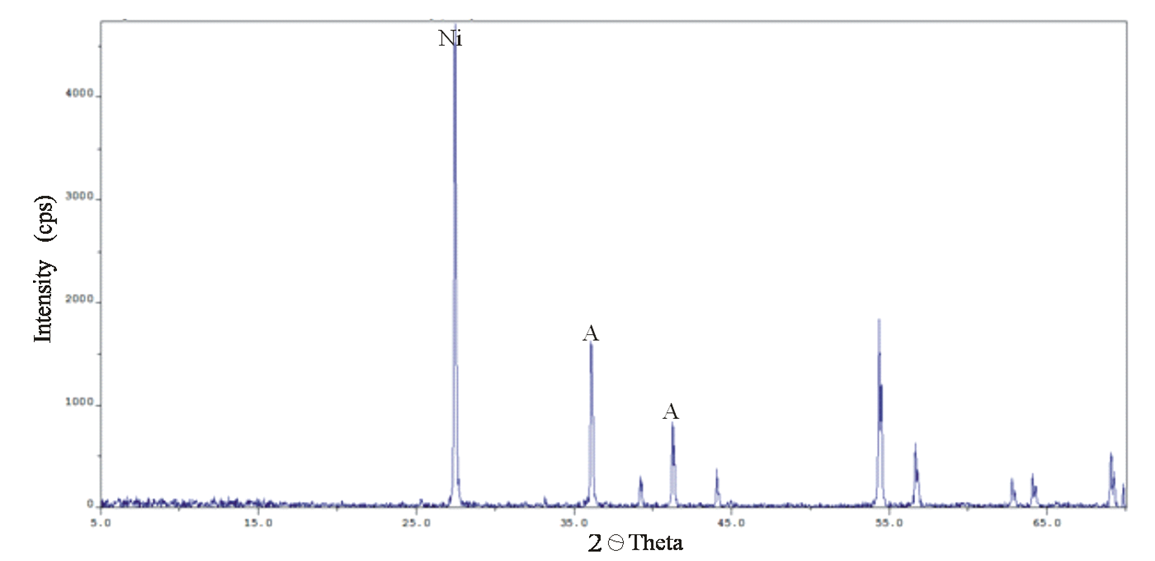
Figure 1a, 1b, 1c and 1d shows the X-ray diffraction (XRD) pattern of 0.5%, 1%, 1.5% and 2% Ni-TiO2 photocatalyst that is synthesized by wet impregnation method and the peaks are perfectly indexed as anatase phase. The average crystalline sizes was calculated from the sharer equation as 7.5nm compare with 0.5% Ni-TiO2 , the crystalline sizes decreases after doping. the intensity was about the same peak observed all through except at 2% Ni-TiO2 there observed a sharp decrease in intensity which also decreases the particles size thereby reduces the surface area of the photocatalyst as a results agglomeration of the catalyst.
Figure 1a. XRD pattern for 0.5% Ni-TiO2
Figure 1b. XRD pattern for 1% Ni-TiO2
Figure 1c. XRD pattern for 1% Ni-TiO2
Figure 1d. XRD pattern for 1% Ni-TiO2
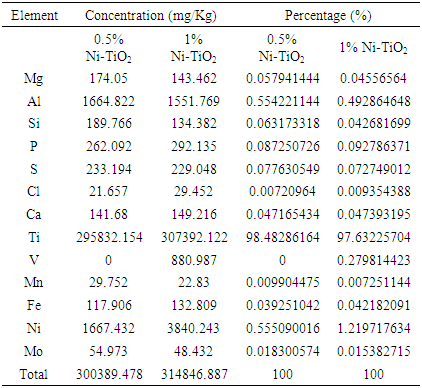
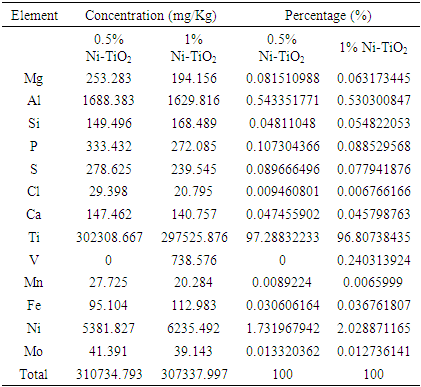
Table 1a and 1b is the X-ray fractometry (XRF) of the synthesized photocatalyst, which displays elemental composition of the Ni-TiO2 are express in percentage which confirms the presences of Nickel in percentage require abundance of titanium dioxide. However the results also reveals other element are present but in a negligible trace amount which can be attributed to two basic factor responsible. The most fundamental reason could be impurities occur during manufacturing process and second could be during weighing or synthesis.
Table 1a. XRF Result for 0.5% Ni-TiO2 and 1% Ni-TiO2
     
Table 1b. XRF Result for 1.5% Ni-TiO2 and 2% Ni-TiO2
     
Table 2a displays Band gap energy of the synthesized photocatalysts which were obtain spectrophotometrically. From the results obtained, there was a decrease in the band gap energy as the dopant increases and the wavelength increase thereby causes Red shift from Uv region to the visible region enabling photocalyst to harness visible to mineralize dye molecules.
Table 2a. Band gap energy of the synthesize catalysts
     
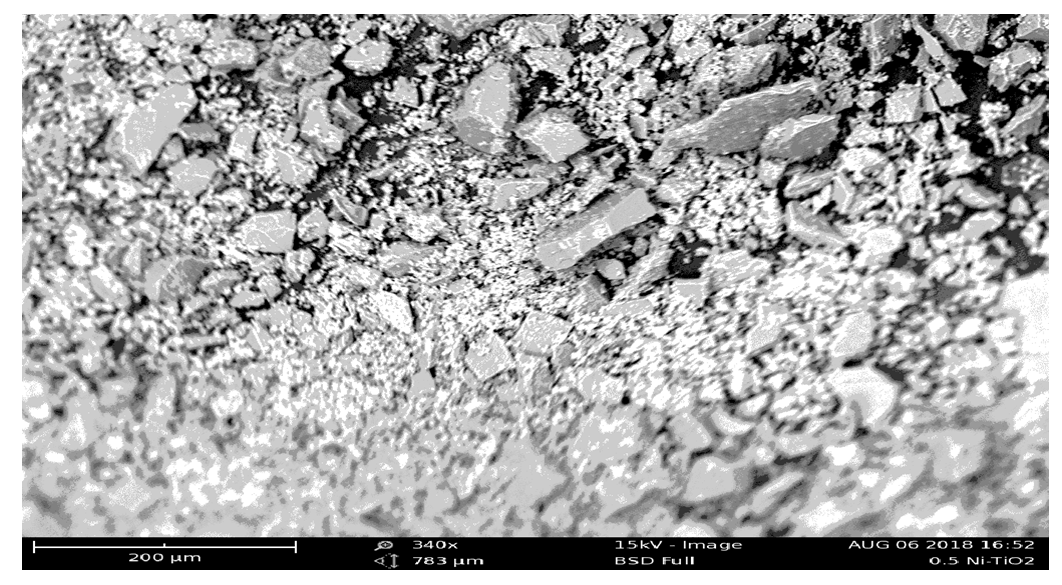
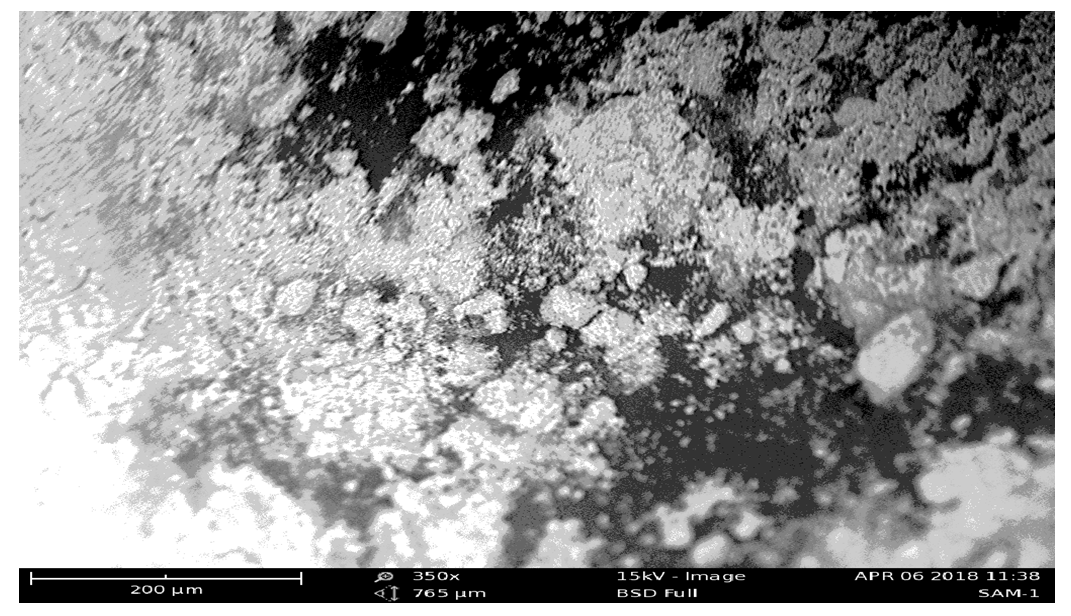
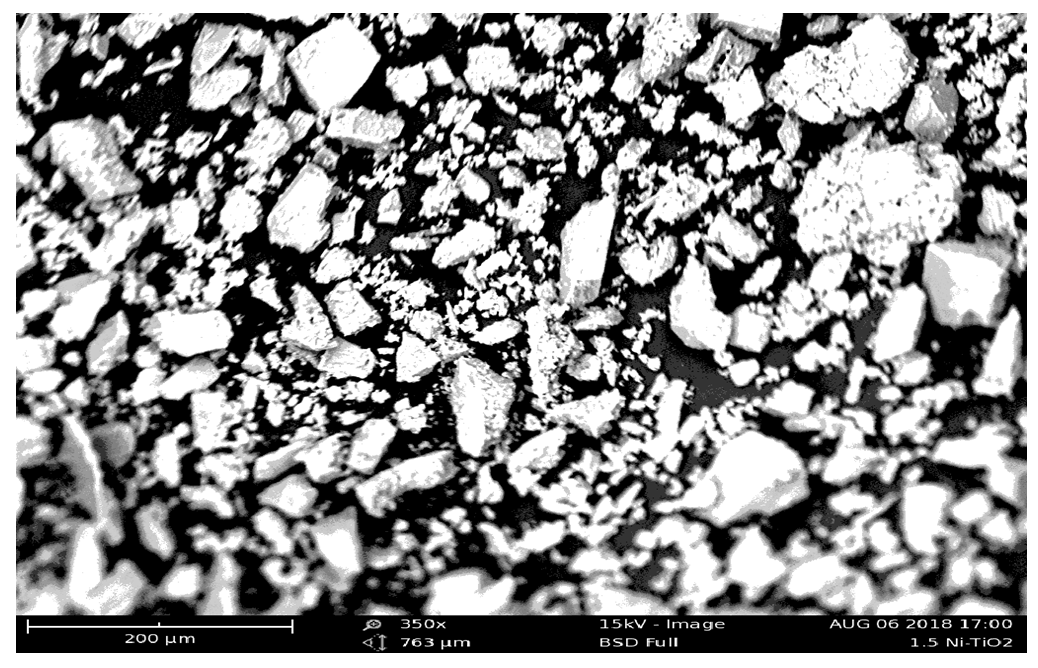
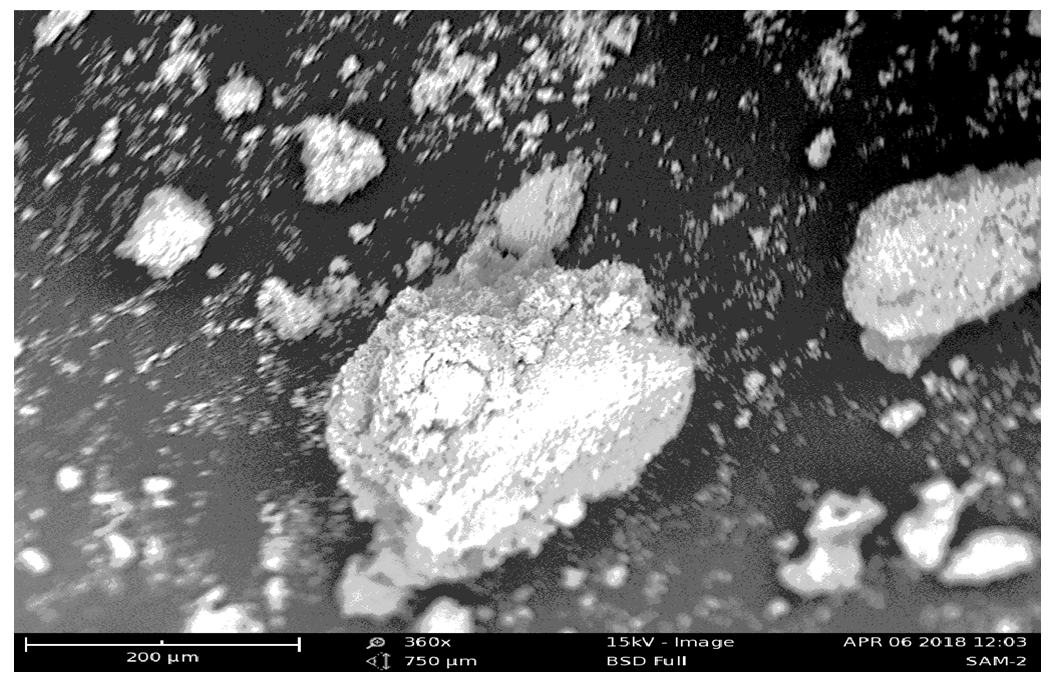
Figure 1, 2, 3 and 4 shows the scan electron microscopy of the synthesized catalyst. From the result obtained indicates various morphology with their average pore sizes 15.4µm2, 11.6µm2, 9.4µm2 and 8.24µm2 respectively.
Figure 1. Scan electron microscopy of 0.5% Ni-TiO2
Figure 2. Scan electron microscopy of 1% Ni-TiO2
Figure 3. Scan electron microscopy of 1.5% Ni-TiO2
Figure 4. Scan electron microscopy of 2% Ni-TiO2
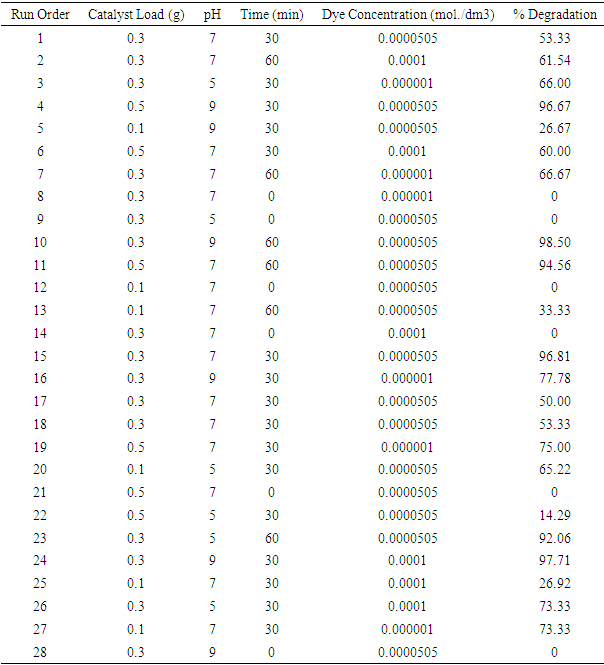
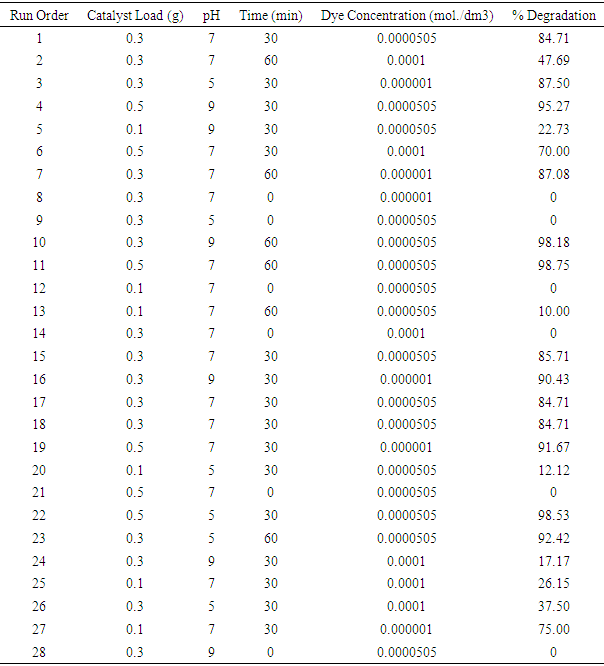
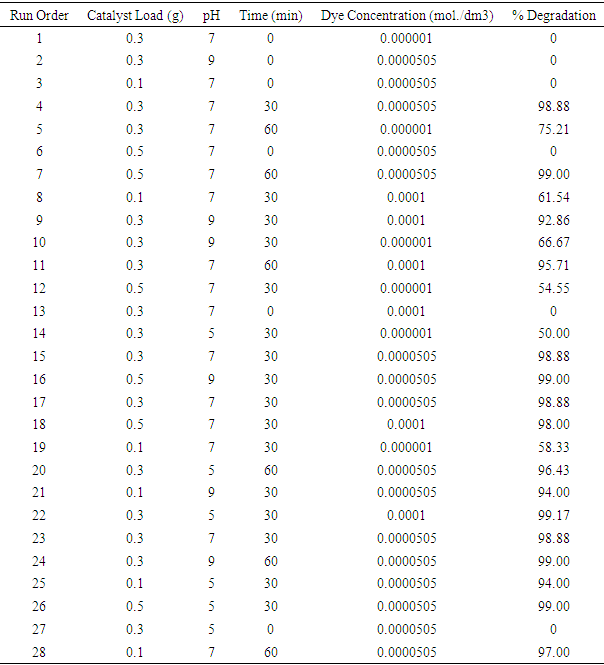
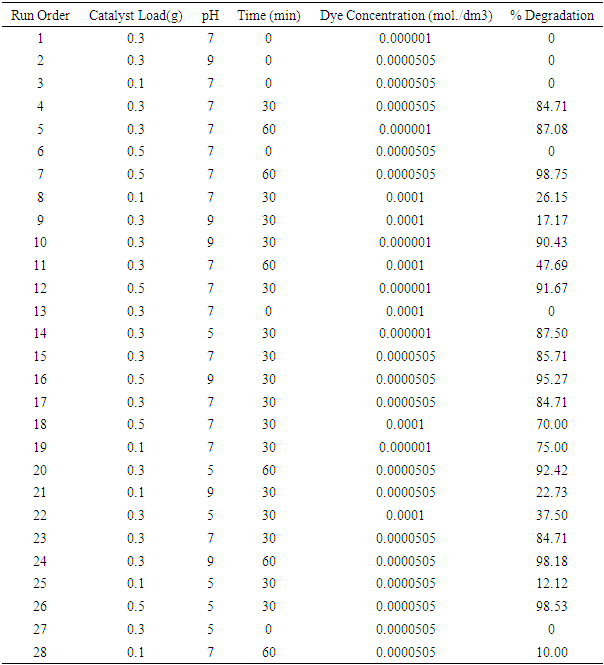
Table 3a, 3b, 3c and 3d is showing the variation of % Degredation with respect to pH and irradiation time. It is evident that as the irradiation time increases there is a steady increase in degradation. Also, as the pH increases, the degradation also increases. This increase in % degradation as a result of increase in pH in alkaline region is attributed to the fact that more hydroxyl radicals were generated as a result of the reaction between hydroxyl ions and positive holes of the photocatalyst thereby increasing the rate of photodegradation. This is in agreement with a finding of (Akpan and Hameed, 2009, Tang and An, 1995, Goncalves, et al., 1991).
It is worthy of mention that in an alkaline solution there exist coulombic repulsion between the negatively charge surface of the photocatalyst and the hydroxide anion at a higher pH and this could prevent the formation of .OH in higher alkaline solution thus decreasing the rate of photocatalytic degradation of the dye molecule (Akpan and Hameed, 2009).
Effect of pH and catalyst loading at a dye concentration 0.0001mol/dm3 and irradiation time of 60 minutes. Changes in pH can influence the absorption of dye molecule on the surface of TiO2 which is an important step for photocatalytic oxidation to take place (Fox and Dulay, 1993). The percentage degradation therefore increases as the pH moves toward the alkaline region. This is because in an acidic media, the TiO2 particle aggnolomerate thereby reducing the surface available for dye absorption and photon absorption (Fox and Dulay, 1993) while the alkaline media favours the generation of more hydroxyl radical by oxidizing more hydroxyl ion on the surface of the photocatalyst thereby enhancing the efficiency of the photocatalyst (Goncalves, et al., 1999) it then implies that percentage degradation greater than 95 is achievable at a pH of 5-9 and the catalyst loading of 0.5(g).
However percentage degradation in respect to irradiation time and the catalyst loading. An increment in irradiation time increases the rate of degradation as seen in the table above. Beyond certain time the rate of degradation could be affected negatively as a result of the short lifespan of the photocatalyst by active sites deactivation due to strong byproduct deposition. The catalyst loading also has an influence on the degradation rate. As the catalyst loading increases from 0.1-0.5, there was a progressive increase with a rate of reaction as shown in the aforementioned table. This increment is attributed to the fact that increase in the amount of the photocatalyst increases the number of the active sites on the photocatalyst surface which in turn increases the number of hydroxyl and superoxide radicals both of which are predominant species of degradation of dyes (Konstaninou and Albanis, 2004, Saquid and Muneer, 2008, Sun et al., 2010; Liu et al., 2006). This is true for dye concentration of 0.0000505 mol/dm3 and a pH of 7 while it is 0.0000505mol./dm3 and pH 7 at an irradiation time of 60 minutes.
Table 3a. Summary of a % Degradation for 0.5% Ni-TiO2
     
Table 3b. Summary of a % Degradation for 1% Ni-TiO2
     
Table 3c. Summary of a % Degradation for 1.5% Ni-TiO2
     
Table 3d. Summary of a % Degradation for 2% Ni-TiO2
     
The effect of irradiation time and dye concentration at a catalyst loading of 0.5(g) and a pH of 7. It is evident that as the irradiatin time increases there is a corresponding increase in the % degradation. Photocatalytic degradation also increases with increase in the dye concentration and this may be attributed to the fact that as the dye concentration increases, more dye molecules become available foe excitation for energy transfer, resulting in an increase in rate of reaction. But beyond a concentration of 0.0001mol./dm3, increases in the concentration of the dye molecules may acts as a blanket or cover and will not permit the desired light intensity to reach the semiconductor surface. Thus, decreasing the rate of photocatalysis (Davi et al., 1994).
Effect of pH and dye concentration for a catalyst loading of 0.3 and irradiation time of 30 minutes. The percentage degradation increases as the pH increases from neutral to alkaline region and this can be as a result of the availability of hydroxide ion in pH range of 5-9 which combine with holes formed due to electron excitation of the catalyst. This is in agreement with the finding (Akpan and Hameed, 2009 and Konstaninou and Albanis, 2004,) that the rate of degradation is higher at alkaline pH because alkaline pH favours the generation of the hydroxyl radicals which enhances the rate of photodegradation (Sun et al., 2010, Baran et al., 2008, Xiao et al., 2007) as the concentration also increases the rate of degradation also increases as seen from the plot.
Interraction between catalyst load and dye concentration on the rate of degradation. The amount of the photocatalyst is one of the most important parameter that affects the rate of photocatalytic degradation of organic colorants. The effects of variation in the amount of photocatalyst from 0.1-0.5g and concentration of dye and at pH of 7 and irradiation time of 30 minutes were measured. On the rate of degradation, it was found that catalyst loading increases, the rate of degradation also increases. Increase in the rate of degradation with increase in the amount of catalyst is due to the availability of more catalyst surface area for absorption of photons of light and interaction of molecules of reaction mixture with catalyst, with resultant increase in the number of holes, hydroxyl radical and super oxide ions (O2- . As the dye concentration is increased from 0.000001mol./dm3 to 0.0001mol./dm3 the number of dye molecule in the solution also increases with corresponding increase in the percentage degradation (Akpan and Hameed, 2009, Sun et al., 2010; Liu et al., 2006).

4. Conclusions

1. At the end of this research work, we have successfully developed Ni-TiO2 through wet impregnation rout that is markedly enhance the absorption of visible photocatalytic degradation of wastewater from tannery containing acid azo dyes.
2. Crystalline structure of Ni-dopedTiO2 exhibit anatase-type crystallite, determined from XRD analysis. In UV absorption spectra, the absorption edge Ni-TiO2 shows a shift to visible-light region, followed by an ovious absorption peak at 400-420 nm this transformation can be ascribed to the formation of impurities energy level within the band gap, improving the visible-light photocatalysis of dye tannery wastewater.
3. Visible-light photocatalysis capacities are increasing function from 0.5% Ni-TiO2, 1% Ni-TiO2, 1.5% Ni-TiO2 and 2% Ni-TiO2. The pore size of the catalyst may play a major factor in removing the dye form aqueous solution.

ACKNOWLEDGMENTS

The Authors wishes to express their profound gratitude to Umaru Musa State university, Katsina state Nigeria for carrying out the Scan Electron Microscopy (SEM) and X-Ray Diffraction (XRD) and Ahmadu Bello Univrsity Zaria for carrying out X-Ray fractometer and Band-gap energy analysis.

References

[1]  Arshlan-Alaton (2007). Degradation of commercial textile biocide with Advanced Oxidation Processes and Ozone. J. Environ Manag. 82(2), 145-154.
[2]  Visinescu C. M, Sanjines R., Levy F, and Parvulescu V. I. (2005) “Photocatalytic degradation of acetone by Ni-doped titania thin films prepared by dc reactive sputtering,” Appl. Catal. B- Environmental, vol. 60, no. 3–4, pp. 155–162, 2005.
[3]  Forgacs E, Cserhati T, Oros G (2004) Removal of synthetic dyes from wastewaters: a review. Environ Int 30: 953–971.
[4]  Ganesh, I., Gupta A.K., Kumar, P.., Sekhar, P.S.C., Radha, K., Padmanabham, G. and Sundararajan, G. 2012. “Preparation and characterization of Ni-doped TiO2 materials for photocurrent and photocatalytic applications”, Science World journal, in press.
[5]  Gomathi DL, Girish KS, Mohan RK, Munikrishnappa C (2009) Photo degradation of methyl orange an azo dye by advanced Fenton process using zero valent metallic iron: influence of various reaction parameters and its degradation mechanism. J Hazard Mater 164: 459–467.
[6]  Han F, Kambala VSR, Srinivasan M, Rajarathnam D, Naidu R (2009) Tailored titanium dioxide photocatalysts for the degradation of organic dyes in wastewater treatment: a review. Appl Catal A 359:25–40.
[7]  Liu, X.H., He, X.B., Fu, Y.B. 2008. Effects of doping cobalt on the structures and performances of TiO2 photocatalyst, Acta Chimica Sinica, 66 1725–1730.
[8]  Ahmed M. A. (2012). “Synthesis and structural features of mesoporous NiO/TiO2 nanocomposites prepared by sol–gel method for photodegradation of methylene blue dye,” J. Photochem. Photobiol. A Chem., vol. 238, no. 0, pp. 63–70, 2012.
[9]  Ahmed M. A., El-Katori E. E., and Gharni Z. H. (2018) “Photocatalytic degradation of methylene blue dye using Fe2O3/TiO2 nanoparticles prepared by sol–gel method,” J. Alloys Compd., vol. 553, pp. 19–29, 2013.
[10]  Martı´nez Huitle CA, Brillas E (2009) Decontamination of wastewaters containing synthetic organic dyes by electrochemical methods: a general review. Appl Catal B 87: 105–145.
[11]  O ¨ zcan A, Oturan MA, Oturan N, Sahin Y (2009). Removal of acid orange 7 from water by electrochemically generated Fenton’s reagent. J Hazard Mater 163:1213–1220.
[12]  Pouran S.R, Aziz A.A, David W.M.A.W, Shafeeyan M.S (2015). Effect of Niobium and Molybdenum impregnation on adsorption capacity and fenton catalytic activity of magnetic RSC Adv. 5(106), 87535-87549.
[13]  Rawal S.B, Ojha D.P, Choi Y.S, Lee W.I (2014). Coupling of W-doped SnO2 and TiO2 for effluent visible-light photocatalysis. Bull Korean Chem Soc. 35(3), 913-918.
[14]  Yan-Hua Peng, Gui-Fang Huang, Wei-Qing Huang (2012). Visible-light absorption and photocatalytic activity of Cr- doped TiO2 nanocrystal films. International journal of Advanced powder Technology, 23(1) 8-12.
[15]  Zhang W, Yang B, Chen J (2012). Effect of calcination temperature on preparation of boron doped TiO2 by sol-gel method. Int. J. Photoenergy.
[16]  Akpan, U.G. and Hameed, B.H., (2009). Parameters affecting the photocatalyti degradation of dyes using TiO2-based photocatalysis: A review, joural of Hazardeous material, 170 pp 520-529.
[17]  Baran, W., Makowski, A., Wardas, W (2008). The effect of Uv radiation absorption of cationic and anionic dye solutions on their photocatalytic degradation in the presence of TiO2, dyes pigment. 76; pp 226-230.
[18]  Xiao, Q. Zhang, J. Xiao, C. Si, Z. and Tan, X. (2008). Solar photocatalytic degradation of methylene blue in carbon-doped TiO2 nanoparticles suspension,” Solar Energy, vol. 82, no. 8, pp. 706–713.
[19]  Akpan, U.G. and Hameed, B.H., (2009). Parameters affecting the photocatalytic degradation of dyes using TiO2-based photocatalysis: A review, joural of Hazardeous material, 170 pp 520-529.
[20]  Fox, M.A and Dulay, M.T. (1993). Heterogeneous photocatalysis. Chemistry. Reviewed. 93; pp 341-357.
[21]  Goncalves, M.S.T., Oliveira-Campos, A.M.F., Pinto, E.M.M.S., Plasencia, P.M.S., Queiroz, M.J.R.P. (1999). Photochemical treatment of solution of azo dyes containing TiO2. Chemosphere 39, pp. 781-786.
[22]  Tang, W.Z. An, H. (1995). Photocatalytic degradation kinetics and mechanism of acidv blue 40 by TiO2/UV in aqueous solution, Chemosphere 31pp 4171–4183.
[23]  Konstantinou, K.I, and Albanis, T.A. (2004). “TiO2-assisted photocatalytic degradation of azo dyes in aqueous solutions: Kinetic and mechanistic investigation n: A review; Journal of applied catalysis B: Environmental, vol. 49, pp. 1-14.
[24]  Saquid, M., Muneer, M. (2008). Dyes pigments 56; pp. 49.
[25]  Sun, H. Wang, S. Ang, H.M. Tad´e, M.O. and Li, Q. (2010). Halogen element modified titanium dioxide for visible light photocatalysis, Chemical Engineering Journal, vol. 162, no. 2, pp. 437–447.
[26]  Liu A. R., Wang, S. M. Zhao, Y. R. and Zheng, Z. (2006) “Lowtemperature preparation of nanocrystalline TiO2 photocatalyst with a very large specific surface area,” Materials Chemistry and Physics, vol. 99, no. 1, pp. 131–134, ISRN Materials Science 15.
[27]  Baran, W., Makowski, A., Wardas, W (2008). The effect of Uv radiation absorption of cationic and anionic dye solutions on their photocatalytic degradation in the presence of TiO2, dyes pigment. 76; pp 226-230.
[28]  Akpan, U.G. and Hameed, B.H., (2009). Parameters affecting the photocatalytic degradation of dyes using TiO2-based photocatalysis: A review, joural of Hazardeous material, 170 pp 520-529.
[29]  Devi, L. G. Murthy, B. N. and Kumar, S. G. (2010). Photocatalytic activity of TiO2 doped with Zn2+ and V5+ transition metal ions: influence of crystallite size and dopant electronic configuration on photocatalytic activity,” Materials Science and Engineering B, vol. 166, no. 1, pp. 1–6.