-
Paper Information
- Paper Submission
-
Journal Information
- About This Journal
- Editorial Board
- Current Issue
- Archive
- Author Guidelines
- Contact Us
American Journal of Chemistry
p-ISSN: 2165-8749 e-ISSN: 2165-8781
2019; 9(5): 142-149
doi:10.5923/j.chemistry.20190905.02

Adsorption of Rhodamine B onto Orange Peel Powder
 Abstract
 Reference
 Full-Text PDF
 Full-text HTML
Abia Daouda1, 2, Amana Tokodne Honorine1, Noumi Guy Bertrand1, Domga Richard3, Domga3
1Department of Chemistry, Faculty of Science University of Ngaoundere, Cameroon
2Chemical Engineering and Mineral Industries School of University of Ngaoundere, Cameroon
3Department of Applied Chemistry, ENSAI, University of Ngaoundere, Cameroon
Correspondence to: Abia Daouda, Department of Chemistry, Faculty of Science University of Ngaoundere, Cameroon.
| Email: |  |
Copyright © 2019 The Author(s). Published by Scientific & Academic Publishing.
This work is licensed under the Creative Commons Attribution International License (CC BY).
http://creativecommons.org/licenses/by/4.0/

Adsorption studies of Rhodamine B (Rh B) on various raw materials and thermally modified biosorbent were carried out by batch experiments. The influence of major parameters governing the efficiency of the process such as, initial dye concentration, adsorbent dose, pH, contact time and temperature on the removal of process where explored. The linear regression coefficient R2 was used to clarify the best adjustment isotherm model. All isotherm models, Langmuir, Temkin, Dubinin and Freundlich were found to be best adapting models. The monolayer adsorption capacities (qm) vary between 10.101 to 10.172 mg/g for adsorbents PPOAT and PPOAS. The Lagergen pseudo-second order model best fits the kinetics of adsorption and the correlation coefficient R2 for second order model has very high values of R2 for the PPOAT, PPOAA, PPOAS (R2 =0.999, 0.994 and 0.979 respectively) and qe (cal) values are in good harmony with qe (exp). Its shows that adsorption of Rh B on these orange peels powders activated thermally and chemically follow the kinetics second order and chemisorption playing roll in speed determinant step. Adsorption of Rh B on adsorbents was found to decrease on increasing pH, increasing temperature and increasing adsorbent dose. Thermodynamic analysis proved that adsorption was exothermic, spontaneous physisorption, and decreased disorder at the interface of Rh B with biosorbents.
Keywords: Adsorption isotherm, Kinetics, Orange peels powders, Rhodamine B, Thermodynamic parameters
Cite this paper: Abia Daouda, Amana Tokodne Honorine, Noumi Guy Bertrand, Domga Richard, Domga, Adsorption of Rhodamine B onto Orange Peel Powder, American Journal of Chemistry, Vol. 9 No. 5, 2019, pp. 142-149. doi: 10.5923/j.chemistry.20190905.02.
Article Outline
1. Introduction
- Textile industry uses wide capacity of water in hail treatment functioning and so, creates considerable quantities of wastewater containing large rising of dissolved dyestuffs and further products, such as dispersing agents, dye bath shippers, salts, emulsifiers, flattening agents and dull metals [1]. Majority of this dyes are artificial or synthetic and chemically and thermally stable, non-biodegradable. Colored dyestuffs are not only esthete, carcinogenic but also fetter light acumen and perturb period processes of living organisms in water [2]. Hence, the rapt of such colored agents from aqueous effluents is necessary. Rhodamine B (Rh B), a basic dye, is very used for the tincture of tissues, cotton, wool, silk, nylon, paper, leather, in color lasers and pigment in pharmaceutical and cosmetic preparation [3,4], etc., between all other dyes of its category. Indeed, Rhodamine B behoves to xanthene class of dyestuff. Hence, it is necessary to exclude these dyes from textile effluent before it is discarded into receiving water bodies [5]. The studies have been conducted in aim to put away color and other pollutions using various types of methods include ozonation, addition of reducing agents, Fenton’s method, membrane filtration, ion-exchange, and adsorption methods where their advantage and disadvantage are extensively discussed in literature [6-10], etc., in which adsorption is most useful due to its simplicity and efficacy. Although, activated carbon adsorption arises to be the one of the most used techniques for dye removal, but because of the relatively high cost and regeneration problems, researchers have developed many technics for alternate low cost adsorbents. The adsorbents were prepared from natural materials such as waste of coffee [11], waste of tea [12], straw of soybeans [13], fly ash [14], walnut shell [15], timber sawdust [16] used for removal of color. Several low cost materials were used for the manufacture of the modified biosorbent; in this research, a local waste, the orange peel powder, was used to produce thermally activated orange peel powder (PPOAT) and chemically activated orange peel powder using phosphorous acid (PPOAA) and sodium hydroxide (PPOAS) for adsorption of Rh B from wastewater.
2. Materials and Methods
2.1. Adsorbents
- Adsorbents used in the present study are:1. Orange peels powders thermally activated (PPOAT)2. Orange peels powders activated to the soda (sodium hydroxide) (PPOAS)3. Orange peels powders activated to the acid (H2SO4) (PPOAA) The materials from the above biosorbents were collected from Ngaoundere Adamawa region of Cameroon and thoroughly washed to remove foulness. Washed materials were dried in an etuve operated at 45°C and a solar energy overnight [17,18]. They were then pulverized and screened into a particle size lower or equal of 1 mm before; they were stored in an airtight container for subsequent use.
2.2. Synthetic Textile Dye Solution
- Rhodamine B (Rh B) is a cationic basic dye with a molecular Formula C28H31ClN2O3. It has a molecular weight of 479.01 g/mol and the structure is:
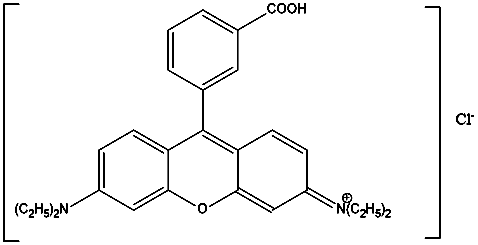 | Figure 1. Chemical structure of Rhodamine B |
2.3. Adsorbent Characterization
2.3.1. Specific Surface Area
- This method (model BET) consist to determinate the necessary amount of methylene blue (MB) to cover a monomolecular layer of the external and internal surfaces of the fine particles of a solid suspended in water.
2.3.2. Iodine Indices
- Iodine number is used to measure the porosity of pores with diameters greater than 1nm. The iodine indices of adsorbents were determinated according to the protocole applied by Tchakala et al., in 2012 [19].
2.3.3. Point of Zero Charge
- The point of zero charge (pHpzc) was determined using the salt addition method [20]. The pH of solution of 0.01 M NaCl was adjusted between 2-12 by using HCl or NaOH then we add 0.2 g of the adsorbents. The containers were sealed and placed on a shaker for 48 hours at ambient temperature after which the final pH values were measured. The graph of final pH (pHf) versus initial pH (pH0) was used to determine the point at which initial pH and final pH of adsorbents solution were equal. At this point, (pHpzc), the surface of adsorbent is neutral.
2.3.4. pH Determination
- The standard test method for determination of activated carbon pH ASTMD 3838-80 was used. About 1.0 g of the prepared adsorbent was weighed and transferred into a beaker; 100 cm3 of distilled water was added and the mixture was stirred for 24 hours. The suspension was allowed to equilibrate and the pH was measured there after with a pH-meter (VOLTCRAFT).
2.4. Batch Adsorption Experiments
- Batch experiment used in this study was generally carried out by mixing adsorbents (0.01 g) with Rh B solution (50 mL) of specific concentration in Erlenmeyer flasks and agitated at 250 rpm for a certain period of time at room ambient temperature. The concentration of the dye after agitation was analysed using UV-visible spectrophotometer (RAYLEIGH) at wavelength of 554 nm.In this study, parameters such as contact time (0- 40 min), dosage (0.01–0.11 g), pH (2–10), initial concentration (5–35 mg L-1 Rh B) and temperature (7–42°C) were measured in order to investigate their effects on the adsorption of Rh B onto adsorbent. The amount of dye adsorbed per gram of adsorbent at equilibrium, qe (mg g−1), is calculated using the following equation [21]:
 | (1) |
2.5. Methods
- Standard solution (10 mg/L) of the Rh B was taken and absorbance was determined at different wavelengths using UV-visible spectrophotometer (RAYLEIGH) to obtain a plot of absorbance verses wavelength. The wavelength correspondent to the maximum absorbance (λmax = 554 nm) as identified from the plot. pH of solutions were adjusted using 0.1M HCl and 0.1M NaOH by VOLTCRAFT pH-meter.The efficacy of adsorbents is estimated by leading laboratory batch mode studies. Specific quantity (0.01 g) of adsorbents were agitated in 50 mL aqueous solution of dye of variable concentration for different time periods at natural pH (7.12) and temperature (298K). At the end of determined time intervals, supernant was analyzed for the residual concentration of Rh B, spectrophotometrically at 554 nm wavelength. Even variation in pH, adsorbent dose, and temperature were studied.
2.5.1. Effect of Contact Time
- 0.01 g of adsorbent less than 200 µm size with 50 mL of dye solution was maintain constant for batch experiments with an initial dye concentration of 10 mg/L (for PPOAT, PPOAA, PPOAS) were executed at 298K on a magnetic agitator at 250 rpm for 5, 10, 20, 30 and 40 minutes at pH = 7.12. Then optimum contact time was identified for facility batch experimental study.
2.5.2. Effect of Adsorbent Dosage
- Initial dye concentration of 10 mg/L was used in combination with adsorbent dose of 0.01, 0.03, 0.05, 0.07, 0.09 and 0.11 g. Contact time, pH, and temperature of 10 and 20 minutes (PPOAT and PPOAA, PPOAS), 7.12, and 298K respectively were keep constant.
2.5.3. Effect of Initial Dye Concentration
- Initial dye concentration of 5, 10, 15, 20, 25 and 30 mg/L were used in slip with adsorbent dose of 0.01 g. Contact time (10 minutes for PPOAT and 20 minutes for PPOAA, PPOAS), pH (7.12), and temperature (298K) were keep constant.
2.5.4. Effect of pH
- Initial pH of dye solutions were adjusted to 3, 5, 7 and 11 for 10 mg/L concentration. Contact time, adsorbent dose, pH, temperature of 10 and 20 minutes ( for PPOAT and PPOAA, PPOAS), 0.01 g, 7.12, and 298K respectively were keep constant.
2.5.5. Effect of Temperature
- 280K, 295K and 315K temperatures were used in conjunction with 10 mg/L dye concentration. Contact time, adsorbent dose, and pH of 10 and 20 minutes (PPOAT and PPOAA, PPOAS), 0.01 g and 7.12, respectively were keep constant.
3. Results and Discussions
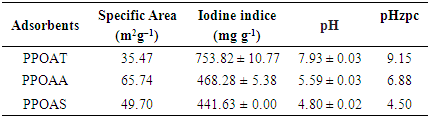
3.1. Characterisations of Adsorbent
|
3.2. Effect of Contact Time and Initial Concentration
- Effect of contact time and initial concentration on adsorption of Rh B were presented in Figures 2 and 3. Uptake of Rh B was rapid in first minutes before of tender to saturation at 10 minutes for PPOAT and 20 minutes for PPOAA and PPOAS. The adsorption at different dye concentrations was rapid at the initial stages then stabilizes by forming a bearing. This rapid adsorption at the initial contact time can be attributed to a large number of surface sites are available for adsorption at the initial stages and after a lapse of time, the adsorption becomes less due to a slower diffusion of the speckles dissolved through the pores of the adsorbent [9,24]. This increase in concentration is due to the increase of attraction forces of the concentration gradient [9,10,25,26]. For these author’s, the effect of the initial concentration of dye factor depends on the immediate relation between the concentration of the dye and the available binding sites on an adsorbent surface. There is also a possibility of transportation of the dye molecules within the pores of the active carbon; this can be attributed to a gradient increase of the driving force with the increase of the initial concentration dye.
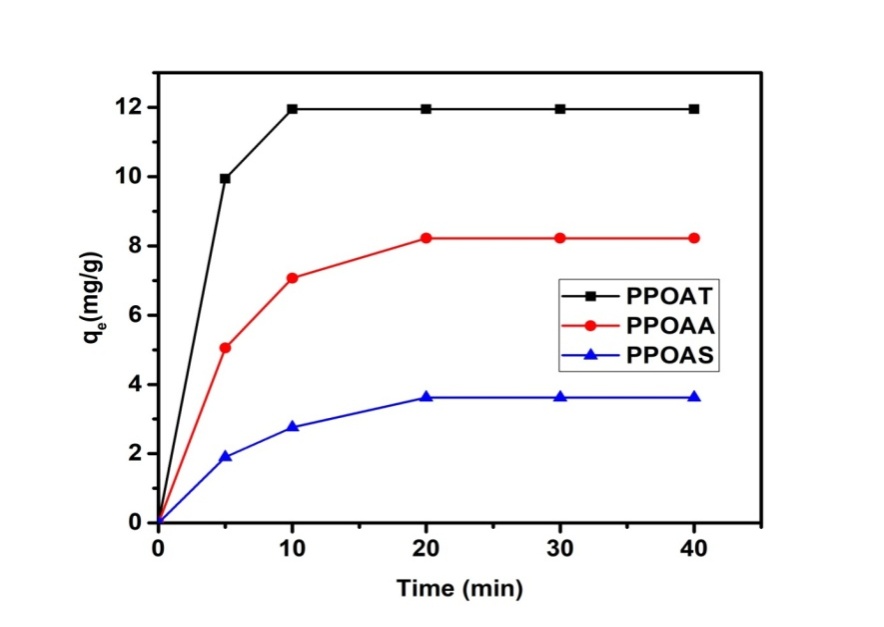 | Figure 2. Effect of contact time on adsorption of Rh B |
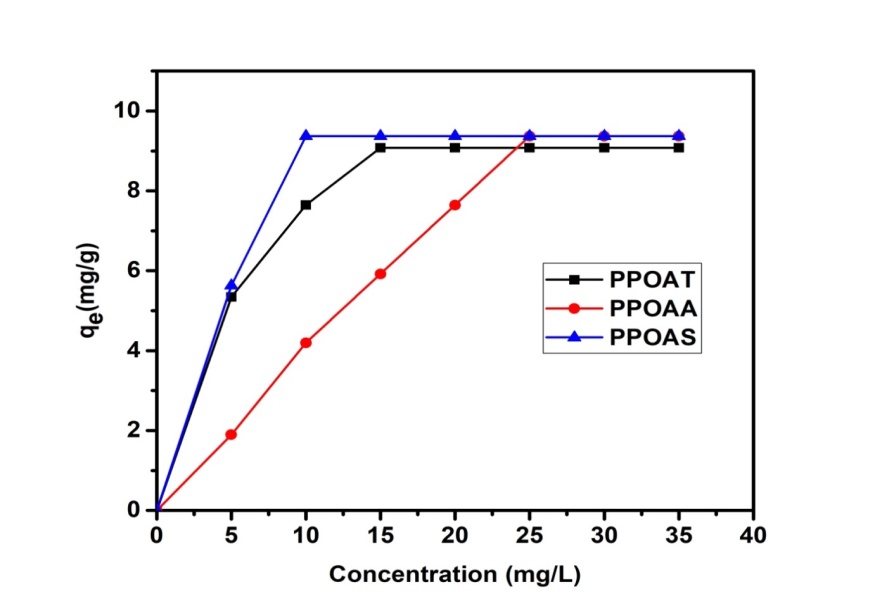 | Figure 3. Effect of the initial dye concentration on adsorption of Rh B |
3.3. Effect of Adsorbent Dosage
- The adsorption capacity decreases with increase of adsorbent dose (0.01-1.11 g) hence the amount of adsorbed Rh B per unit mass decreases. This can be explained firstly by the interaction between the adsorbent molecules which leads to the desorption of Rh B molecules from the narrow sites of the adsorbent [27] and on the other hand the reduction of the specific surfaces due to the formation of an aggregation/agglomeration of the particles of adsorbents [9,10]. This decreases could also be explained by the unsaturation of the adsorption sites [28]. Similar result has been obtained by Domga et al., 2015; Zheng et al., 2009 [9,29]. These results show that for an increase in each adsorbent dosage, the adsorbent sites available upon the dye molecules also increase and consequently poor adsorption. Another consequence is the reduction of active sites at the surface of the absorbents and also the matter rate transfer of the dye at the surface of the absorbents, this means that the quantity of the dye adsorbed per unit mass of adsorbent has it limit with the adsorbent dosage.
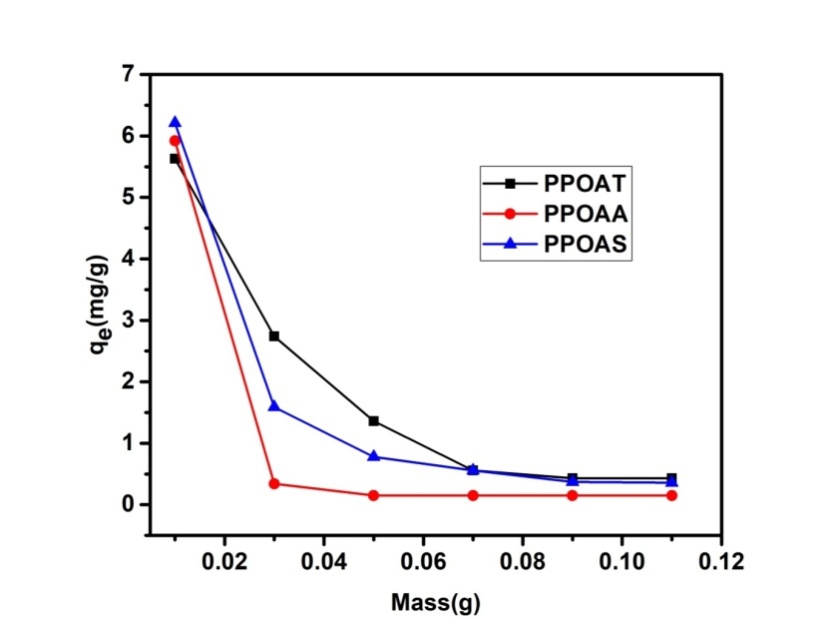 | Figure 4. Effect of adsorbent dose on adsorption of Rhodamine B, [Rh B] =10 mol. L-1, T= 25°C, pH =7.12 |
3.4. Effect of pH
- pH is one of the important parameter in determining the adsorption efficiency since it affects the surface charge properties of the adsorbent and influences the behaviour of adsorbate ions into the solution [30]. Initial pH of dye solutions were adjusted using sodium hydroxide (1 N). Uptake of Rh B from 10 mg/L concentration on given adsorbents was studied as a function of pH 3, 5, 7 and 11. The amount of dye adsorbed per unit mass of adsorbent at equilibrium (qe) decreased with increased in pH with optimal uptake at pH = 3. At this pH optimal, the surface of our adsorbents is positively charged because when the pH < pHpzc, the adsorbent surface becomes positively charged and thus attracts the ionic form of RhB dye causing enhanced adsorption at pH lower than pHpzc value [31]. The decrease of the adsorbed quantity can be explained by the nature of the material used [32] and by the chemical functions presented on the surfaces of our materials. These results corroborate those obtained by Domga et al., 2015 [9].
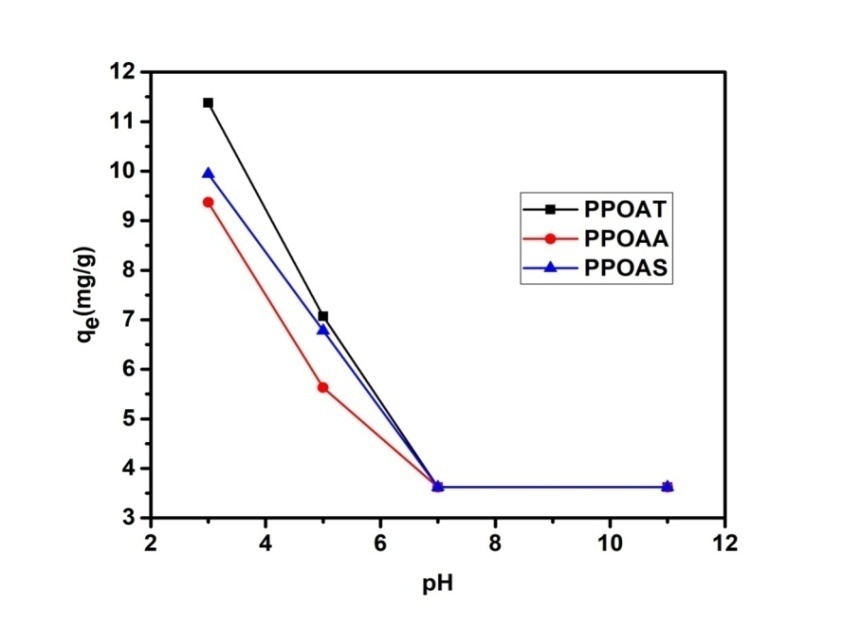 | Figure 5. Effect of pH on adsorption of Rhodamine B |
3.5. Effect of Temperature
- Temperature has important factors on adsorption phenomena. Adsorption of Rh B at three different temperatures (280 K, 295 K and 315 K) onto biosorbents was studied for 10 mg/L initial Rh B concentration. The results showed that the quantity of Rhodamine B decreases with increasing temperature (figure 6). This may be explained that the adsorption process is exothermic in nature. Similar result has been obtained by Boumchita et al., 2016 [33] when removing methylene blue from potato peelings.
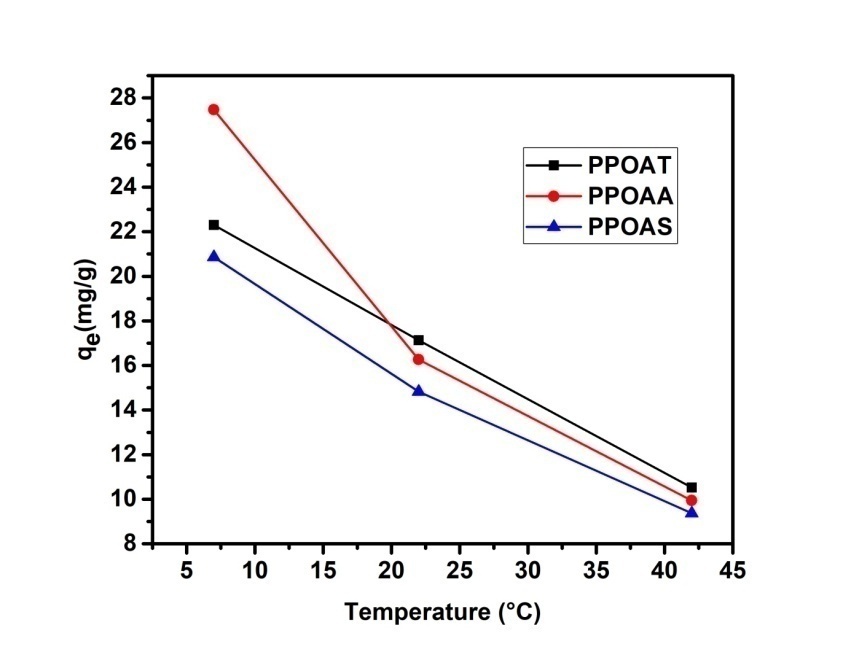 | Figure 6. Effect of temperature on adsorption of Rhodamine B |
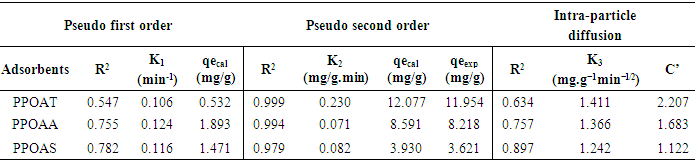
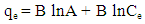
3.6. Kinetics of Adsorption
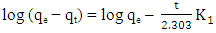
- Three kinetics models [pseudo-first-order [34], pseudo-second-order [35] and Weber–Morris intraparticle diffusion [36] models] were used for characterising the kinetics data.The pseudo-first-order is typically expressed as:
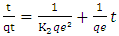
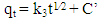
 | (2) |
 | (3) |
 | (4) |
|
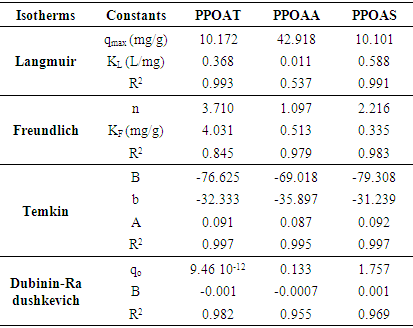
3.7. Adsorption Isotherms
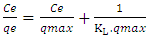
- In order to establish the relationship between the adsorption capacity and nature of adsorption for an adsorbate-adsorbent system since it explains the mechanism of adsorption and assists in optimizing the adsorption process. Four isothermal models were fitted to know: Langmuir and Freundlich. As per Langmuir, adsorption takes place at homogenous sites of adsorbent [37], while Freundlich presumes heterogeneous surface of adsorbent with non-uniform dissemination of heat of adsorption over the surface [38]. The applicability of the isotherm equation is compared by judging the correlation coefficients, R2. Langmuir and Freundlich isothermal models are represented by equations (5) and (6). The Langmuir isotherm is:
 | (5) |
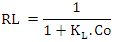 Where C0 is the highest initial dye concentration in solution. The adsorption process is said to be favourable if RL value falls between 0 and 1, that is to say (0 < RL <1), linear when RL = 1, irreversible when RL = 0 and unfavourable when RL > 1.The Freundlich equation was employed for the adsorption of Rhodamine B dye on the adsorbent. The Freundlich isotherm was represented by:
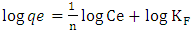 | (6) |
 | (7) |
 | (8) |
 is the Polanyi potential.
  is expressed by equation 9:
 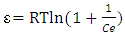 | (9) |
 , respectively. The adsorption parameters according to the Freundlich, Langmuir, Temkin and Dubinin equations are summarized in Table 3 below.
|
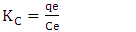
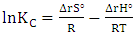
3.8. Thermodynamics Parameters
- Thermodynamics parameters, namely free energy (∆G°), enthalpy (∆H°) and entropy (∆S°) are important in determining the feasibility, spontaneity and the nature of adsorbate-adsorbent interactions can be obtained by using the following mathematical relations:
 | (10) |
 | (11) |
 | (12) |
|
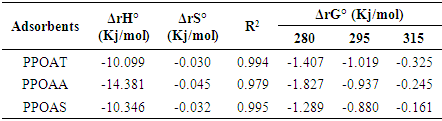
4. Conclusions
- The objective of this study was used of different natural materials as adsorbents for the removal of Rhodamine B. Langmuir, Freundlich, Temkin and Dubinin-Radushkevich were found to the better adjustment models with respect to R2 values. The monolayer (maximum) adsorption capacities (qm) were found to be 10.101 to 10.172 mg/g for adsorbents PPOAT and PPOAS. Lagergen pseudo-second order model best fits the kinetics of adsorption. The correlation coefficient R2 for second order model has very high values of R2 for the PPOAT, PPOAA, PPOAS (R2 =0.999, 0.994 and 0.979 respectively) and qe(cal) values are in good harmony with qe(exp) indicated that pseudo second order adsorption equation of Langergen fit much with whole interval of contact time. Intra-particle diffusion plot indicated limit layer effect and greatest intercepts indicates greater contribution of area sorption in rate determining step. Adsorption of Rh B on adsorbents was found to decrease on increasing pH, increasing temperature and increasing adsorbent dose. The values of thermodynamic parameters, the standard enthalpy (∆rH°), standard Gibbs energy (∆rG°) and entropy (∆rS°) showed exothermic, spontaneous physisorption and decreased disorder at the interface of Rh B with biosorbents. Adsorption capacities of different adsorbents towards Rh B were found to be of the order in function of contact time: PPOAT > PPOAA > PPOAS; adsorbent dose: PPOAS > PPOAA > PPOAT; pH: PPOAT > PPOAS> PPOAA; initial concentration: PPOAS > PPOAT > PPOAA; temperature: PPOAA > PPOAT > PPOAS.