Abdoulaye Djandé1, Akoun Abou2, Jules Yoda1, Stéphane Coussan3, Adama Saba1
1Department of Chemistry, Laboratory of Molecular Chemistry and Materials, Research Team: Organic Chemistry and Phytochemistry, University Joseph KI-ZERBO, Ouagadougou, Burkina Faso
2Department of Training and Research in Electrical and Electronic Engineering, Research Team: Instrumentation, Image and Spectroscopy, Félix Houphouët-Boigny National Polytechnic Institute, Yamoussoukro, Côte d’Ivoire
3Departement of Chemistry, Laboratory: Physics of ionic and molecular Interactions (PIIM), CNRS/Aix-Marseille University, UMR, Marseille, France
Correspondence to: Abdoulaye Djandé, Department of Chemistry, Laboratory of Molecular Chemistry and Materials, Research Team: Organic Chemistry and Phytochemistry, University Joseph KI-ZERBO, Ouagadougou, Burkina Faso.
| Email: |  |
Copyright © 2019 The Author(s). Published by Scientific & Academic Publishing.
This work is licensed under the Creative Commons Attribution International License (CC BY).
http://creativecommons.org/licenses/by/4.0/

Abstract
Compound (I), 2-oxo-2H-chromen-7-yl 4-chlorobenzoate, was synthesized by linking the coumarin system (7-hydroxycoumarin) to a 4-chlorobenzoyl chloride. ESI-MS, FT-IR, 1H and 13C NMR spectroscopic analysis and X-ray diffractometry determined the molecular structure of this 7-substituted coumrin derivative. In the latter, the structure of (I) was solved by direct methods and refined to a final R value of 0.035 for 2416 independent reflections. In the structure, the benzene ring is oriented at an acute angle of 58.80 (13)° relative to the planar coumarin system [r.m.s deviation = 0.017 Å]. This conformation is stabilized by an intramolecular C—H…O hydrogen bond, which closes a five-membering ring. The molecules of the studied compound are linked by intermolecular C—H…O hydrogen bonds forming an undulating network along the b-axis direction. Besides, the crystal structure is supported by π–π stacking interactions between neighboring benzene and pyrone or coumarin rings [centroid–centroid distances in the range 3.5695(13)–3.5914(16) Å], as well as C=O···π interactions [O···centroid distances in the range 3.366(4)–3.387(4) Å]. The molecular geometry of (I) was also optimized using density functional theory (DFT/RB3LYP), restricted Moller-Plesset perturbation theory (RMP2) methods with the 6-311++G(d, p) basis set in ground state and frequency calculations using RB3LYP method with 6-31G(d) basis set. The theoretical data resulting from these quantum chemical calculations are in good agreement with the observed structure. The only observed difference in the torsion angles is between the coumarin ring system and the benzoate ring, where the observed C—O—C—C value (65.3 (4)°) is slightly lower than the RMP2 computed value (68.34°) and larger than that of the DFT/RB3LYP calculated value (55.47°) and the frequency calculations (44.08°) value. Molecular orbital calculations providing electron-density plots of HOMO and LUMO molecular orbitals have been computed with the DFT/B3LYP/6–311++G(d,p), RMP2/6–311++G(d,p) and FREQ/ B3LYP/6–31G(d) basis sets whereas molecular electrostatic potentials (MEP) were determined at the DFT/B3LYP/6–311++G(d,p) and FREQ/ B3LYP/6–31G(d) levels. The theoretical HOMO–LUMO energy gap values originating from these calculations are 4.44 eV (DFT/B3LYP/6–311++G(d,p)) and 4.40 eV (FREQ/ B3LYP/6–31G(d)). Hirshfeld surface analysis has been used to confirm and quantify the supramolecular interactions.
Keywords:
7-substituted coumarin derivative, Spectroscopic analysis, Crystal structure, Conformational analysis, Hirshfeld surface analysis, Quantum chemical calculations
Cite this paper: Abdoulaye Djandé, Akoun Abou, Jules Yoda, Stéphane Coussan, Adama Saba, Synthesis, Spectrometric Characterization, X-Ray Study and Quantum Chemical Calculations of 2-oxo-2H-chromen-7-yl 4-chlorobenzoate, American Journal of Chemistry, Vol. 9 No. 5, 2019, pp. 127-141. doi: 10.5923/j.chemistry.20190905.01.
1. Introduction
Coumarin derivatives represent a large group of naturally occurring compounds and are also important in synthetic organic chemistry. They have been widely used in the pharmaceutical, perfumery and agrochemical industries as starting materials or intermediates for the synthesis of various compounds that have been reported to possess a wide range of biological activities [1-3], including, among others, anti-bacterial [1], antioxidant [2] and anti-inflammatory properties [3].In view of their importance and as a continuation of our research in the field crystal structure analysis and theoretical calculations of new coumarin derivatives [4,5], we herewith report the synthesis, spectroscopic characterization, crystal structure, geometry optimization and Hirshfeld surface analysis of the title ester derivative of coumarin scaffold (I).
2. Experimental and Theoretical Methods
2.1. Synthesis
To a solution of 4-chlorobenzoyl chloride (6.17 mmol; 0.8 ml.) in anhydrous tetrahydrofuran (40 ml), was added dried trimethylamine (3 molar equivalents; 2.6 ml) and 7-hydroxycoumarin (6.17 mmol; 1g) by small portions over 30 min. The mixture was refluxed for 4 hours and then poured into 40 ml of dichloromethane. The solution was acidified with diluted hydrochloric acid until the pH was 2–3. The organic layer was extracted, washed with water to neutrality, dried over MgSO4 and the solvent removed. The crude product was filtered off with suction, washed with petroleum ether and recrystallized from chloroform, to give the title compound as pale yellow crystals. Yield: 91%; m.pt: 498−500 K.
2.2. Electrospray Ionisation Mass Spectrum
Mass spectrometry is a highly valuable technique in the field of structural chemistry. Electrospray ionization mass spectrometry (ESI-MS), with an accuracy of about 0.01%, provides an extremely sensitive method for determining the precise molecular mass of small and biological molecules. The spectrum of figure 1 was recorded on a 3200 QTRAP (Applied Biosystems SCIEX) spectrometer equipped with a pneumatically assisted air pressure ionization (API) source for ESI-MS+ experiment.
2.3. IR Spectrum
The infrared (IR) spectrum, Figure 2, was recorded on a Bruker IFS 66/S Fourier Transform Infrared spectrometer (FT-IR), driven by the OPUS 6.5 software and using the ATR (Attenuated Total Reflection) technique. The absorption bands are expressed in wavenumber ῡ (cm−1).
2.4. 1H and 13C Spectra
The 1H- and 13C- NMR spectra (figures 3 and 4) were recorded on a Bruker AMX spectrometer at 500 and 100 MHz respectively, using CDCl3 as deuterated solvent. Chemical shifts were reported in δ (ppm) values downfield from tetramethylsilane (TMS) as internal standard; coupling constants (J) were given in Hertz.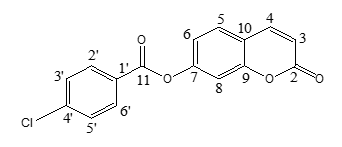 | Scheme 1. Numbering of carbon atoms used in spectra analysis |
2.5. Crystal structure Analysis
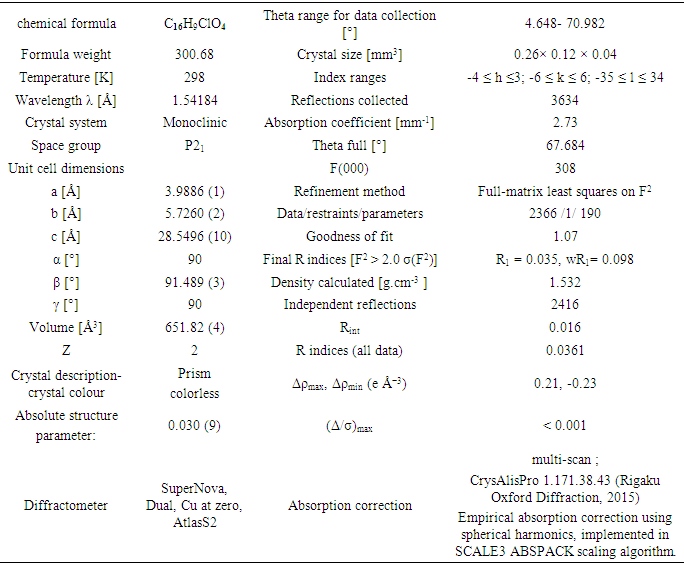
Diffraction data for the title compound were collected on Rigaku Oxford Diffraction SuperNova, Dual, Cu at zero, AtlasS2 diffractometer [6] using a mirror monochromator and Cu Kα radiation (λ = 1.54184 Å) at 298 K. The structure was solved by direct methods using SIR 2014 [7] and implemented in the WinGX [8] program suite. The refinement was carried out by full-matrix least squares method on the positional and anisotropic temperature parameters of the non-hydrogen atoms, or equivalently corresponding to 190 crystallographic parameters, using SHELXL2014 program [9]. All H atoms were placed in calculated positions with C—H = 0.93 Å (aromatic) and refined using a riding model approximation with Uiso(H) constrained to 1.2 times Ueq of the respective parent atom. Data collection is by CrysAlis PRO [6], cell refinement by CrysAlis PRO [6], and data reduction by CrysAlis PRO [6]. The general-purpose crystallographic tool PLATON [10] was used for the structure analysis and presentation of the results. Details of the data collection conditions, and the parameters of the refinement process are given in Table 1. Flack x parameter was determined using 980 quotients [(I+)-(I-)]/[(I+)+(I-)] [11] for Absolute structure determination.CCDC–1834274 contains the supplementary crystallographic data for this paper. These data can be obtained free of charge from The Cambridge Crystallographic Data Centre via www.ccdc.cam.ac.uk/data_request/cif;E-mail: deposit@ccdc.cam.ac.uk.
2.6. Hirshfeld Surface
Molecular Hirshfeld surfaces of 2-oxo-2H-chromen-7-yl 4-chlorobenzoate were calculated using a standard (high) surface resolution, and with the three-dimensional dnorm surfaces mapped over a fixed colour scale of -0.205 (red) to 1.418 a.u. (blue) with the program Crystal Explorer 3.1 [12].
2.7. Computational Procedures
The geometry optimization of compound (I) was performed by using the density functional theory (DFT) with restricted B3LYP exchange correlation functional and restricted Moller-Plesset perturbation theory (RMP2) with a 6-311++G(d,p) basis set, and vibration calculations were computed using RB3LYP method with 6-31G(d) basis set. The crystal structure in the solid state was used as the starting structure for the calculations. All calculations were performed with the GAUSSIAN09 program package [13].
3. Results and Discussion
3.1. Spectra Analysis
3.1.1. Electrospray Ionisation Mass Spectrum
In the spectrum (figure 1), the peak positions of [M+H]+, [M+NH4]+ and [M+Na]+ ions at m/z 301, m/z 318 and m/z 323 respectively, allowed us to determine the molecular monoisotopic weight of 300 g.mol-1 which is consistent with the chemical formula C16H9O4Cl.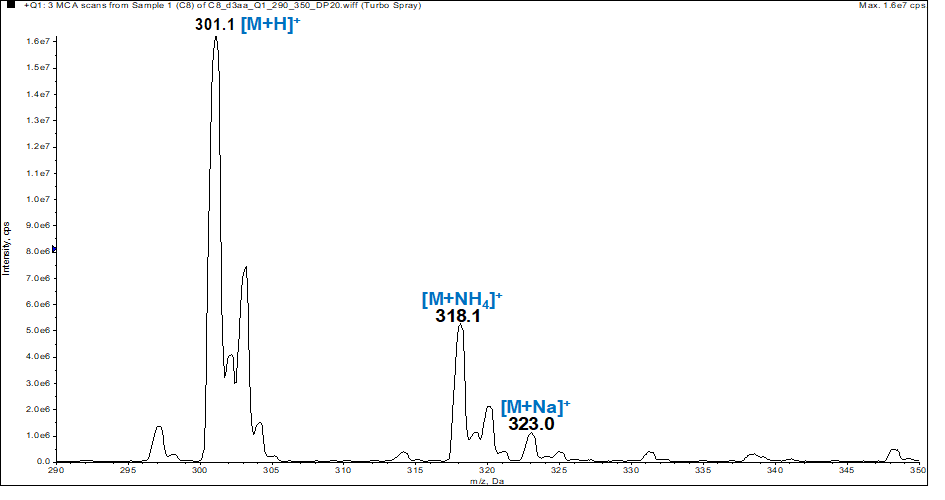 | Figure 1. ESI-MS spectrum of compound (I) |
3.1.2. Infrared Spectrum
The FT-IR spectrum of this compound (figure 2) showed two strong absorption bands at 1724.9 and 1746.4 cm-1 attributed to ῡ C=O (lactone) and ῡ C=O (ester) respectively, as well as 1092.1 and 1249.4 cm-1 assignable to ῡ C-O (lactone) and ῡ C-O (ester), respectively. The medium band at 750.0 cm-1 is due to C-Cl stretching while the aromatic ring gave a weak band at 3052.7 cm-1 (ῡ C-H) and a medium one at 1592.0 cm-1 (ῡ C=C ). A medium band appeared at 1610 cm-1 for ῡ C=C (coumarin).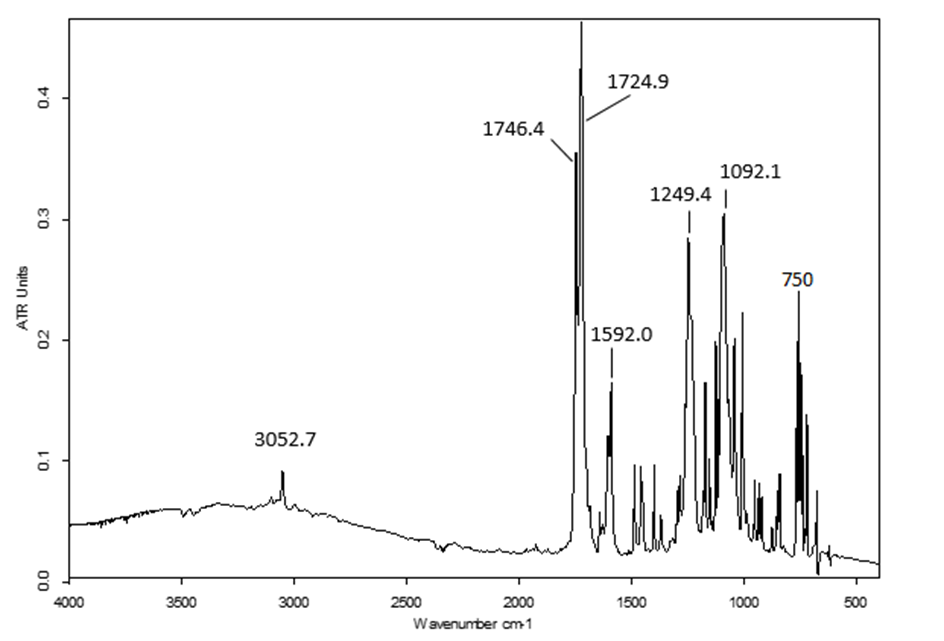 | Figure 2. FT-IR spectrum of compound (I) |
3.1.3. 1H-NMR Spectrum
The experimental values (chemical shifts and couplings) taken from the 1H NMR spectrum (figure 3) revealed the presence of doublets in the range 6-8.5 ppm corresponding exclusively to aromatic protons: 8.17 (d, 2H, J = 8.6 Hz, H-2’ and H-6’), 7.72 (d, 1H, J = 9.5 Hz, H-4), 7.55 (d, 1H, J = 8.4 Hz, H-5), 7.52 (d, 2H, J = 8.6 Hz, H-3’ and H-5’), 7.25 (d, 1H, J = 2.1 Hz, H-8), 7.18 (dd, 1H, J = 8.4, 2.1 Hz, H-6), 6.43 (d, 1H, J = 9.5 Hz, H-3).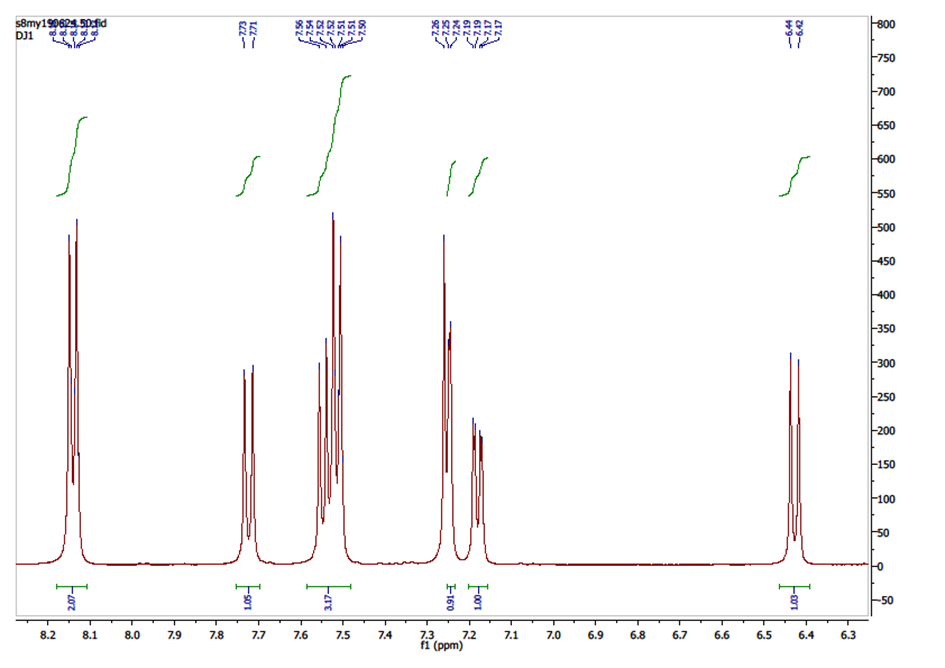 | Figure 3. 1H NMR Spectrum of compound (I) |
3.1.4. 13C-NMR Spectrum
The 13C NMR spectrum (figure 4) exhibits, as expected, fourteen peaks.Chemical shift (ppm) and the corresponding carbon: 160.42 (C-2), 116.40 (C-3), 142.96 (C-4), 128.81 (C-5), 118.59 (C-6), 154.91 (C-7), 110.79 (C-8), 153.38 (C-9), 117.02 (C-10), 163.83 (C-11), 127.35 (C-1′), 131.82 (C-2′ and C-6′), 129.29 (C-3′ and C-5′),140.87 (C-4′).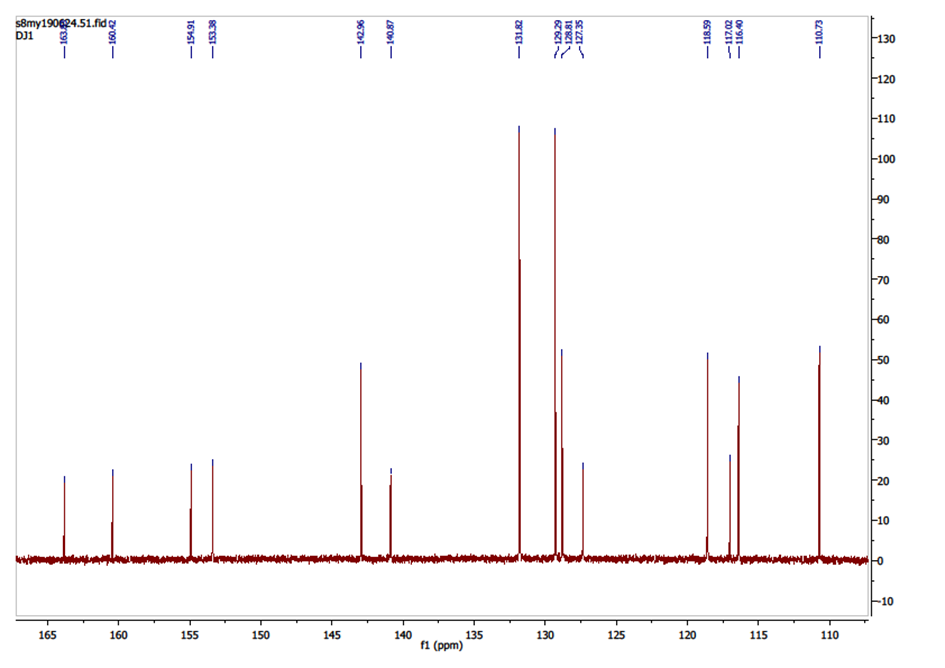 | Figure 4. 13C NMR Spectrum of compound (I) |
3.1.5. DEPT-135 Spectrum
The DEPT (Distorsionless Enhancement of Polarization Transfer) is a proton-carbon polarization transfer technique which has proven superior to others in providing information on attached protons reliably, efficiently and with high selectivity. So, The DEPT-135 spectrum presents positive CH3 and CH, and negative CH2 signals while quaternary carbons are invisible.The spectrum of compound (I) (Figure 5) showed only positive aromatic CH signals, note absence of quaternary carbons (C-2, C-7, C-9, C-10, C-11, C-1′ and C-4′). Seven peaks were observed (δ, ppm): 116.40 (C-3), 142.96 (C-4), 128.81 (C-5), 118.59 (C-6), 110.79 (C-8), 131.82 (C-2′ and C-6′), 129.29 (C-3′ and C-5′) suggesting the nine aromatic tertiary carbons.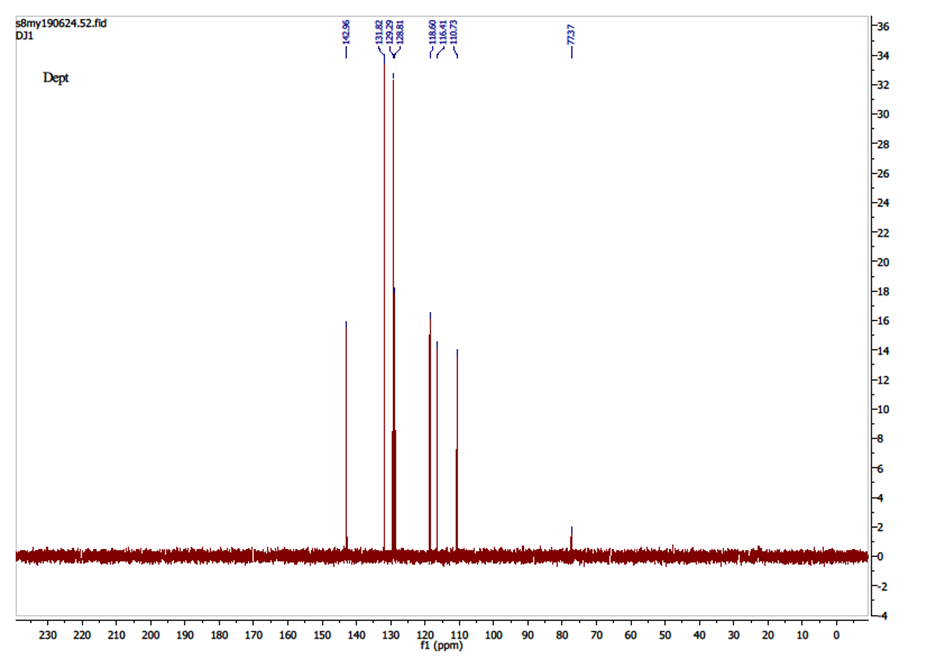 | Figure 5. DEPT-135 Spectrum of compound (I) |
3.1.6. Heteronuclear Single-Quantum Correlation (HSQC) NMR spectrum
The HSQC NMR spectrum ((Figure 6) exhibited a good correlation between each tertiary carbon (C-3, C-4, C-5, C-6, C-8, C-2′, C-6′, C-3′, C-5′) and the proton directly attached by way of 1JC-H scalar coupling; the spots obtained confirm the attributions of signals in 1H and 13C spectra.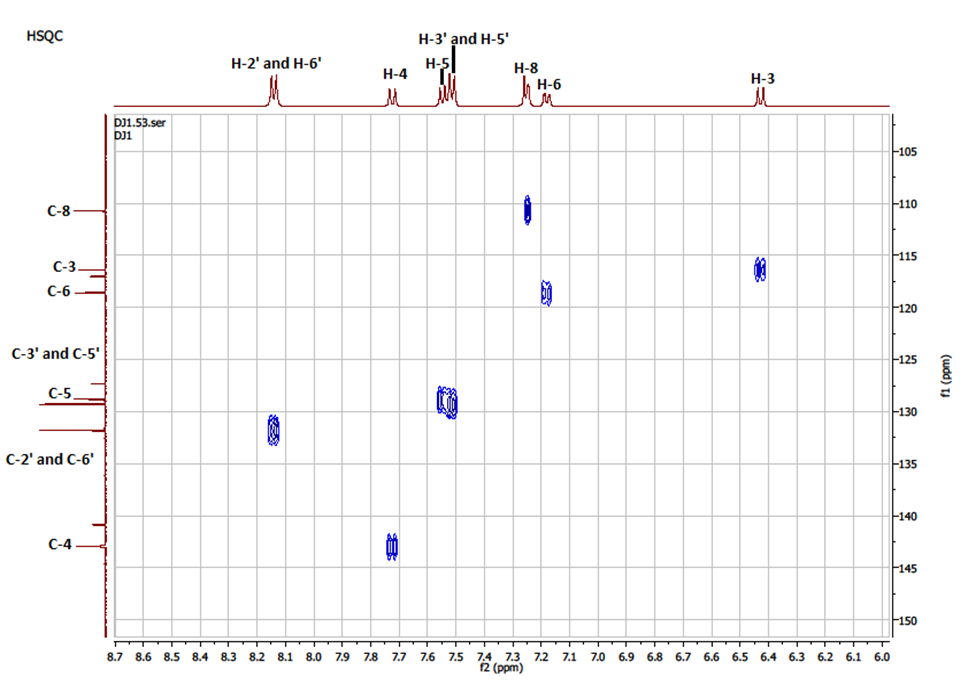 | Figure 6. NMR-HSQC Spectrum of compound (I) |
3.1.7. Conclusion of Spectra Analysis
The overlapping of the spectrometric results from the spectral analysis confirms the molecule drawn in Figure 1. Other studies such as X-ray and theoretical calculations have been used to confirm this conclusion.
3.2. Structural Description
The molecular structure of the title coumarin derivative (I), is illustrated in Figure 7.
3.2.1. Geometry and Conformation
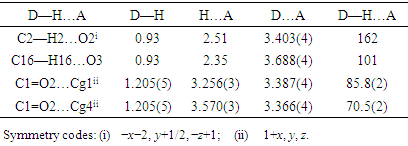
The positional parameters, interatomic distances, bond angles and torsion angles are presented in Tables 4, 5, 6 and 7. The analysis and interpretation of the geometrical characteristics relating to bond distances compared to standard values [14] indicate that carbon-oxygen bonds: [d(C1-O1) = 1.377(4) Å and d(C5-O1) = 1.384 (4) Å] are characteristic of Car-O(2) simple bond observed in other structures in alkyl ethers [15,16]. Also, the distance d(C10-O4) = 1.198 (4) Å and d(C10-O3) = 1.359 (4) Å indicate characteristic values of ester moiety. Furthermore, an inspection of the bond lengths of the coumarin ring shows that there is a slight asymmetry of the electronic distribution around the pyrone ring: the C2—C3 [1.347 (5) Å] and C1—C2 [1.438 (5) Å] bond lengths are shorter and longer, respectively, than those expected for a Car—Car bond. This suggests that the electron density is preferentially located in the C2—C3 bond of the pyrone ring, as seen in other coumarin derivatives [17,18].In the crystal structure, the planar chromene ring system (r.m.s deviation = 0.017 Å) resulting from the two coupled rings (benzene and 3,6-dihydro-2H-pyran) is oriented with respect to the benzoate-benzene ring at a dihedral angle of 58.80(13)°. Also, an S(5) ring motif [19] arise from intramolecular C16—H16…O3 hydrogen bonds (Table 1), and generate a pseudo bicyclic ring system (Figure 7). This pseudo bicyclic moiety is planar (r.m.s deviation = 0.014 Å) and makes an acute angle of 59.26 (9)° with respect to the chromene ring system.Table 1. Crystal data and details of the structure determination
 |
| |
|
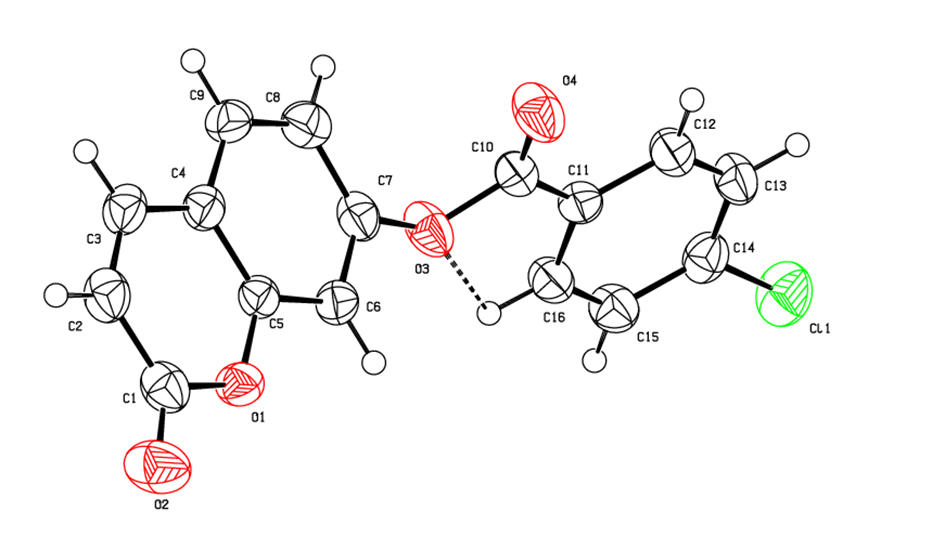 | Figure 7. An ORTEP [8] view of the title compound with the atom-numbering scheme. Displacement ellipsoids are shown at the 50% probability level. Dashed lines indicate hydrogen bonds |
3.2.2. Supramolecular Features
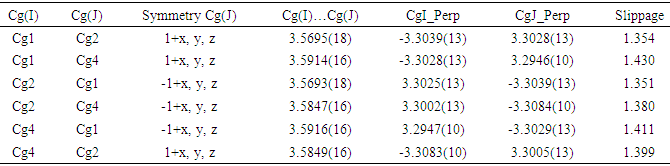
In the three-dimensional crystal packing, molecules are connected by intermolecular C—H…O hydrogen bonds forming an undulating network along the b-axis direction (Figure 8). Besides, close contacts [C1…C4(1+x, y, z) = 3.335(5) Å], [H15…O4(-1+x,-1+y,z) = 2.63 Å] are found at a distance shorter than the sum of the van der Waals radii and C1=O2…Cg1(1+x, y, z), C1=O2…Cg4(1+x, y, z) interactions are present (table 2), where Cg1 and Cg4 are the centroids of the pyrone ring and the coumarin ring system, respectively. The resulting supramolecular aggregation is completed by the presence of π–π stacking interactions between the coumarin ring system and the C4–C9 benzene and pyrone rings (Figure 9). In the latter, the centroid–centroid distances [Cg1…Cg2 (1+x, y, z) = 3.5695(18), Cg1…Cg4 (1+x, y, z) = 3.5914(16), Cg2…Cg4 (-1+x, y, z) = 3.5847(16) Å, where Cg2 is the centroid of the C4–C9 benzene ring] are less than 3.8 Å, the maximum regarded as suitable for an effective π–π stacking interaction [20]. The perpendicular distances of Cg(I) on ring J and distances between Cg(I) and perpendicular projection of Cg(J) on ring I (slippage) are summarized in Table 3.Table 2. Hydrogen-bond geometry (Å, °)
 |
| |
|
Table 3. Analysis of short ring interactions (Å)
 |
| |
|
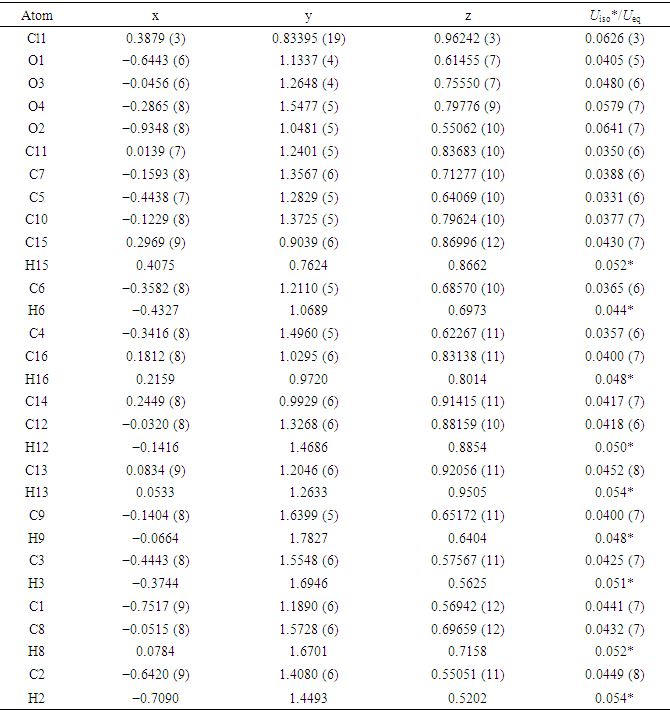
Table 4. Fractional atomic coordinates and isotropic or equivalent isotropic displacement parameters (Å2)
 |
| |
|
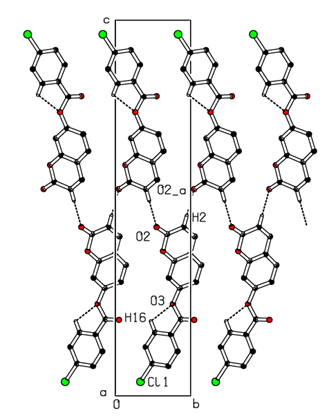 | Figure 8. Part of the crystal packing of the title compound showing the formation of an undulating network along the b-axis. Dashed lines indicate hydrogen bonds. H atoms not involved in hydrogen bonding have been omitted for clarity |
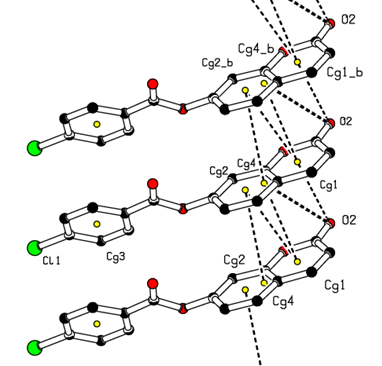 | Figure 9. A view of the crystal packing C=O…π and π–π stacking interactions (dashed lines). The yellow dots are ring centroids |
3.3. Hirshfeld Surface Analysis
The analysis of intermolecular interactions through the mapping of three-dimensional dnorm involves the contact distances di and de from the Hirshfeld surface to the nearest atom inside and outside, respectively. In the studied coumarin, the surface mapped over dnorm highlights two brite red and three faint-red spots, reflecting distances shorter than the sum of the van der Waals radii. These dominant interactions correspond to intermolecular C—H…O hydrogen bonds, O…H, C=O…π and π–π stacking interactions between the surface and the neighboring environment. The mapping also shows white spots, with distances equal to the sum of the van der Waals radii, and blue regions with distances longer than the sum of the van der Waals radii.Transparent surfaces are displayed in order to visualize the molecule (Figure 10a). In the shape-index map (-1.00 to 1.00 a.u., Figure 10b), the adjacent red and blue triangle-like patches show concave regions that indicate π–π stacking interactions [21]. Besides, the two-dimensional fingerprint plots (FP) are decomposed to highlight particular close contacts of atom pairs, and the contributions from different contacts are provided in Figure 11. The blue spots in the middle of the surface appearing near de = di ≃ 1.8–2.0 Å correspond to close C…C interplanar contacts. These contacts, which comprise 10.1% of the total Hirshfeld surface area, are related to π–π interactions (Figure 11a) as predicted by the X-ray study. The most significant contribution to the Hirshfeld surface (26.8%) is from H…O/O…H contacts, which appear on the left side as blue spikes with the tip at de + di ≃ 2.4 Å, top and bottom (Figure 11b), showing the presence of O…H contacts. As expected in organic compounds, the H…H contacts are important with a 22.8% contribution to Hirshfeld surface; these appear in the central region of the FP with a central blue tip spike at de = di = 1.10 Å (Figure 11c) whereas the C…H/H…C plot (16.0%) reveals information on the intermolecular hydrogen bonds (Figure 11d). Other visible spots in the Hirshfeld surfaces showing H…Cl/Cl…H, C…O/O…C, Cl…Cl, O…O and C…Cl/Cl…C contacts make contributions for 13.4, 6.3, 2.2, 1.3 and 1.1%, respectively (Figures 11e-11i).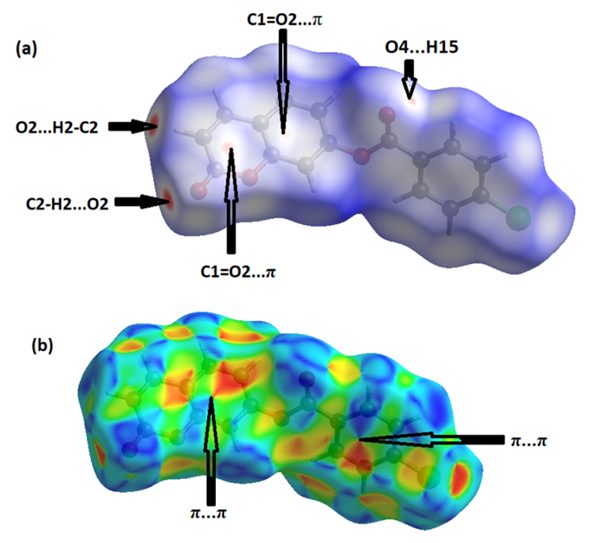 | Figure 10. Hirshfeld surfaces mapped over dnorm (-0.205 to 1.418 a.u.),(a) and Shape-index map (-1.000 to 1.000 a.u.),(b) |
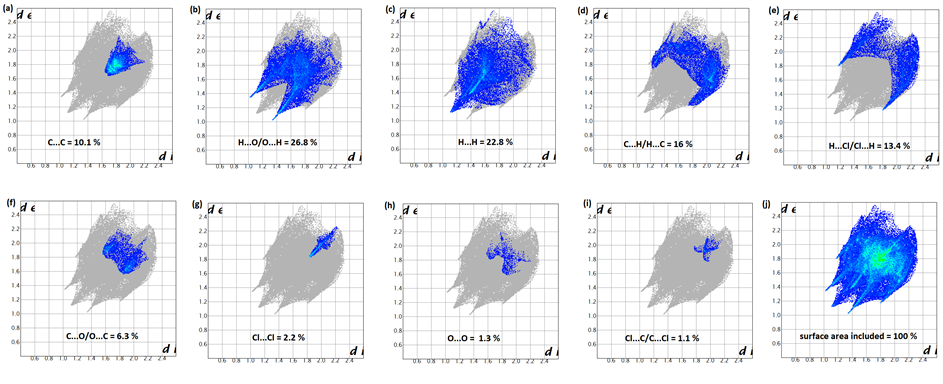 | Figure 11. Decomposed two-dimensional fingerprint plots for the title compound. Various close contacts and their relative contributions are indicated |
3.4. Theoretical Calculations
3.4.1. Comparison of Geometrical Parameters and Vibrational Frequencies
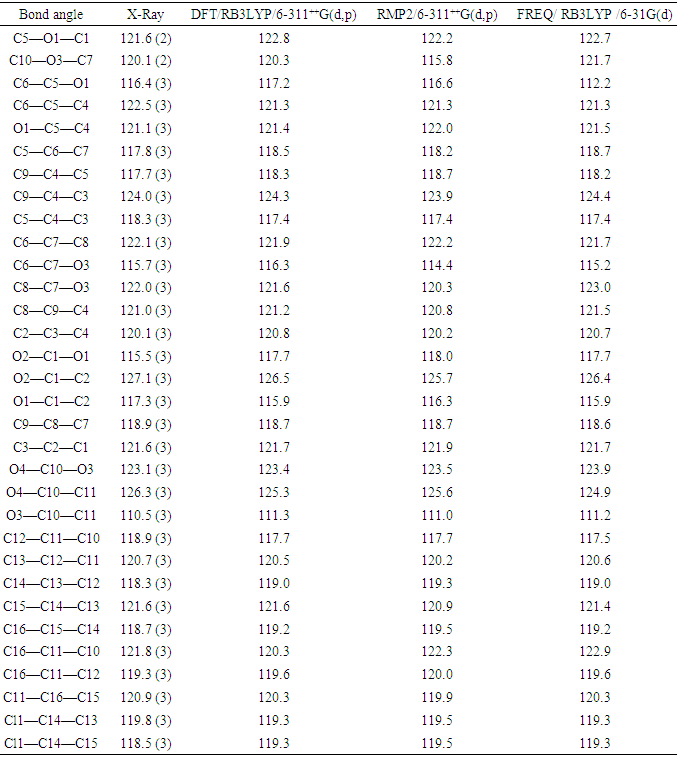
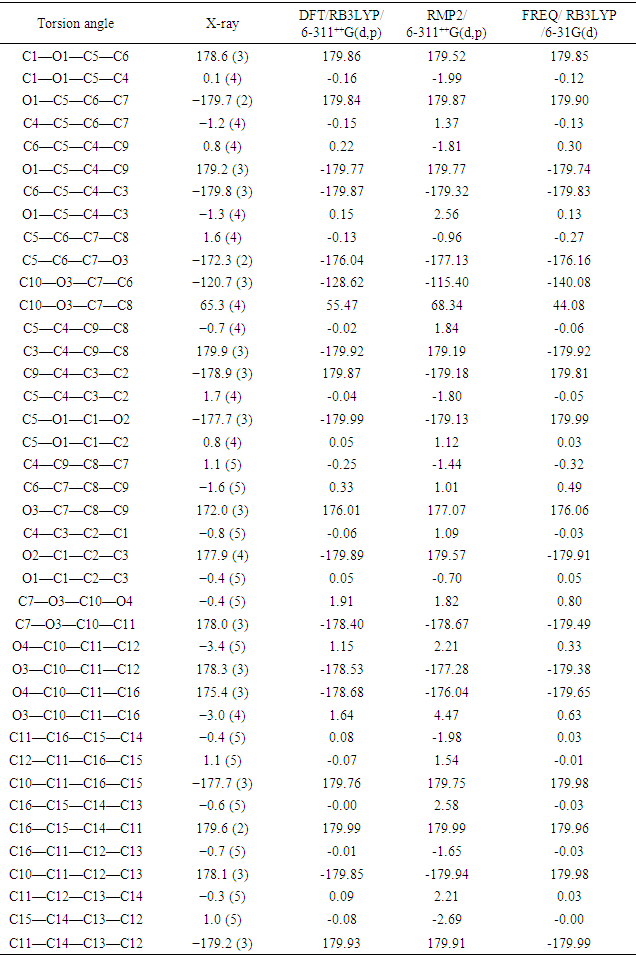
The resulting geometrical parameters are compared with those obtained from the X-ray crystallographic study. An analysis of the computational bond lengths and bond angles and comparison with the crystallographic results shows a good agreement between them, with a root-mean-square deviation of 0.006 Å (DFT/RB3LYP), 0.013 Å (RMP2) and 0.012 Å (FREQ/RB3LYP) for bond lengths and 0.8° (DFT/RB3LYP), 1.2° (RMP2) and 1.2° (FREQ/RB3LYP) for bond angles (Tables 5 and 6). In addition, an inspection of the calculated torsion angles shows that the coumarin ring system is planar, which is in good agreement with the crystallographic prevision, although the observed C10—O3—C7—C8 torsion angle between this ring system and the benzoate ring (65.3 (4)°) is somewhat lower than the RMP2 calculated value (68.34°) and larger than the DFT/RB3LYP and the frequency calculations values, 55.47° and 44.08°, respectively (Table 7).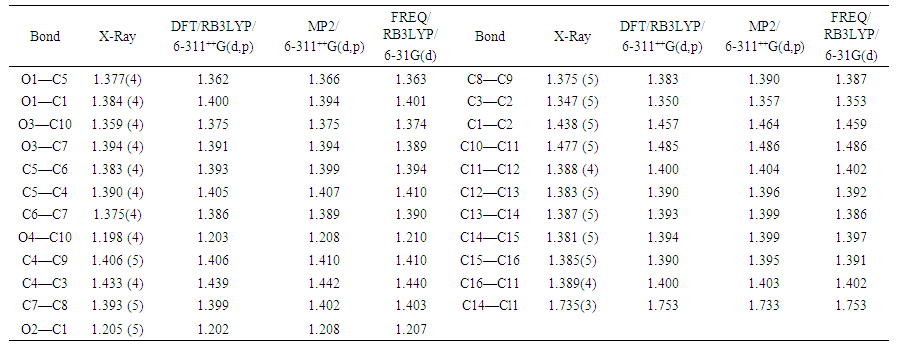 | Table 5. Experimental and calculated bond lengths (Å) |
Table 6. Experimental and calculated bond angles (°)
 |
| |
|
Table 7. Experimental and calculated torsion angles (°)
 |
| |
|
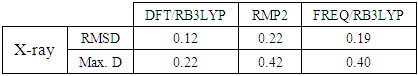
The above results are also shown in figure 12 by overlaying the structure determined by X-ray methods and that derived from Quantum Chemical Calculations with Mercury software [22]. The RMSD for the overlay and the maximum distance between two equivalent atoms (Max. D) are summarized in Table 8.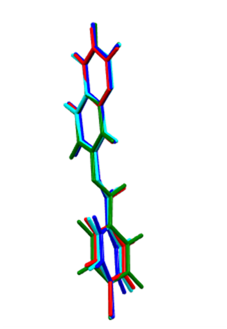 | Figure 12. Atom-by-atom superimposition of the structures calculated (green) (MP2/6-311++G(d,p), (cyan) ( DFT/B3LYP/6-311++G(d,p), (blue) Frequencies with RB3LYP/ 6-31G(d) on the X-ray structure (red) of compound (I) |
Table 8. Atom-by-atom superimposition results
 |
| |
|
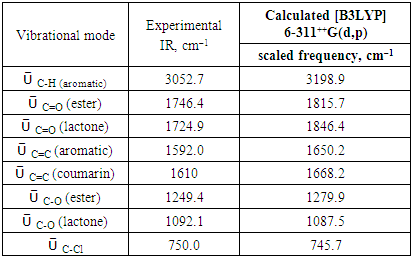
IR spectrum (cm–1) were recorded on a Bruker IFS 66/S Fourier Transform Infrared spectrometer (FT-IR), driven by the OPUS 6.5 software and using the ATR (Attenuated Total Reflection) technique.The theoretical spectrum was calculated by FREQ/ RB3LYP/6-311G++(d, p) methods for optimized geometries. Some vibrational modes assigned by Avogadro software [23] are given in Table 9 with their corresponding experimental values. Comparison of the calculated vibrational frequencies to their experimental data gives correlation value (R2) of 0.999 (Figure 13). So, quantum chemical calculations can predict experimental infrared frequencies with very good accuracy.Table 9. Comparison of the observed and calculated stretching vibrational spectra of compound (I)
 |
| |
|
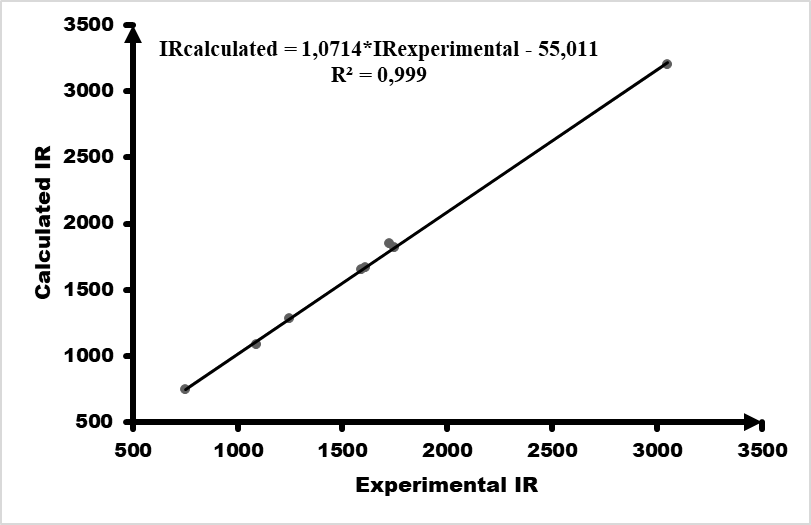 | Figure 13. Correlation graphic between the experimental and theoretical vibration frequencies of compound (I) (cm–1) |
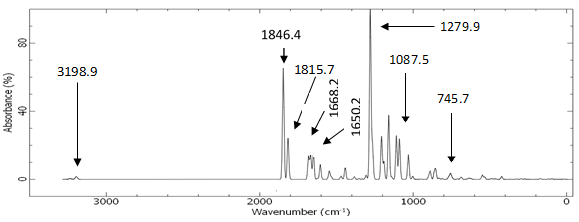 | Figure 14. Calculated vibrational spectra of compound (I) |
3.4.2. Molecular Electrostatic Potential (MEP)
The molecular electrostatic potential surface and contour map may lead to better understanding sites for electrophilic attack and nucleophilic reactions as well as hydrogen-bonding interactions [24-26] of the compound under study. The molecular electrostatic potential, V(r), may be either positive or negative in any given region, depending upon whether the effect of the nuclei or the electrons is dominant there. For convenience, V(r) is typically written in terms of atomic units, au; it then has the following form [27]: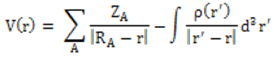 | (1) |
𝑍𝐴 is the charge of nucleus A located at 𝑅𝐴, 𝜌(𝑟’) is the electronic density function of the molecule, and 𝑟’ is the dummy integration variable. Being a real physical property, V(r) can be determined experimentally by diffraction or by computational methods [28]. To predict reactive sites for electrophilic and nucleophilic attack for the title molecule, MEP was computed at the DFT/RB3LYP, RMP2 and FREQ/RB3LYP optimized geometries using the 6-311++G(d,p) basis set for DFT/RB3LYP and RMP2 and 6-31G(d) for FREQ/RB3LYP. The negative (red) regions of MEP were related to electrophilic reactivity and the positive (blue) regions to nucleophilic reactivity shown in Figure 15. As can be seen from the figure, there are two possible sites on compound (I) for electrophilic attack. These negative regions are localised on the oxygen atoms O2 and O4 with a maximum value of -0.057, -0.071 and -0.056 a.u. for DFT/RB3LYP/6-311++G(d,p), RMP2/6-311++G(d,p) and FREQ/RB3LYP/6-31G(d) basis sets, respectively. These results provide information concerning the region where the studied compound can interact intermolecularly. Therefore, Figure 15 confirms the existence of the intermolecular C2–H2…O2 interaction.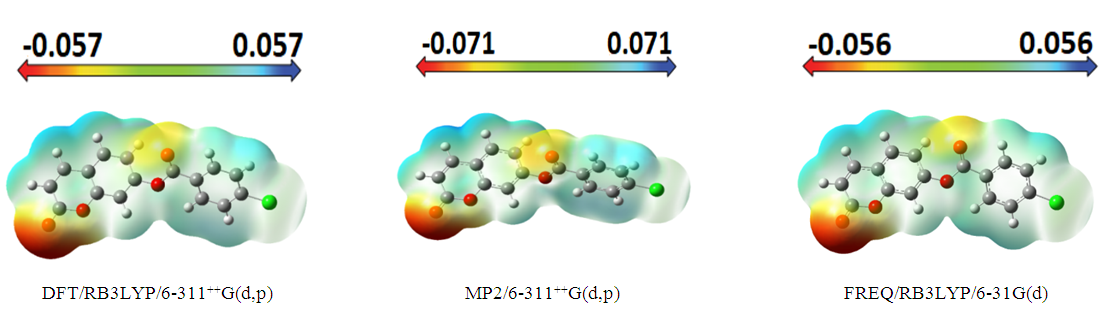 | Figure 15. Molecular electrostatic potential map (MEP) (in a.u.) calculated at DFT/RB3LYP/6-311++G(d,p), RMP2/6-311++G(d,p) and FREQ/RB3LYP/6-31G(d) level frontier molecular orbitals analysis |
3.4.3. HOMO-LUMO Analysis
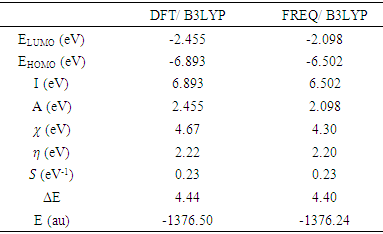
The distributions and energy levels of the highest occupied molecular orbital (HOMO) and the lowest lying unoccupied molecular orbital (LUMO) calculated at the DFT/RB3LYP/6-311++G(d,p) and FREQ/RB3LYP/6-31G(d) level for the title compound are shown in Figure 16. The calculations indicate that the title compound has 77 occupied molecular orbitals and the value of the energy separation between the LUMO and HOMO are 4.44 and 4.40 eV for at the two levels, respectively. These frontier orbital gaps in the range 4.40-4.44 eV show that 2-oxo-2H-chromen-7-yl 4-chloro benzoate is polarizable and is associated with a high chemical reactivity and low kinetic stability and is also termed as soft molecule [29]. The HOMO and LUMO energies, the energy gap (Δ𝐸), the ionization potential (𝐼), the electron affinity (𝐴), the absolute electronegativity (𝜒), the absolute hardness (𝜂), softness (𝑆) and the optimization energy (E) for compound (I) have been computed and the results are given in Table 10. By using HOMO and LUMO energy values for a molecule, electronegativity and chemical hardness can be calculated as follows [30]: | (2) |
 | (3) |
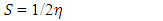 | (4) |
 | (5) |
 | (6) |
Table 10. The calculated frontier orbital energies, electronegativity, hardness and softness of the title compound using DFT/RB3LYP/6-311++G(d,p) and FREQ/RB3LYP/6-31G(d) levels
 |
| |
|
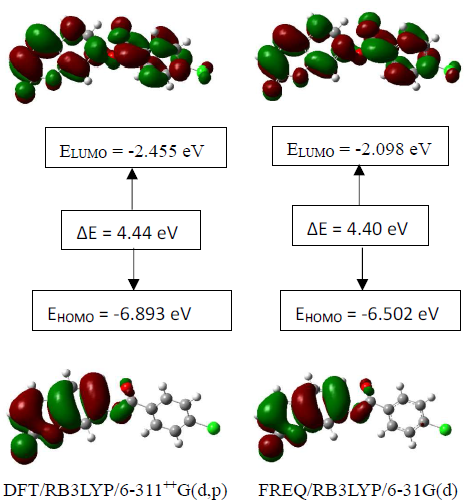 | Figure 16. The distributions and energy levels of the HOMO and LUMO orbitals computed at the DFT/B3LYP/6-311++G(d,p), MP2/6-311++G(d,p) and HF/6-311++G(d,p) levels for the compound (I) |
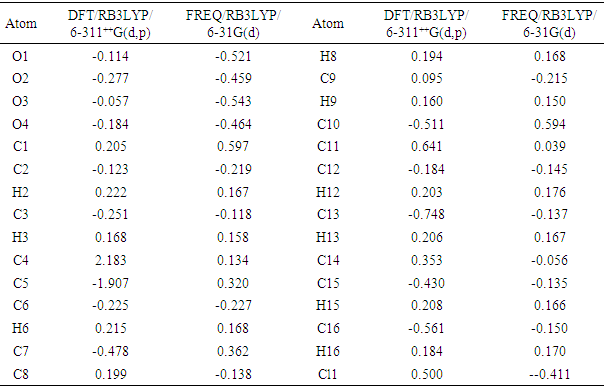
3.4.4. The Mulliken Charge Population
The Mulliken atomic charge calculation has an important role in the application of quantum chemical calculation to molecular system because of atomic charges effect dipole moment, molecular polarizability, electronic structure, and a lot of properties of molecular systems. The charge distributions calculated by the Mulliken method [31-34] for the equilibrium geometry of the title compound is given in table 11. The computed Mulliken charges of (C2;H2) and (C16;H16;O3) atoms are determined as (-0.123e; 0.222e) and (-0.561e;0.184e;-0.057e) for the DFT/RB3LYP/6-311++G(d,p) and (-0.216e;0.167e) and (-0.150e; 0.170e; -0.543e) for the FREQ/RB3LYP/6-31G(d) method. These values confirm the intermolecular hydrogen bond C2–H2…O2[1+x,y,z] and the intramolecular hydrogen bond C16–H16…O3. Likewise, the calculated Mulliken charges of (C3;H3), (C6;H6), (C12;H12), (C13;H13) and (C15;H15) atoms (Table 11) may suggest other intermolecular contacts in the gaseous state.Table 11. Mulliken atomic charges computed
 |
| |
|
4. Conclusions
In this present investigation, molecular structure was analyzed by Spectrometry, X-ray cristallography and the intermolecular interactions by Hirshfeld surface analysis. Also, molecular electrostatic potential, HOMO-LUMO analysis and the Mulliken charge populations of 2-oxo-2H-chromen-7-yl 4-chlorobenzoate have been studied using DFT/RB3LYP/6-311++G(d,p), RMP2/6-311++G(d,p) and FREQ/RB3LYP/6-31G(d) calculations. The calculated geometric parameters (bond length, bond angle, torsion angle and infrared spectrum) are compared with their experimental data. It is seen that there are no significant differences, when the experimental structure is compared with theoretical structures except the experimental torsion angle, C10—O3—C7—C8, which differs from those of the calculated values. The MEP maps show that the negative potential sites are on electronegative atoms and the positive potential sites are around the hydrogen atoms. These sites provide information concerning the region from where the compound can undergo intra- and intermolecular interactions. Similarly, the Mulliken charges confirm the intermolecular C2–H2…O2 and intramolecular C16–H16…O3 hydrogen bonds in the solid state.
ACKNOWLEDGEMENTS
The authors are thankful to the Spectropole Service of the Federation of Chemical Sciences (Aix-Marseille University, France) for the whole analysis.
References
| [1] | Basanagouda M., Kulkarni M. V., Sharma D., Gupta V. K., Pranesha P., Sandhyarani P. and Rasal V. P.; (2009) J. Chem. Sci., 121, 485–495. |
| [2] | Vuković N., Sukdolak S., Solujić S. and Niciforović N.; (2010) Arch. Pharm. Res., 33, 5–15. |
| [3] | Emmanuel-Giota A. A., Fylaktakidou K. C., Litinas K. E., Nicolaides D. N. and Hadjipavlou-Litina D. J.; (2001) Heterocycl. Chem., 38, 717–722. |
| [4] | Abou A., Djandé A., Kakou-Yao R., Saba A. and Tenon A. J.; (2013) Acta Cryst., E69, o1081–o1082. |
| [5] | Ouédraogo M., Abou A., Djandé A., Ouari O. and Zoueu T. J. ; (2018) Acta Cryst., E74, 530–534. |
| [6] | Rigaku OD.; (2015) CrysAlis PRO. Rigaku Oxford Diffraction, Yarnton, England. |
| [7] | Burla M. C., Caliandro R., Carrozzini B., Cascarano G. L., Cuocci C., Giacovazzo C., Mallamo M., Mazzone A. and Polidori G., J.; (2015) Appl. Cryst., 48, 306–309. |
| [8] | Farrugia L. J.; (2012) J. Appl. Cryst., 45, 849–854. |
| [9] | Sheldrick G. M.; (2015) Acta Cryst., C71, 3–8. |
| [10] | Spek A. L.; (2009) Acta Cryst., D65, 148–155. |
| [11] | Parsons S., Flack H.D. and Wagner T.; (2013) Acta Cryst., B69, 249-259. |
| [12] | Wolff S. K., Grimwood D. J., McKinnon J. J., Turner M. J., Jayatilaka D. and Spackman M. A.; (2012) Crystal Explorer. The University of Western Australia. |
| [13] | Frisch M. J., Trucks G. W., Schlegel H. B., Scuseria G. E., Robb M. A., Cheeseman J. R., et al.; (2013) GAUSSIAN09. Gaussian, Inc., Wallingford, CT, USA. |
| [14] | Allen F. H., Walson D. G., Orpen A. G., Taylor R.; (1987) J. Chem. Soc., Perkin Trans. II, S1-S9. |
| [15] | Abou A., Yoda J., Djandé A., Coussan S. and Zoueu T. J.; (2018) Acta Cryst.; E74: 761–765. |
| [16] | Djandé A., Abou A., Kini F., Kambo K. R. and Giorgi M.; (2018) IUCrData, 3, x180927. |
| [17] | Gomes L. R., Low J. N., Fonseca A., Matos M. J. and Borges F.; (2016) Acta Cryst., E72, 926–932. |
| [18] | Ziki E., Yoda J., Djandé A., Saba A. and Kakou-Yao R.; (2016) Acta Cryst., E72, 1562–1564. |
| [19] | Bernstein J., Davis R. E., Shimoni L. and Chang N-L.; (1995) Angew. Chem. Int. Ed. Engl., 34, 1555–1573. |
| [20] | Janiak J.; (2000) J. Chem. Soc. Dalton Trans., 3885–3896. |
| [21] | Bitzer S. R., Visentin C. L., Hörner M., Nascimento M. A. C. and Filgueiras C. A. L.; (2017) J. Mol. Struct., 1130, 165–173. |
| [22] | Macrae C. F., Bruno I. J., Chisholm J. A., Edgington P. R., McCabe P., Pidcock E., Rodriguez-Monge L., Taylor R., van de Streek J. and Wood P. A.; (2008) J. Appl. Cryst., 41, 466–470. |
| [23] | Hanwell M. D., Curtis D. E., Lonie D. C., Vandermeersch T., Zurek E., and Hutchison G. R.; (2012) Journal of Cheminformatics, 4(1), 17. |
| [24] | Scrocco E. and Tomasi J.; (1979) Advances in Quantum Chemistry, 11, 115–193. |
| [25] | Luque F.J., Lόpez J.M. and Orozco M.; (2000) Theoretical Chemistry Accounts, 103(3-4), 343–345. |
| [26] | Okulik N. and A. H. Jubert A.H.; (2005) Internet Electronic Journal of Molecular Design, 4, 17–30. |
| [27] | Politzer P. and J. S. Murray J. S.; (2002) Theoretical Chemistry Accounts, 108(3), 134–142. |
| [28] | Politzer P. and D. G. Truhlar D. G.; (1981) Chemical Applications of Atomic and Molecular Electrostatic Potentials, Plenum, New York, NY, USA. |
| [29] | Fleming I.; (1976) Frontier Orbitals and Organic Chemical Reactions, John Wiley & Sons, London, UK. |
| [30] | Pearson R. G.; (1986) Proceedings of the National Academy of Sciences of the United States of America, 83(22), 8440–8841. |
| [31] | Mulliken R. S.; (1955) The Journal of Chemical Physics, 23(10), 1833–1840. |
| [32] | Mulliken R. S.; (1955) The Journal of Chemical Physics, 23(10), 1841–1846. |
| [33] | Mulliken R. S.; (1955) The Journal of Chemical Physics, 23(12), 2338–2342. |
| [34] | Mulliken R. S.; (1955 The Journal of Chemical Physics, 23(12), 2343–2346. |

 Abstract
 Reference
 Full-Text PDF
 Full-text HTML