American Journal of Chemistry

p-ISSN: 2165-8749    e-ISSN: 2165-8781

2018;  8(3): 57-64

doi:10.5923/j.chemistry.20180803.01


Lactic Acid Production from Sisal Boles Juice by Lactobacillus Delbrueckii Sp. Delbrueckii

N. Msuya, J. H. Y. Katima, E. Masanja, R. J. A. Minja, A. K. Temu

Department of Chemical and Mining Engineering, University of Dar es Salaam, Dar es Salaam, Tanzania

Correspondence to: N. Msuya, Department of Chemical and Mining Engineering, University of Dar es Salaam, Dar es Salaam, Tanzania.

Email:

Copyright © 2018 The Author(s). Published by Scientific & Academic Publishing.

This work is licensed under the Creative Commons Attribution International License (CC BY).
http://creativecommons.org/licenses/by/4.0/

Abstract

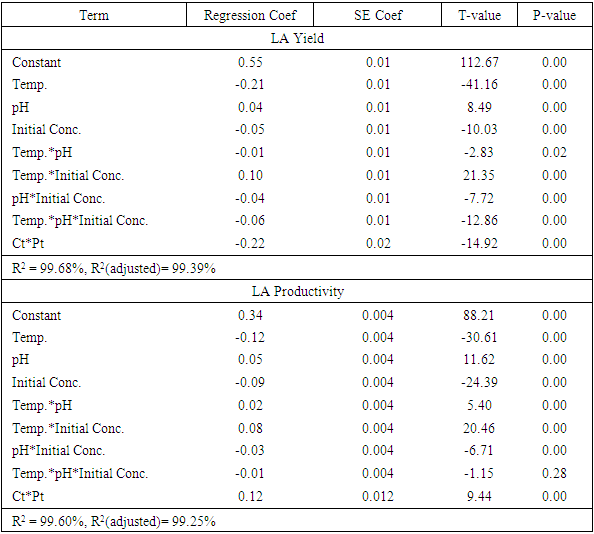
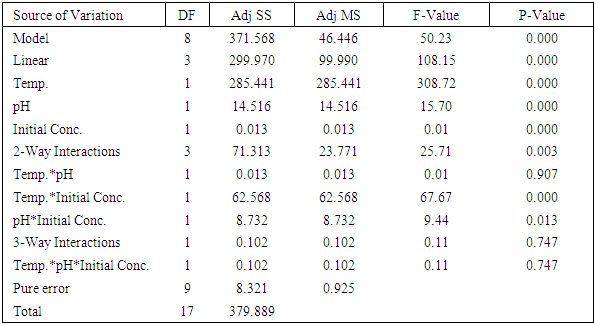
The use of different concentrations of sugar from sisal boles juice for production of Lactic acid (LA) using Lactic Acid Bacteria (LAB) has been studied with the intention of analysing the effect of initial sugar concentration, process temperature and initial medium pH on the produced lactic acid concentration, yield and productivity. All the linear variables (initial sugar conc., pH and temperature), two way and three way interactions were statistically significant for LA yield at p-values of less than 0.05 with correlation coefficient of 0.997. There was no significant effect on LA productivity of three way interactions (Temp.*pH*Initial Conc.). Maximum condition for production of LA occurred at a temperature of 37°C, initial pH of 6 and initial sugar concentration of 120 g/L which corresponded with the highest LA concentration of more than 24 g/Land a yield of 93%. This study shows that sisal boles juice has potential to produce LA.

Keywords: Sisal boles, Juice extraction, Lactic acid production, Delbrueckii sp. Delbrueckii, PLA

Cite this paper: N. Msuya, J. H. Y. Katima, E. Masanja, R. J. A. Minja, A. K. Temu, Lactic Acid Production from Sisal Boles Juice by Lactobacillus Delbrueckii Sp. Delbrueckii, American Journal of Chemistry, Vol. 8 No. 3, 2018, pp. 57-64. doi: 10.5923/j.chemistry.20180803.01.

1. Introduction

Lactic acid (2-hydroxy propanoic acid) is the simplest hydroxyl acid with an asymmetric carbon atom and exists in two optically active configurations, levorotatory (L) and dextrorotatory (D) [1-4]. Traditionally it was only used in food as preservative, pharmaceutical and leather tanning industries but recently new applications as a building block for renewable and biodegradable plastics, poly (lactic acid) (PLA) polymers has been found [5]. The worldwide demand for LA is over 150,000 tonnes per year [6] and is expected to increase rapidly as industrial feedstock for PLA production [7, 8, 9]. Komesu et al. (2016a) forecasted the annual demand to be 400,000 tonnes by the year 2017. With the increase of 5-8% per annum as projected by Yadav et al. (2011) the annual demand will be more than 1.0 million tonnes before 2025. The global annual production for LA was estimated to be 130,000–150,000 tonnes [10]. LA can be synthesized industrially by either chemical or biological routes. Chemical synthesis is mainly based on the hydrolysis of lactronitrile by strong acids like concentrated sulphuric acid or hydrochloric acid [11]. This route yields only dextrorotatory-levorotatory lactic acid (DL-LA), the mixture of L(+) and D(-) lactic acid (racemic mixture of the two isomers) [6, 12-14]. The biological route is through fermentation of starch and other polysaccharides [3, 15-18]. Biological route has the advantage of producing optically pure L(+) or D(-) lactic acids because specific microorganisms, substrates and conditions can be selected [6, 11, 19]. LA with high optical purity is required for the production of PLA [17, 18].
The most serious obstacle for LA production commercially is the availability and cost of feedstock for fermentation [20]. Different materials have been used for production of LA like pure sugars and food crop sources like potatoes, cassava, corn, wheat, rice, sugar beet and sugar cane [11, 13, 17, 21-26]. Utilization of pure sugars and food crops as carbon source in lactic acid production is economically unfavourable, because of competition with existing uses [27, 28]. The utilization of non-food sources and cellulosic materials is a promising approach since they are abundant, renewable, relatively cheap and do not compete with food [12, 29, 30]. Industrial wastes, agricultural waste and forestry waste have been recommended as cost effective feedstocks for large scale fermentation [6, 21, 28, 29, 31]. However, cheap, non-food, and renewable raw materials still need to be identified to reduce the production cost of lactic acid and hence PLA [29, 32]. Material like sisal boles with total sugars of 26-30% can be used to extract juice that can be fermented to produce LA [33]. Little or no work has been done to produce LA from this huge resource. This work analyses the effects of initial sugar concentration, process temperature and initial medium pH on the production of lactic acid from sisal boles juice.

2. Material and Methods

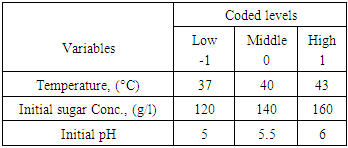
The raw material used was juice from sisal boles (Agave - Hybrid 11648). The juice extraction process involved chopping of sisal boles into small pieces (about 5-15 cubic millimetre) to increase surface area during pressing. Chopped boles were pressed using a manual pressing machine with hydraulic pressure which was combined with filtration using filter cloths. The juice was then hydrolysed to break the sugars into fermentable sugars. The hydrolysis method by Masalla (2010) was adapted with slight modification. The pH of the juice was reduced to 1.0 using concentrated hydrochloric acid (36%) and then heated in oil bath at a temperature range of 60-100°C for 30-60 minutes to complete the thermo-acid hydrolysis. The hydrolysates were then left to cool to room temperature (30°C±2).
The procedure for preparation of stature culture by Panesar (2010) was adapted with slight modification. The microorganism strain utilised was Lactobacillus delbrueckii WLP677 from the White Labs Inc. (CA 92126 USA). The bacterial culture was grown in 50ml of De Man, Rogosa and Sharpe agar (MRS) medium in 250 ml Erlenmeyer flask [16]. The prepared MRS medium contained the following (g/l): peptone, 10; meat extract, 5.0; yeast extract, 5.0; dextrose, 20; potassium phosphate, 2.0; tween 80, 1.0; tri-ammonium citrate, 2.0; magnesium sulphate, 0.05; sodium acetate, 5.0 and agar, 12. After sterilization at 121°C for 15minutes using portable steam Autoclave (Heuer, 220V and 50Hz) and cooling to room temperature (30°C±2), the medium was inoculated with about 10% of cells from agar stab. The medium was then incubated at 37°C for 24 hrs under stationary conditions for microbial growth before fermentation. The pH of the fermentation medium was regulated before fermentation to 5 or 6, using sodium hydroxide (12.5M = 50%). A 23 full factorial design was used to study the influence of three parameters: pH, initial sugar concentration and medium fermentation temperature on the responses (LA concentration, yield and productivity). The real and coded variables are presented in Table 1.
Table 1. Matrix of 23 factorial designs for Fermentation experiments
     
The experiments were performed in random order using one replicate to estimate the pure error. Minitab V.17 was used in designing and generating a regression model, which predicted effect of combined parameters on responses. The coefficient of determination R2 (R-Sq) represents the proportion of variation in the fitted models that is explained by the components and was used to check whether a linear relationship between the response and the components fits the data well while p-values (P) in the coefficients table were used to determine which of the effects in the model were statistically significant [34]. The polynomial equation given by equation (i) was used to model the relationship between factors and response where X1, X2 and X3 are independent variables; βo, β1, β2, β3 are linear coefficients; β12, β13, β23 are two way interaction coefficients, β123 three way interaction regression coefficients and Y is the response function.
(1)
The LA produced was separated from the fermentation broth by centrifugation at 5000 rpm for 15 minutes. The supernant was analysed for LA concentration using UV/IV digital spectrophotometer (Labtronics LT-31) as per method by Borshchevskaya et al. (2016) which involves the reaction of lactate ions with iron (III) chloride at 390 nm. This method was selected because it is relatively cheap and has an error of less than 3% compared to HPLC method [35]. A solution of LA (50 µL) of a corresponding concentration was added to 2 ml of 0.2% solution of iron (III) chloride and stirred. The absorbance of the obtained solutions was measured at 390 nm using the digital UV/IV spectrophotometer. Concentration of LA was then obtained from the calibration curve (Figure 1), which was drawn using reagent grade DL-Lactic acid (90%-sigma Aldrich) and 2 ml of a 0.2% solution of iron (III) chloride.
Figure 1. Calibration Curve for LA Concentration determination
The calibration curve was used to obtain the LA concentration of the fermented sisal bole juice using Equation (ii), taking into consideration the dilution used during UV-IV analyses. The fermentation yield was calculated using the ratio of LA produced (g) per amount of sugar consumed (g) within a given time. The LA productivity was calculated as a ratio of concentration and the production time per hour.
(2)

3. Results and Discussion

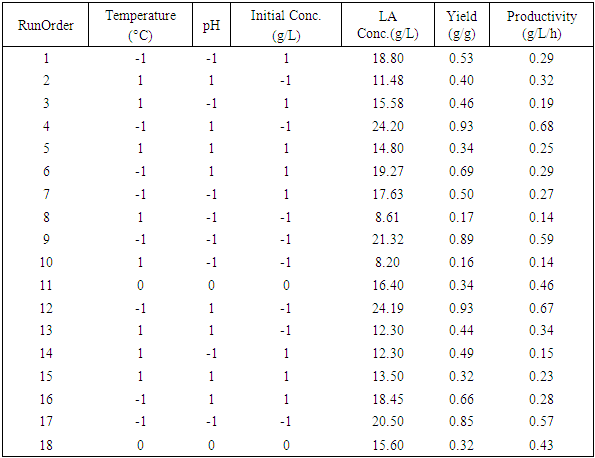
The calibration curve gave a linear relationship with R2 of 0.999 and the fermentation results are presented in Table 2.
Table 2. LA Fermentation Results
     
From Table 2, it can be seen that maximum condition for production of LA from sisal juice occurred at a temperature of 37°C, pH of 6 and initial sugar concentration of 120 g/L which corresponded with the highest LA concentration of more than 24g/L and a yield of 93%. Higher temperature of 43°C with similar sugar concentration and pH produced about 50% less LA. This could be attributed to the fact that Lactobacillus delbrueckii has optimal production at a temperature of 37°C although they can grow at higher temperature of more than 40°C. When the initial sugar was increased to 160 g/L there was slight decrease in LA concentration. This can be attributed to the nature of the used microorganisms. The higher sugar concentration make microorganisms suffer from osmotic pressure and fail to produce [15, 36, 37]. The results in Table 2 were analysed for the effects of the parameters on estimated responses. The estimated coefficients are given in Table 3.
Table 3. Estimated effects of parameters on LA Yield and Productivity at 95% CI
     
Considering a confidence level of 95%, a factor is considered statistically significant if its p-value is lower than 0.05. As per Table 3; all the linear, two ways and three ways interactions were statistically significant variables for LA yield at p-values of less than 0.05 with correlation coefficient of 0.997. The linear variables (Temp, pH and Initial Conc.) and two-way interactions (Temp.*pH, Temp.*Initial Conc. and pH*Initial Conc.) significantly affected the LA productivity at p-values less than 0.05. There was no significant effect on LA productivity of three-way interactions (Temp.*pH*Initial Conc.) at p-values = 0.28 with 95% confidence interval. LA concentration model is thus represented by equation (iii).
(3)
In order to evaluate whether the models are statistically significant with confidence level of 95% or not an F-Test was done. Analysis of Variance (ANOVA) for LA concentration is given in Table 4. According to ANOVA, LA concentration model presented a correlation coefficient of 0.97; therefore the linear model adjusts well the experimental data and not luck of fit.
Table 4. Analysis of Variance (ANOVA) for LA concentration with 95% confidence interval
     
Table 4 clearly shows that all the linear variables (Temp., pH and Initial Conc.) had significant effect on LA concentration at p-values = 0.00. All the two way interactions had significant effect at p-values less than 0.05 except Temp.*pH which had no significant effect at p-value = 0.907. With 95% confidence interval, there was no significant effect of three way interactions variables on LA concentrations at p-values = 0.747. This is also well presented by interaction plot in Figure 2 and Pareto chart in Figure 3. The interaction effects on Figure 2 indicate the degree of interaction which is justified by interaction lines that are not parallel. Parallel lines in an interaction plot indicate no interaction while the greater the difference in slope between the lines, the higher the degree of interaction (Minitab, V.17). The great departure from parallel occurred when combining temperature with initial sugar concentration, and pH with initial concentration. This indicates that LA concentration at temperature or pH level depends upon the initial sugar concentration levels. There was no effect on LA concentration when combined pH and Temperature.
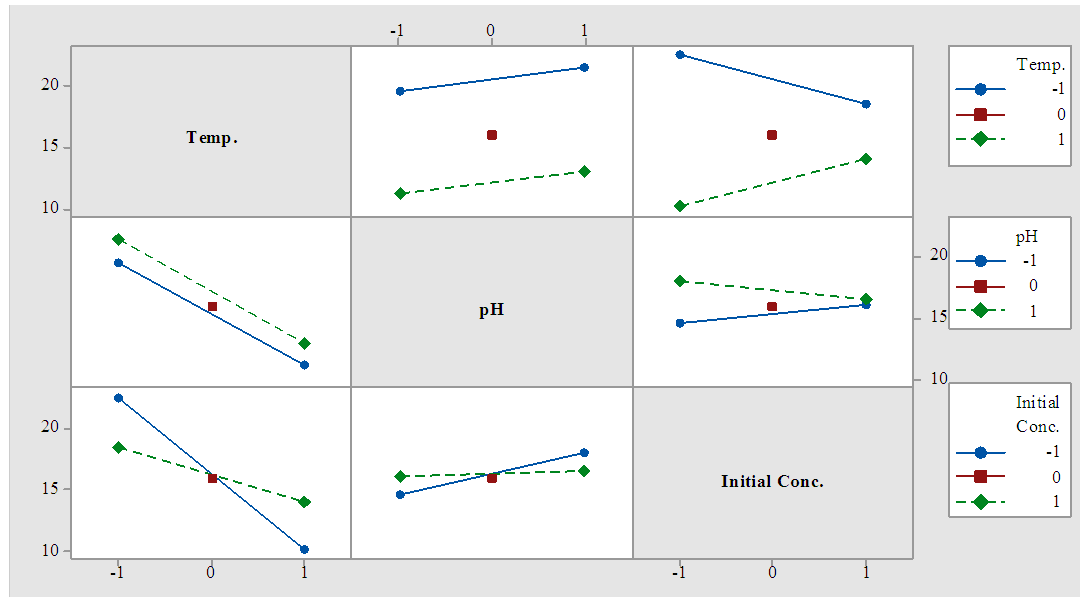
Figure 2. Interaction plot for LA concentration (data means)
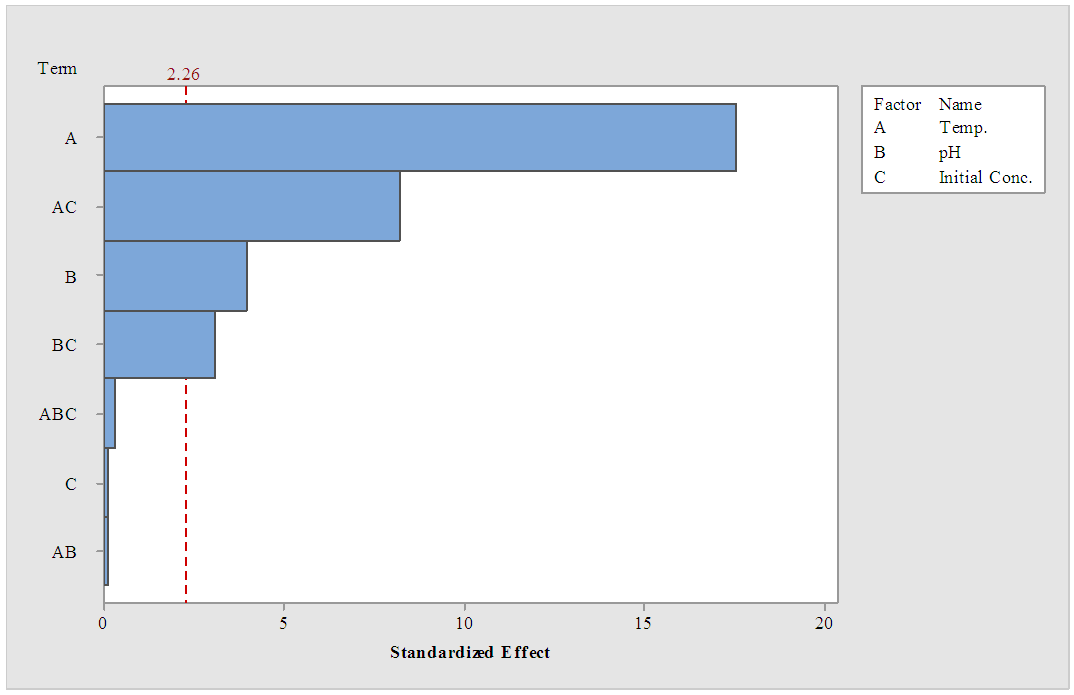
Figure 3. Pareto chart for LA concentration at α =0.05
Pareto chart of the effects is normally used to determine the magnitude and importance of an effect by displaying the absolute value of the effect and draws a reference line. By default, any effect that extends past this reference line is significant at α level of 0.05 (Minitab, V.17). The Pareto chart (Figure 3) shows that for LA concentration, there are four significant effects at (α = 0.05): two main effect (temperature (A) and pH (B)) and two interaction effects (Temperature with initial sugar concentration (AC) and pH with initial sugar concentration (BC)). In addition, the largest standardized effect is temperature because it extends the farthest.
Maximum condition for production of LA from sisal juice using Lactobacillus delbrueckii WLP677 bacteria occurred at a temperature of 37°C, pH of 6 and initial sugar concentration of 120 g/L which corresponded with the highest LA concentration of more than 24g/L and a yield of 93%. Higher temperature of 43°C with similar sugar concentration and pH produced about 50% less LA. This could be attributed to the fact that Lactobacillus delbrueckii has favourable production at a temperature of 37°C although they can grow at higher temperature of more than 40°C.
When the initial sugar was increased to 160 g/L there was slight decrease in LA concentration. This can be attributed to the nature of the used microorganisms. The higher sugar concentration make microorganisms suffer from osmotic pressure and fail to produce [15, 36, 37]. From the data, the higher yield of almost 93% is obtained at the same conditions where high concentration of LA is obtained. Abdel-Rahman et al. (2013); reported almost similar yield but with a pH-controlled batch fermentation process. Similar results were reported by Sheeladevi & Ramanathan (2012) when producing LA from whey using the same microorganisms. The lowest yield for this study was obtained at a temperature of 43°C, low initial sugar concentration of 120g/L and pH of 5. Figure 4, shows the residual sugar concentration (Co) and LA production with time during fermentation at a temperature of 37°C for the different samples.
The fast decrease in sugar concentration at the start of the experiment in Figure 4 implies fast consumption of sugar, this continues up to about 36 hrs. This can be attributed to the microorganism’s nature that after inoculation they exhibit an exponential growth phase in which they consume substrate fast. This also happens as the pH remains favourable (pH of above 4). It is also a typical mass-transfer phenomena resulting from sugar concentration gradient which enhances movement of sugar molecule to the reaction site where sugar is consumed by the microorganisms. After 36 hrs, the sugar consumption tends to be slow for high initial sugar concentration (160 g/L) and almost stopped for the cases with low initial sugar concentration (120 g/L). In all the samples, sugar tended to stop being consumed when the pH of the medium was reduced to 4. This can be attributed to microorganism inhibition by product (product inhibition). That is to say the acidic nature of the product affected the microorganisms since most of the LAB are non-tolerant to pH below 4 [15, 36, 37]. The decrease in pH of the samples in Figure 4 is given in Figure 5.
From Figure 5, it can be seen that initial pH of 5.0-6.2 supported the microorganisms’ growth, while consuming sugars up to around 2 days during which pH slightly dropped to pH below 5. Both Figures 4 and 5 show production of LA led to decrease in pH which inhibit LAB growth, hence sugar consumption dropped and finally stopped. Qin et al. (2010) and Zhang et al. (2007) have reported a decrease in acidity to be a problem. This could be controlled by adjusting the pH of the medium to above 5 using sodium hydroxide. If pH is not controlled during fermentation, it decreases with increasing lactic acid production [38, 39]. Lactobacillus species cannot grow and produce lactic acid below pH 4, although the pKa of lactic acid is 3.86 [40, 41]. This results in inhibition of cell growth and its production and hence sugar consumption [20, 40, 42]. No attempt was made to adjust pH in this study; since batch fermentation was used in which case adjustment of pH could have resulted into contamination of the system. This is one of the disadvantages of batch fermentation process that nutrients and all the settings are done at the beginning and are not adjusted in between. Controlled pH fermentation can be done using a continuous fermentation in a well-equipped fermenter with pH regulator.
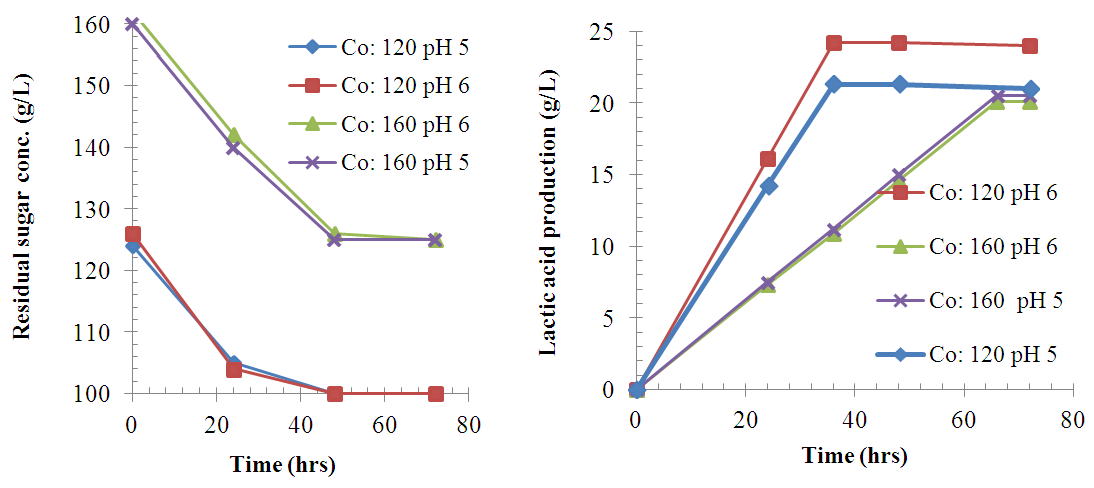
Figure 4. Variation of sugar concentration (Co) and LA production with time during fermentation at 37°C
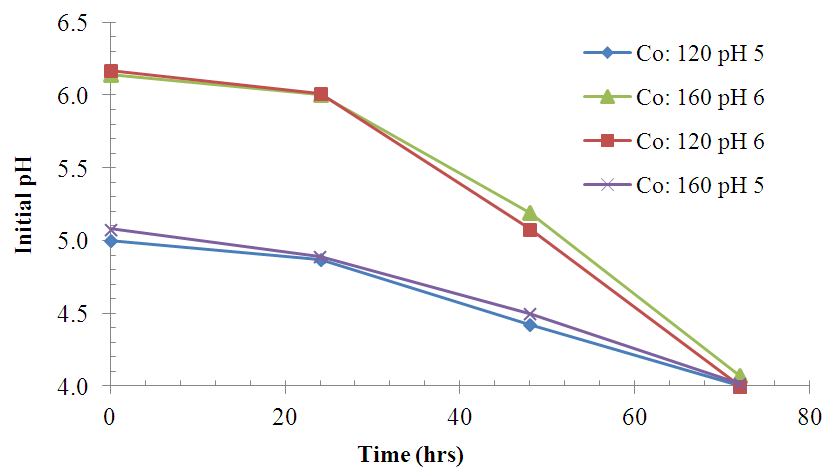
Figure 5. Variation of pH with time during fermentation at 37°C

4. Conclusions

93% of the sugar available in sisal bole juice could be converted to LA through fermentation using LAB. All the linear variables (initial sugar conc., pH and temperature), two-way and three-way interactions were statistically significant variables for LA yield at p-values of less than 0.05 with correlation coefficient of 0.997. There was no significant effect on LA productivity of three-way interactions (Temp.*pH*Initial Conc.). Using interaction plots on LA concentration at α = 0.05, the great departure of lines from parallel occurred when combining temperature with initial sugar concentration, and pH with initial concentration. This indicates that LA concentration at temperature or pH level depends upon the initial sugar concentration levels. There was no effect on LA concentration when combined pH and Temperature. In addition, the largest standardized effect on LA concentration was temperature because it extended the Pareto chart reference line the farthest. Maximum production of LA (24g/L) from sisal juice using Lactobacillus delbrueckii WLP677 bacteria occurred at temperature of 37°C, pH of 6 and initial sugar concentration of 120 g/L. Higher temperature of 43°C with similar sugar concentration and pH produced about 50% less LA. This study confirms the fact that sisal boles juice can be used to produce LA through microbial route. Further studies on the optimization of LA production (concentration and yield) from sisal boles juice are recommended.

ACKNOWLEDGEMENTS

We are gratefully for the financial support by Tanzania Commission for Science and Technology (COSTECH) under Bioplastics Project and DAAD - in Country scholarship through University of Dar es Salaam (UDSM) -Tanzania. Special thanks to Mr. Abdi A. for his support during data collections.

References

[1]  B. Zhao, L. Wang, F. Li, D. Hua, C. Ma, Y. Ma, and P. Xu, Bioresource Technology, 101, 6499–6505, 2010.
[2]  L. Wang, B. Zhao, F. Li, K. Xu, C. Ma, F. Tao, Q. Li, and P. Xu, Applied Microbiology and Biotechnology, 89, 1009–1017, 2011.
[3]  A. P. Gupta and V. Kumar, European Polymer Journal, 43, 4053–4074, 2007.
[4]  A. Komesu, P. Martinsa, B. Lunellia, P. F. Martins, B. H. Lunelli, A. T. Morita, P. L. A. De Coutinho, R. M. Filho, and M. R. W. Maciel, Chemical Engineering, 32, 2017–2022, 2013.
[5]  M. A. Eiteman and S. Ramalingam, , Biotechnology Letters, 37, 955–972, 2015.
[6]  T. Ghaffar, M. Irshad, and Z. Anwar, ‘Journal of Radiation Research and Applied Sciences, 7, 222–229, 2014.
[7]  S. Liang, A. G. McDonald, and E. R. Coats, Waste Management, 45, 51–56, 2015.
[8]  A. Komesu, P. F. Martins, J. Oliveira, B. H. Lunelli, R. M. Filho, and M. R. W. Maciel, Chemical Engineering Transactions, 37, 367–372, 2014.
[9]  A. K. Yadav, R. M. Kothari, and A. B. Chaudhari, Critical reviews in Biotechnology, 31, 1–19, 2011.
[10]  S. Liu, M. K. Bischoff, Y. Li, F. Cui, H. Azaizeh, and A. Tafesh, Biocatalysis and Biomolecular Engineering, 421–435, 2010.
[11]  M. A. Abdel-Rahman, Y. Tashiro, and K. Sonomoto, Biotechnology Advances, 31, 877–902, 2013.
[12]  C. Gao, C. Ma, and P. Xu, Biotechnology Advances, 29, 930–939, 2011.
[13]  K. Hofvendahl and B. Hahn–Hägerdal, Enzyme and Microbial Technology, 26, 87–107, 2000.
[14]  J. Vijayakumar, R. Aravindan, and T. Viruthagiri, Chem. Biochem. Eng, 22, 245–264, 2008.
[15]  P. Agarwal, A. Joshi, and H. Sharma, World Journal of Pharmacy and Pharmaceuticals Sciences, 5, 1859–1868, 2016.
[16]  P. S. Panesar, J. F. Kennedy, C. J. Knill, and M. Kosseva, Brazilian Archives of Biology and Technology, 53, 219–226, 2010.
[17]  M. R. Subramanian, S. Talluri, and L. P. Christopher, Microbial biotechnology, 8, 221–9, 2015.
[18]  S. Taskila and H. Ojamo, Lactic Acid Bacteria – R & D for Food, Health and Livestock Purposes, INTECH, Oulu, Finland:, 2013.
[19]  A. Komesu, M. R. W. Maciel, J. A. R. Oliveira, R. M. Filho, and L. H. da S. Martins, Journal of Chemistry and Chemical Engineering, 10, 271–276, 2016.
[20]  K. Sonomoto, Y. Wang, and Y. Tashiro,Journal of Bioscience and Bioengineering, 119, 10–18, 2015.
[21]  Y. Li, L. Wang, J. Ju, B. Yu, and Y. Ma, ‘Bioresource Technology, 142, 186–191, 2013.
[22]  R. P. John, K. M. Nampoothiri, and A. Pandey, Applied microbiology and biotechnology, 74, 524–34, 2007.
[23]  R. Mazzoli, F. Bosco, I. Mizrahi, E. A. Bayer, and E. Pessione, Biotechnology Advances, 32, 1216–1236, 2014.
[24]  K. Okano, S. Hama, M. Kihara, H. Noda, T. Tanaka, and A. Kondo, Appl. Microbiol. Biotechnol, 101, 1869–1875, 2017.
[25]  K. Ma, G. Hu, L. Pan, Z. Wang, Y. Zhou, Y. Wang, Z. Ruan, and M. He, Bioresource Technology, 219, 114–122, 2016.
[26]  A. Sheeladevi and N. Ramanathan, International Journal of Pharmaceutical & Biological Archives, 2, 1681–1691, 2012.
[27]  C. Rojas-Garbanzo, C. Araya-Cloutier, and C. Velázquez-Carrillo, International Journal of Biotechnology for Wellness Industries, 1, 91–100, 2012.
[28]  S. Kelkar and P. Mahanwar, International Journal of Technology Enhancements and Emerging Engineering Research, 3, 25–31, 2015.
[29]  L. Wang, Z. Xue, B. Zhao, B. Yu, P. Xu, and Y. Ma, Bioresource Technology, 130, 174–180, 2013.
[30]  A. Komesu, P. F. M. Martinez, B. H. Lunelli, J. Oliveira, M. R. W. Maciel, and R. M. Filho, Chemical Engineering and Processing: Process Intensification, 117, 89–94, 2017.
[31]  A. Mshandete, O. Kibazohi, and A. Kivaisi, International Journal of Pure and Applied Sciences, 14, 84–94, 2013.
[32]  L. Peng, N. Xie, L. Guo, L. Wang, B. Yu, and Y. Ma, , PloS one, 9, 107-143, 2014.
[33]  N. Msuya, J. H. Y. Katima, E. Masanja, and A. K. Temu, Scifed Journal of Polymerscience, 1, 1–15, 2017.
[34]  C. R. Kothari and G. Garg, Research Methodology, New Age International (P) Ltd, New Delhi, 2014.
[35]  L. N. N. Borshchevskaya, T. L. L. Gordeeva, A. N. N. Kalinina, and S. P. P. Sineokii, Journal of Analytical Chemistry, 71, 755–758, 2016.
[36]  M. A. Abdel-Rahman, Y. Tashiro, and K. Sonomoto, Journal of Biotechnology, 156, 286–301, 2010.
[37]  K. B. Sutton, Fermentation inhibitors, Novozymes Bioenergy, Denmark, 2011.
[38]  J. Qin, X. Wang, Z. Zheng, C. Ma, H. Tang, and P. Xu, Bioresource Technology, 101, 7570–7576, 2010.
[39]  Z. Y. Zhang, B. Jin, and J. M. Kelly, Biochemical Engineering Journal, 35, 251–263, 2007.
[40]  K. Okano, T. Tanaka, C. Ogino, H. Fukuda, and A. Kondo, Applied Microbiology and Biotechnology, 85, 413–423, 2010.
[41]  A. N. Vaidya, R. A. Pandey, S. Mudliar, M. S. Kumar, T. Chakrabarti, and S. Devotta, Critical Reviews in Environmental Science and Technology, 35, 429–467, 2005.
[42]  E. Palmqvist and B. Hahn-Hägerdal, Bioresource Technology, 74, 25–33, 2000.