-
Paper Information
- Next Paper
- Paper Submission
-
Journal Information
- About This Journal
- Editorial Board
- Current Issue
- Archive
- Author Guidelines
- Contact Us
American Journal of Chemistry
p-ISSN: 2165-8749 e-ISSN: 2165-8781
2018; 8(1): 1-7
doi:10.5923/j.chemistry.20180801.01

Synthesis and Spectroscopic Studies of New Alkoxy Schiff Base Complexes Based on Coumarin Moiety
 Abstract
 Reference
 Full-Text PDF
 Full-text HTML
Sinan Al–Bayati, Anaam Rasheed, Enas Zuhair, Khalil Abid, Wessal Khamis
Chemistry Department, College of Science, University of Al – Mustansiryah, Baghdad, Iraq
Correspondence to: Anaam Rasheed, Chemistry Department, College of Science, University of Al – Mustansiryah, Baghdad, Iraq.
| Email: |  |
Copyright © 2018 Scientific & Academic Publishing. All Rights Reserved.
This work is licensed under the Creative Commons Attribution International License (CC BY).
http://creativecommons.org/licenses/by/4.0/

A new coumarin derivative with single arm alkoxy Schiff base ligand, (1-{[(3Z)-3-(hydroxyimino)butan-2-ylidene]amino}-4-(octyloxy)quinolin-2(1H)-one) (LH), has been prepared in three steps starting from 4 – hydroxycoumarin and octylbromide to get compound 1 which then reacted with hydrazine hydrate to get compound 2 and finally reacted with 2,3 – butanedione oxime. This ligand was used to prepare new metal complexes with the metal chlorides of NiII, CuII, LaIII, and CeIII. Ligand and metal complexes were characterized and investigated by use of elemental analysis, 1HNMR, FTIR, UV–visible, mass and atomic absorption spectroscopy, molar conductivity, thermal analysis (TGA) and magnetic susceptibility measurements. The collected results showed that the Schiff base ligand was a tridentate chelate (O, N, O) and coordinates to the central LaIII, CeIII ions with 1:2 metal: ligand ratio and 1:1 to NiII, CuII respectively.
Keywords: 4 – hydroxycoumarin, Schiff base, Metal complexes,N - aminoquinolone
Cite this paper: Sinan Al–Bayati, Anaam Rasheed, Enas Zuhair, Khalil Abid, Wessal Khamis, Synthesis and Spectroscopic Studies of New Alkoxy Schiff Base Complexes Based on Coumarin Moiety, American Journal of Chemistry, Vol. 8 No. 1, 2018, pp. 1-7. doi: 10.5923/j.chemistry.20180801.01.
Article Outline
1. Introduction
- Coumarins derivatives are widely distributed throughout nature as secondary metabolites from plants, and in recent years the structural modification of coumarin derivatives becomes one of major fields of natural product chemistry [1, 2]. These derivatives showed low toxicity with some advantage properties like high fluorescence quantum yield, large stokes shift, excellent light stability. Therefore they had an applications in the fields of biology, medicine, perfumes, cosmetics, and fluorescent dyes. New coumarin-derived fluorescent probes were shown to be useful to image the plasmalemma of cultured human neuroblastoma cells, and obtained a more detailed picture of this finding by determining the crystal structure of one of these probes and characterizing the localization and interactions of the studied compounds with a lipid bilayer model by MD simulations [3, 4]. Coumarin derivatives are important compounds recently used to prepare new drugs and researches had proved that metal ions complexes of these derivatives were important in the development of more effective medicines. These two facts encourage the preparation of new coumarin derivatives and their complexes with some transition metals [5-9]. The derivatives of 4-hydroxycoumarin, show significant anticoagulant action by antagonizing the action of vitamin K as well as electronic and photonic applications [10-13]. They exhibit intense fluorescence upon substitution with various functional groups at different positions [14-19].In this paper a new Schiff base derived from 4 – hydroxycoumarin possessing a long alkoxy chain and it`s complexes with NiII, CuII, LaIII and CeIII ions were prepared and investigated.
2. Materials and Methods
2.1. Materials
- All chemicals were analytical grade supplied by BDH and Fluka and used without any modification. Elemental analysis performed with an elemental analyzer (EA), electronic spectra were obtained by use of a Varian UV–Vis spectrophotometer, FTIR spectra by use of a Shimadzu spectrophotometer, mass spectra were recorded by use of Schimadzu mass spectroscopy, molar conductivity measurements by use of a WTWF56 apparatus with absolute ethanol as solvent and Magnetic susceptibility measurements were carried out using of Curie balance, all in the Chemistry Department, College of Science, Mustansiryah University, Iraq. 1HNMR spectra were obtained using a Bruker 300 MHz and d6 –DMSO as a solvent at University of Al Albait, Amman, Jordan. Atomic absorption spectrometry was performed with a Shimadzu model 6809 by Ibn–Sina Company, Baghdad, Iraq.
2.2. Synthesis of 4 – Octyloxycoumarin (1)
- To an equimolar amounts of 4- hydroxycoumarin (4.86g, 30mmol) and powdered potassium hydroxide (1.68g, 30mmol) in absolute ethanol (100ml), n-octylbromide (5.79g, 30mmol) was added and the mixture stirred at reflux for 20hrs. The volume was reduced, cooled, filtered and then washed with 10% cold sodium hydroxide (2 x 25ml) to remove any traces of 4-hydroxycoumarin followed by the addition 50ml of CHCl3, shake vigorously in separation funnel and took the organic layer. The solvent was evaporated under reduced pressure to get solid 4- octyloxycoumarin in 79% yield (6.41g). It was further purified by recrystallization from ethanol; m.p. 49 – 51°C; Elemental analysis for C17H22O3, M.wt. 274; calculated (%) C 74.45, H 8.02; found (%)C 74.42, H 8.00.
2.3. Synthesis of 1– Amino –4 –Octyloxy–2–Quinoline–2(1H) – One (2)
- This intermediate was prepared with some modification according to literature [20]. An excess hydrazine hydrate (98%) (2.5g, 50mmol) and (1.37g, 5mmol) of compound 1 in ethanol (20 mL) were stirred under reflux for 12 hrs., reduce the volume by evaporation, cooled and the solid product was filtered and dried. Recrystallization from ethanol to get pale orange crystals in 68% yield (1.19g), m.p. 191 – 193°C Elemental analysis for C17H24N2O2, M.wt. 288; calculated (%) C 70.83, H 8.33, N 9.72; found (%) C 70.81, H 8.36, N 9.70.
2.4. Synthesis of the Ligand (LH)
- Equimolar amounts of compound 2 (2.88g, 10mmol) and 2,3 – butanedione oxime (1.01g, 10mmol) in ethanol (50ml) and few drops of glacial acetic acid were added as catalyst. The mixture was refluxed for 6h, cooled and the yellow solid filtered off, recrystallized from ethanol to get a bright yellow crystals in 64% yield (2.73g), m.p. 150 – 152°C. Elemental analysis for C21H29N3O3, M.wt.371; calculated (%) C 67.92, H 7.81, N 11.32; found (%) C 67.87, H 7.59, N 11.58.
2.5. Synthesis of the Metal Complexes
- The metal complexes of NiII, CuII, LaIII and CeIII were prepared by the reaction of metal chloride; CuCl2. 2H2O, NiCl2. 6H2O, LaCl3. 6H2O and CeCl3.6H2O dissolved in ethanol (20ml) and Schiff base ligand (LH) dissolved in ethanol (20ml) with 1:1 molar ratio for NiII, CuII and 1:2 molar ratio for LaIII and CeIII metal ions. The resulting mixture was stirred under reflux for 4hrs. Then cooled and filtered. Recrystallization took place from hot ethanol to get appropriate solid complexes in 58 – 76% yield. The synthetic route of the intermediated, Schiff base ligand and metal complexes was shown in scheme 1.
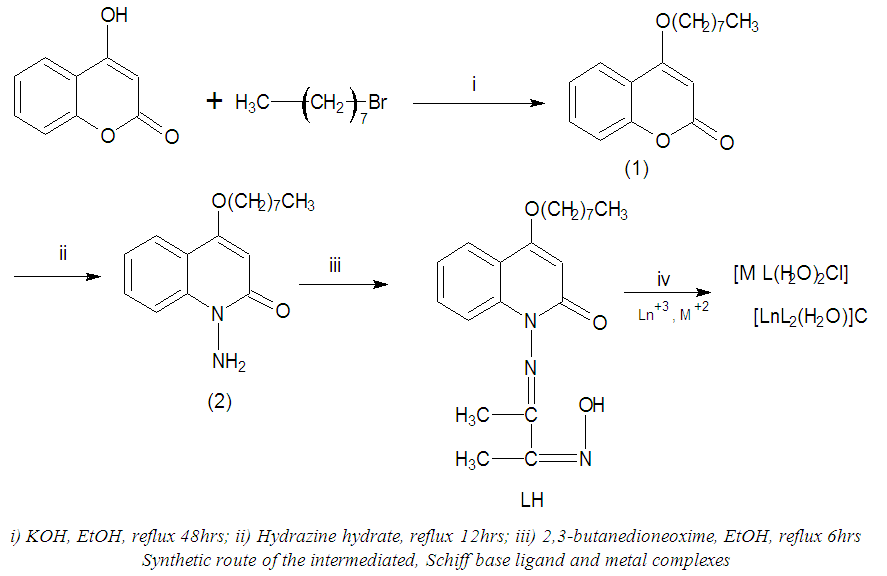 | Scheme 1 |
3. Results and Discussion
3.1. 1H NMR Spectra
- 1HNMR spectra were recorded using DMSO as solvent and TMS was used as an internal standard and the chemical shifts were reported in parts per million (ppm).The spectrum of the Schiff base ligand (LH) showed singlet peak at 11.85 δ ppm assigned to (=N–OH). Multiple peaks were observed in the range of 6.90–7.60 δ ppm attributed to the aromatic protons for the first ring and at 5.90 δ for the single proton of the second ring. The terminal aliphatic and – CH3 proton peaks were located at the range 1.80 – 2.50 δ ppm. The spectrum for LaIII complex showed the disappearance of phenolic (=N–OH) signal indicating the coordination occurs with deprotonation, while the signal corresponding to the aromatic and – CH3 were slightly shifted downwards (see figures 1 and 2).
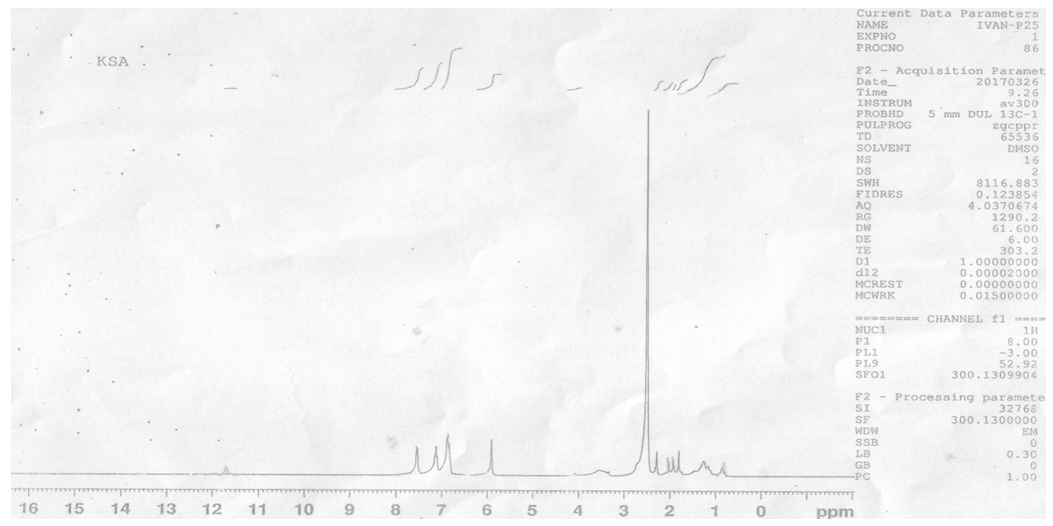 | Figure 1. 1HNMR spectrum of Ligand LH |
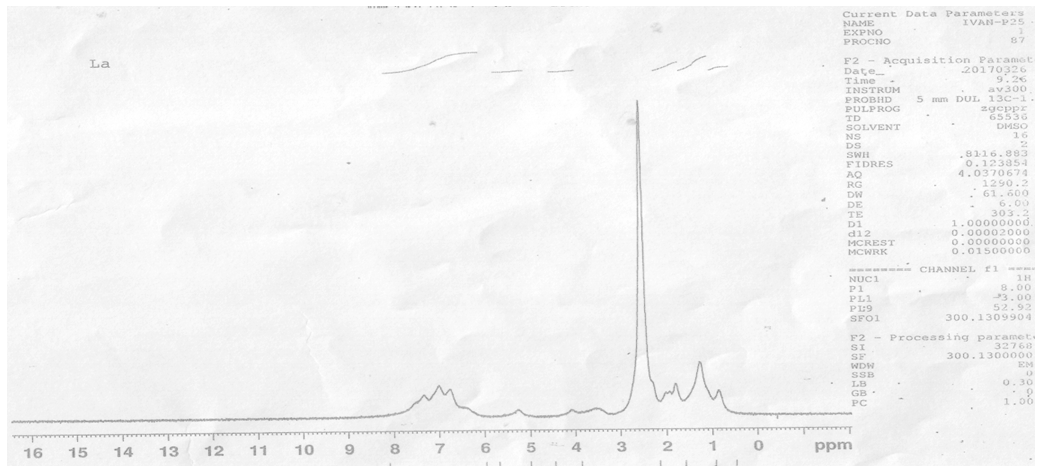 | Figure 2. 1HNMR spectrum of LaIII complex |
3.2. Infra – Red Spectra
- The (FT-IR) spectra were recorded in the region 4000–400 cm−1 by using KBr disc. The spectrum of the compound 2 contained two bands at 3,391 and 3,296 cm-1, attributed to symmetric and asymmetric ν NH2, another band at 1710 cm-1 was attributed to the ν C=O with two bands for aliphatic chain located at 2934 and 2855 cm−1. For the prepared ligand (LH), a new band for ν C=N at 1558 cm−1 with the disappearance of two bands for NH2 were recorded supporting the condensation reaction occurs between compound 2 and 2,3 – butanedione oxime. The νC=O was shifted download to 1688 cm-1 probably due to the formation of a hydrogen bonding with OH group which in turn appeared as slightly broad band at 3391 cm−1 [21-23].In the spectra of the metal complexes the disappearance of phenolic ν(O–H) with a little shift for the position of the (-C=N-) band was observed, while the (C=O) band slightly shifted upwards which clearly indicating the breaking of hydrogen bonding in the ligand but it still lower compared with compound 2. This is indicative of formation of coordination bonds with each group and the ligand LH behaves as tridentate (ONO) with the deprotonation of OH group. The observation of a broad band around 3400 cm-1 and two other bands at approximately 752 and 690 cm-1 for metal complexes indicating the presence of coordinated water molecules in all complexes [24]. New bands appeared in the complexes at approximately 570, 485 and 430 cm-1 attributed to M–N and M–O respectively [25, 26].
3.3. Mass Spectra
- Mass spectra were recorded using a Direct Injection Probe. The mass spectra features of the intermediates 1, 2 and the Schiff base ligand (LH ) were described by molecular ion peak at m/z = 274, 288 and 370 which confirm the molecular weight value and agree with the empirical formula of C17H22O3, C17H24N2O2 and C21H29N3O3 respectively. The spectrum of the Schiff base ligand; figure 3, showed intensity 100% for the base peak 176 which is assign to the cleavage of [C9H8N2O2]+ main aromatic character in the molecule. The peak at 91 (parent peak) is assign to the cleavage of the first ring [C6H4O]+, and the parent peak at 119 is assign to the cleavage of [C7H5NO]+. Scheme 2 suggested ligand fragmentation.
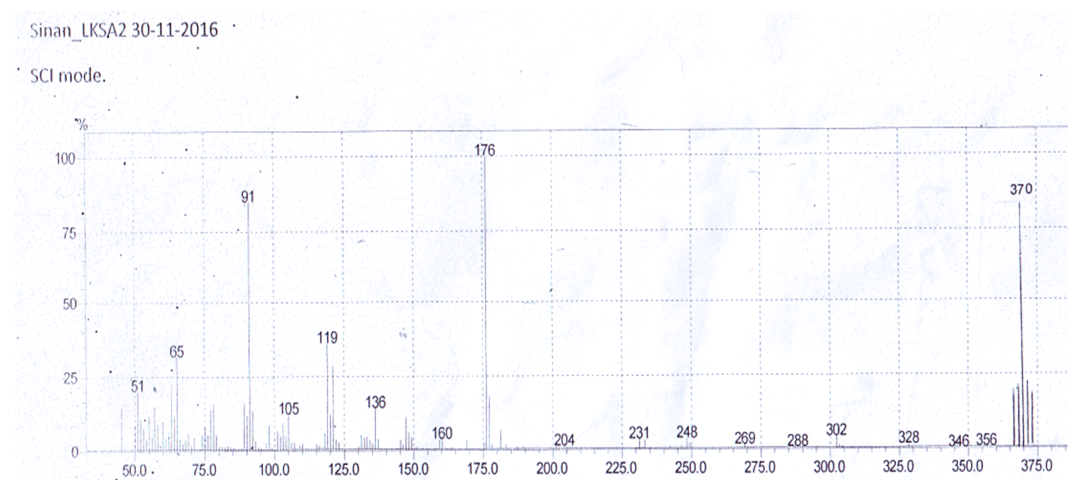 | Figure 3. Mass spectrum of the ligand LH |
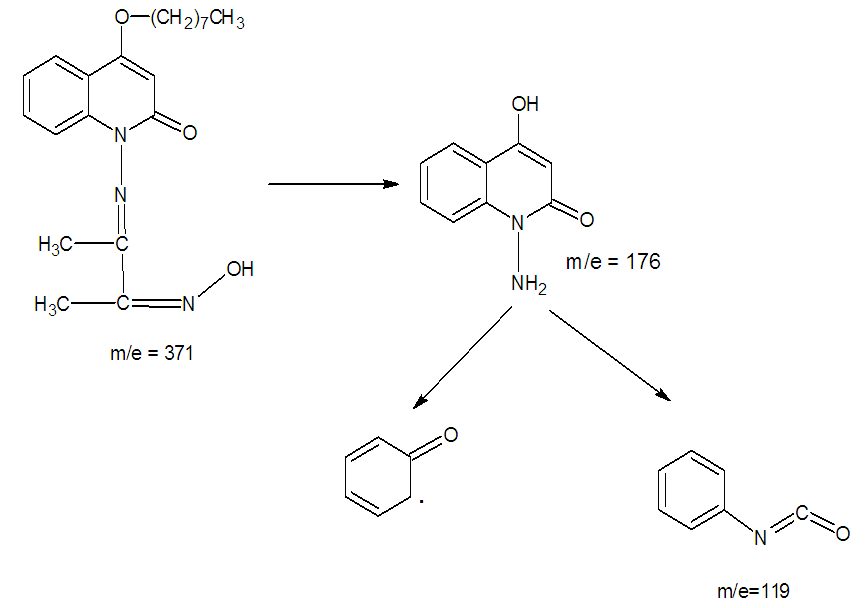 | Scheme 2. Suggested ligand fragmentation |
3.4. UV–Visible Spectra
- The ligand and metal complexes were recorded in a region 200 – 900nm using concentration of 10-3 M and absolute ethanol as a solvent. Three strong bands were recorded for the ligand at 295, 249, and 229 nm attributed to n→ π* for (C=O) and (C=N) and π→ π* for (C=C) groups respectively [27-29]. Three d → d transitions for NiII were recorded which presumably attributed to the transitions 3A2g →3T2g (F), 3A2g→3T1g (F), and 3A2g→3T1g (P), respectively suggesting a high-spin octahedral geometry [21], while only one broad band observed for the CuII complex due to 2Eg→2T2g transition which when combined with infra-red spectrum, suggesting a distorted octahedral geometry [21].
3.5. Magnetic Measurements
- Magnetic susceptibility was measured for all the complexes at room temperature by use of Faraday method.Due to the absence of d electrons of LaIII complex, only metal complexes of NiII, CuII and CeIII were measured. Octahedral geometry is suggested for the NiII complex by the observed magnetic moment μeff = 2.90 B.M which indicate the absence of orbital contribution of the t2g6 (all the t2g orbitals are doubly occupied and electron transfer is impossible). Distorted octahedral geometry is suggested for the cell complex because the value recorded for the magnetic moment was μeff = 1.78 B.M [32]. For CellI complex a magnetic moments of (2.52 B. M.) was observed which appeared to be deviate considerably from the spin-only values (for one electron) which can be referred to the strong spin–orbit coupling of lanthanide complexes [33].
3.6. Molar Conductivity Measurements
- The molar conductivity measurements for the complexes were carried out using a concentration of 10−3 M and dimethyl sulfoxide as a solvent and CON 510 bench conductivity meter (cell constant, K = 1.0).The complexes of NiII and CuII showed a behavior of non-electrolyte type indicating the presence of chloride ion inside the coordination sphere, while LaIII and CeIII complexes showed of the 1:1 electrolyte type, and these results agree with the suggested configurations of the metal complexes.
3.7. Thermo Gravimetric Analyses
- Thermo gravimetric analyses (weight changes) were performed in the temperature up to 600°C under argon atmosphere at the heating rate of 20°C/min. The thermogram of CuII complex recorded three stages of weight loose (Figure 4). The first one showed the initial weight loss in the temperature around 235°C probably due to the loss of coordinated water molecule [34]. The anhydrous complexes remain stable up to 415°C then the complex suffered a rapid and big weight loose due to the decomposition of organic constituents of the complex molecule. The metal oxide could be represent the final residue with attaining a constant weight [35, 36].
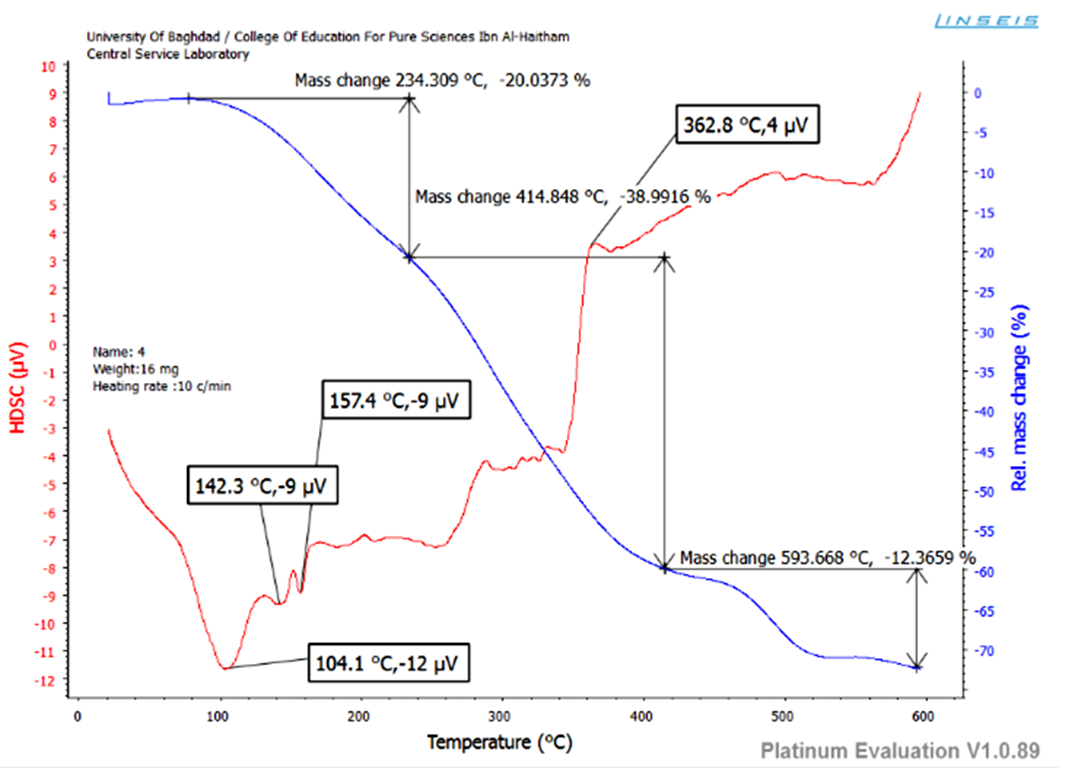 | Figure 4. TGA diagram of CuII complex |
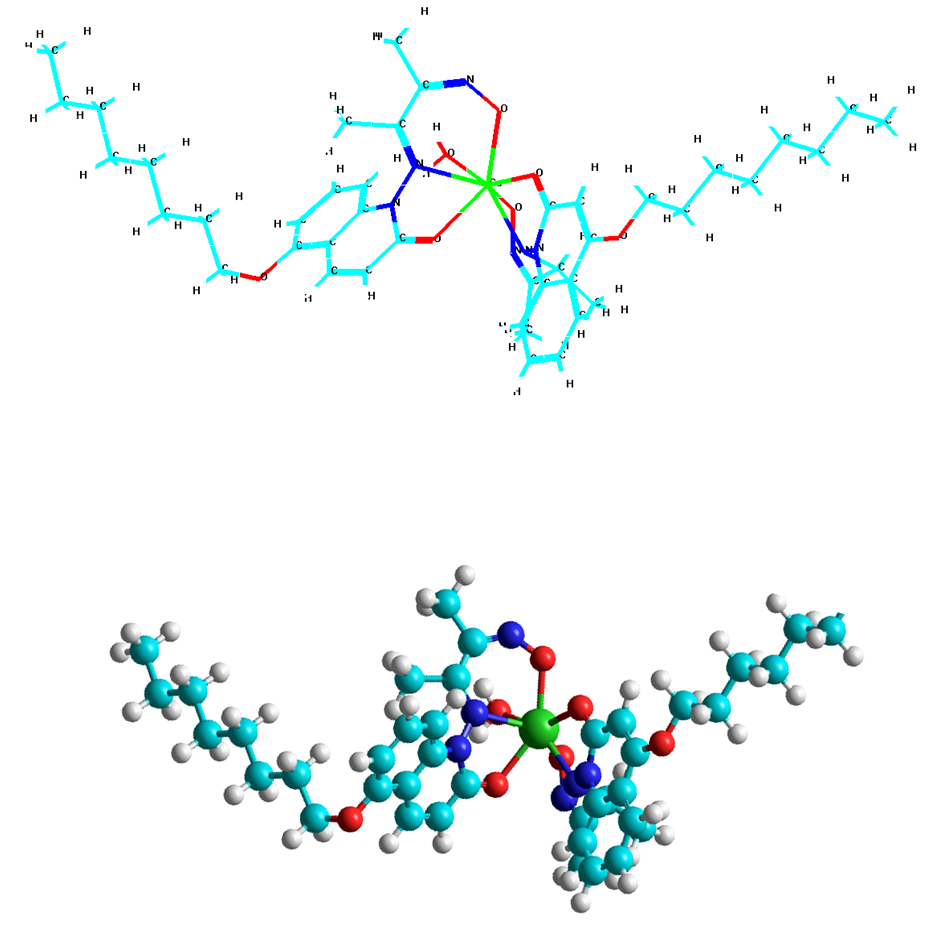 | Figure 5. The space structure of CeIII complex with (O, N,O,O, O,N,O)-coordination sites |
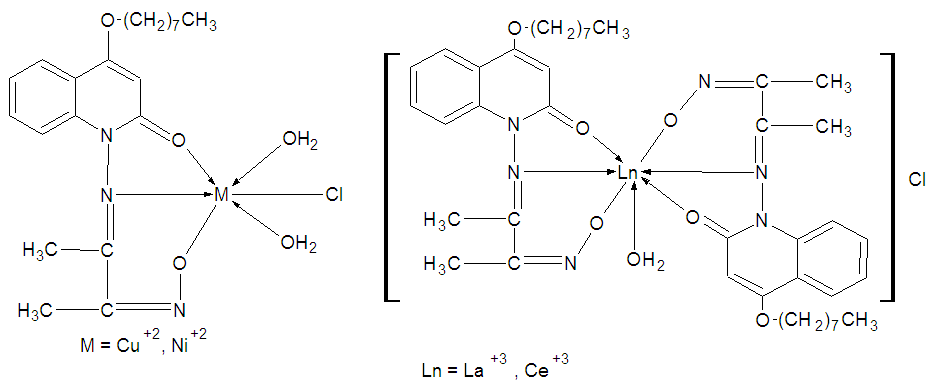 | Figure 6. Proposed structures of the Metal complexes |
4. Conclusions
- Single arm Schiff base complexes based on coumarin derivative were synthesized and characterized. Investigations of the collected results are consistent with the stoichiometry [ML(OH2)2Cl], were M= CuII, NiII and [LnL2(OH2)], were Ln=LaIII and CeIII respectively.
ACKNOWLEDGMENTS
- The author would like to thank the University of Al Albait, Amman, Jordan for spectral data and Al-Mustansiryah University, College of Science for providing the financial support.