-
Paper Information
- Next Paper
- Paper Submission
-
Journal Information
- About This Journal
- Editorial Board
- Current Issue
- Archive
- Author Guidelines
- Contact Us
American Journal of Chemistry
p-ISSN: 2165-8749 e-ISSN: 2165-8781
2017; 7(5): 163-170
doi:10.5923/j.chemistry.20170705.02

Preparation and Development of a Novel Activated Carbon based on Moroccan Oil Shale Using Activation Process
 Abstract
 Reference
 Full-Text PDF
 Full-text HTML
Nawal Elhammoudi1, Mina Oumam1, Said Mansouri1, Az-iddin Chham1, Abdelkrim Abourriche2, Hassan Hannache3
1Laboratory of Engineering and Materials LIMAT, Faculty of Science Ben M’sik, University Hassan II de Casablanca, Casablanca, Morocco
2Laboratory of Materials, Processes, Environment and Quality, Department of chemistry, Cady Ayyed University, National School of Applied Sciences, Safi, Morocco
3Center of Advanced Materials, EMINES, University Mohammed VI Polytechnic, Ben Guerir, Morocco
Correspondence to: Nawal Elhammoudi, Laboratory of Engineering and Materials LIMAT, Faculty of Science Ben M’sik, University Hassan II de Casablanca, Casablanca, Morocco.
| Email: |  |
Copyright © 2017 Scientific & Academic Publishing. All Rights Reserved.
This work is licensed under the Creative Commons Attribution International License (CC BY).
http://creativecommons.org/licenses/by/4.0/

The objective of this study is the optimization of experimental conditions and the identification of various parameters influencing the preparation of the activated carbon using activation process. The results obtained throughout this work confirm good adsorption capacity of the activated carbon based on Moroccan oil shale. The (SEM) and (FTIR) analysis were used to confirm the adsorption performance of activated carbon from oil shale. Moreover, the Langmuir isotherm showed the best fit with experimental data, the maximum adsorption capacity of cadmium (II) ions was determined to be 55.87 mg/g. The kinetics analysis illustrates that the adsorption processes can be described by the pseudo-first order model.
Keywords: Moroccan Oil shale, Activated carbon, Activation process, Equilibrium and kinetics study
Cite this paper: Nawal Elhammoudi, Mina Oumam, Said Mansouri, Az-iddin Chham, Abdelkrim Abourriche, Hassan Hannache, Preparation and Development of a Novel Activated Carbon based on Moroccan Oil Shale Using Activation Process, American Journal of Chemistry, Vol. 7 No. 5, 2017, pp. 163-170. doi: 10.5923/j.chemistry.20170705.02.
Article Outline
1. Introduction
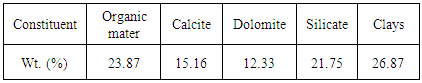
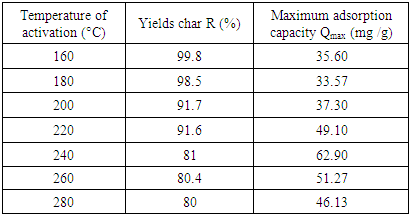
- In the context of the valorization of natural resources, we proceeded to transformation of the Moroccan oil shale to activated carbon. The aim of this work is to optimize the conditions for the preparation of activated carbon using activation process. During the first step, we prepared the rock of Moroccan oil shale, our choice was on the Timahdit deposit especially the Y-layer. The oil shale rock is composed of carbonates, the elimination of which is relatively simple. Indeed, the presence of organic matter and clays in oil shale encouraged us to prepare the activated carbon by physical or chemical activation based on Moroccan oil shale (Table 1). The activated carbon from the oil shale is intended for applications in the field of sewage water treatment. Oil shale is a sedimentary rock drowned of organic matter called kerogen [1, 2]. It is essentially an immature geological form of oil [3]. It is estimated that there are at least 8 trillion barrels of oil shale resources around the world [4].
|
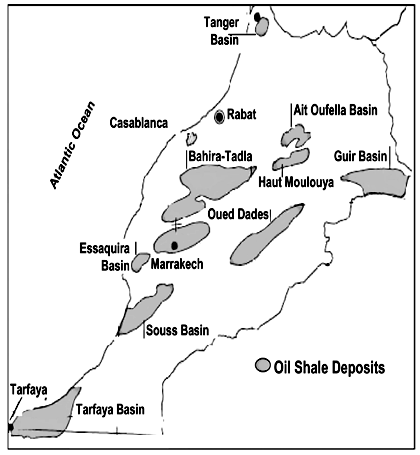 | Figure 1. Map of Moroccan resources [7] |
2. Materials and Methods
2.1. Preparation of Activated Carbon Based on Oil Shale
- The raw material used is Moroccan oil shale (Y-layer). This material is composed from the organic matter and the mineral matter [12]. The raw rock (Y) there was crushed, and then ground. At a mass of the powder (Y) was lixiviate with hydrochloric acid, to obtain the concentrated oil shale to be named (YC). The precursor (YC) was mixed with the sulfuric acid different ratio mH2SO4/mYC.The mixture was heated in electric furnace under oxidant atmosphere gaze at different temperatures, after preprocessing at 140°C in oven under air. The (YCS) precursor are subjected to extensive washing with distilled water in a soxhlet apparatus for 72 h, to eliminate excess acid (H2SO4) then dried at 80°C (Figure 2).
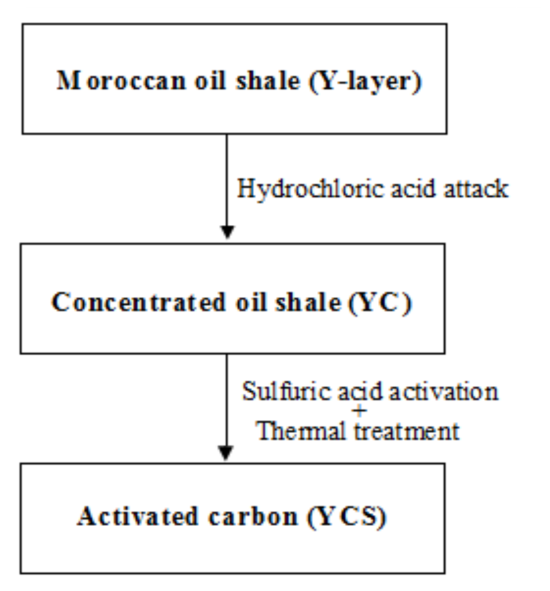 | Figure 2. Scheme for elaboration of activated carbon (YCS) |
3. Results and Discussion
3.1. Experimental Response
3.1.1. Yield Char
- The yield char or activation yield of the prepared activated carbon is determined from the mass of the concentrated rock initially used. It is given by the following formula (Eq. (1)) [13]:
 | (1) |
3.1.2. Maximum Adsorption Capacity
- This method provides several equilibrium points at one time under similar experimental conditions. We adopted to determine maximum adsorption capacity of cadmium (II) ions by activated carbon, the adsorption of cadmium on the activated carbon has been realized on the solution from cadmium chloride. A solution of cadmium (II) ions of concentration 30 mg/L was prepared by dissolving 50 mg of CdCl2 in a 1000 mL volumetric flask. This solution was stirred on a magnetic stirrer for one hour to obtain homogeneity. The pH of the mixture was adjusted either with 0.1 N HCl or 0.1 N NaOH. The cadmium concentration was determined using atomic absorption spectroscopy (AAS). At the end of each series of experiments, the equilibrium concentration in cadmium was determined by atomic absorption spectroscopy and the mass of cadmium adsorbed per gram of activated carbon. The amount of cadmium (II) ions adsorbed per unit mass of activated carbon (Qmax) was calculated using the following formula (Eq. (2)) [14]:
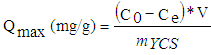 | (2) |
3.2. Concentration of the Organic Matter
- We studied the influence of concentration in the organic matter by the hydrochloric acid with the maximum capacity of adsorption of cadmium (II) ions. The quantity of oil shale powder (Y) was added under agitation to a solution of HCl (1 mol /L) until the complete release of carbon dioxide. The concentrated oil shale will be named (YC).From the histogram in Figure 3, we see that the maximum adsorption capacity of Cd (II) ions depends on the concentration of organic matter by the hydrochloric acid. Indeed, when hydrochloric acid is present, the maximum adsorption capacity of Cd (II) ions increase at 58.33 (mg/g) while the concentration of organic matter by the hydrochloric acid increase the maximum adsorption capacity for Cd (II) ions up to six times. This can be explained by the elimination of mineral matter (carbonate) of oil shale by the hydrochloric acid.
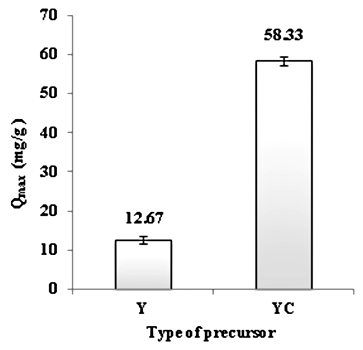 | Figure 3. Effect of the concentration of organic matter on adsorption capacity of Cd (II) ions |
3.3. Activation Process
- Activation with sulfuric acid has become a widespread method for the manufacturer of activated carbon [15]. The use of sulfuric acid has some environmental benefits such as easy recovery and low cost of energy [16]. The sulfuric acid acts as a catalyst to promote bond cleavage, dehydration, and may operate as a template because the volume occupied by sulfuric acid to the interior of the activated carbon is coincident with the micropore volume of the activated carbon obtained [17]. The precursor (YC) was activated by the sulfuric acid H2SO4. The product obtained, referenced by (YCS) where "S" designates the activation with sulfuric acid H2SO4.
3.3.1. Effect of Massic Ratio (mH2SO4 /mYC)
- The sulfuric acid impregnation stage plays a key role in the activation process. To start with, we set the objective by determining at what range does the optimal acid massic ratio (weight of acid/ weight of YC) stand. We have systematically used the Cd (II) ions, an inorganic compound commonly used for tracer studies in water research on the activated carbon based on oil shale as performance indicators for all products obtained for this purpose. The precursor (YC) was activated by the sulfuric acid H2SO4 at 300°C temperature for 1 hour. The sulfuric acid concentration 18 mol/L has been used for these series of tests. The adsorption of cadmium (II) ions tests showed that the preferable massic ratio expressed in (kg of acid/kg of YC) should be between 2 and 2.5 for sulfuric acid. The rates of cadmium adsorption are also higher in these two ranges of values (Figure 4).
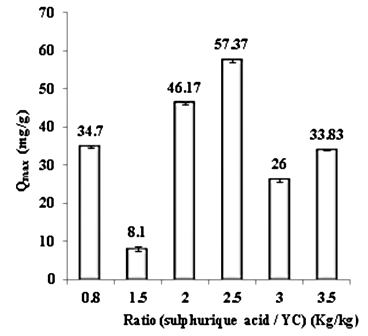 | Figure 4. Evaluation of the massic ratio on maximum adsorption capacity of Cd (II) ions |
3.3.2. Concentration, Quantity and Consumption of Sulfuric Acid
- To define the concentration and the required amount of the acid for the production of the activated carbon (YCS), we have varied the concentration of sulfuric acid for each massic ratio within the respective range. The cadmium metal may represent inorganic compound to be absorbed. This result is important because it tells us that we can act at the level of operating conditions for the preparation of specific adsorbent.
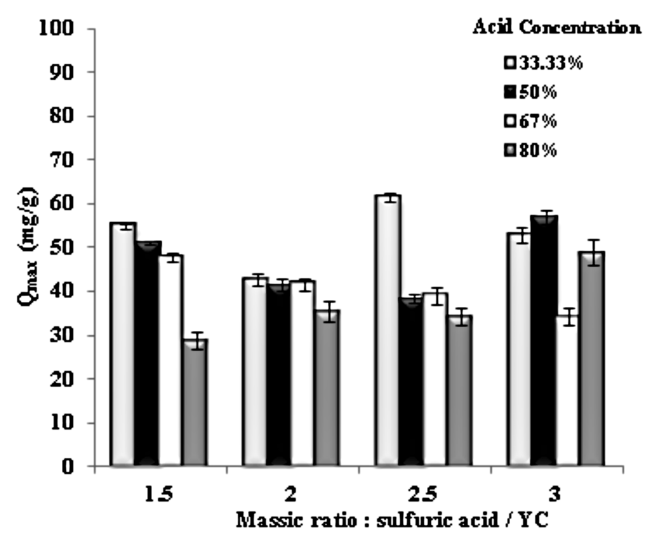 | Figure 5. Evaluation of concentration and quantity of sulfuric acid |
3.3.3. Effect of Activation Temperature
- The activation temperature for (YCS) was determined at 33.33(%) of sulfuric acid. The curve plotted below according to the capacities of adsorption Cd (II) ions clearly shows that the treatment temperature (YCS) optimum is around 240°C. From the results presented in Table 2, the acid sulfuric requirement was determined by the use of (YCS).
|
3.3.4. Effect of Activation Time
- The last activation parameter investigated was the activation time. To determine the effect of activation time on the maximum adsorption capacity of Cd (II) ions, adsorption experiments have been conducted by varying the activation time from 30 min to 120 min. The effect of the activation time is shown in Figure 6. The optimum activation time was found to be 30 min.
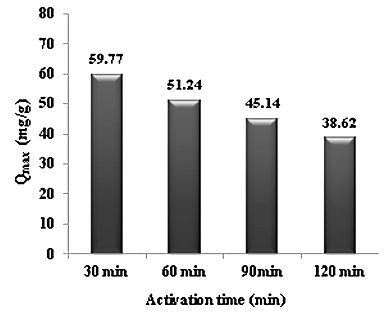 | Figure 6. Evaluation of the activation time on maximum adsorption capacity of Cd (II) ions |
3.4. Characterization
3.4.1. Fourier Transform Infrared Spectroscopy (FTIR) Analysis
- Fourier Transform Infrared (FTIR) Spectroscopy is one of the important techniques which base its functionality on the principle that almost all molecules absorb infrared light. The FTIR spectrum of the (Y) and (YCS) prepared for oil shale is shown in the following plots.
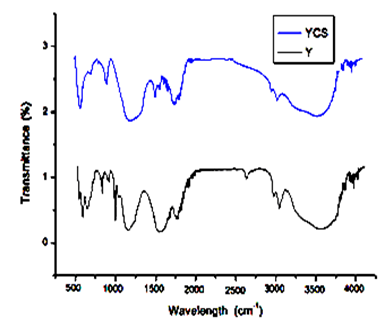 | Figure 7. Fourier transform infrared (FTIR) spectra plots of (Y) and (YCS) |
3.4.2. Scanning Electron Microscope (SEM) Analysis
- The images of the (Y) and (YCS) surface are obtained from scanning electron microscope (SEM). Scanning Electron Microscope (SEM) analysis revealed the surface structure of the samples. (SEM) images of concentrated oil shale and activated carbon were presented in Figure 8. In all the cases the well-developed porous surface was apparent.
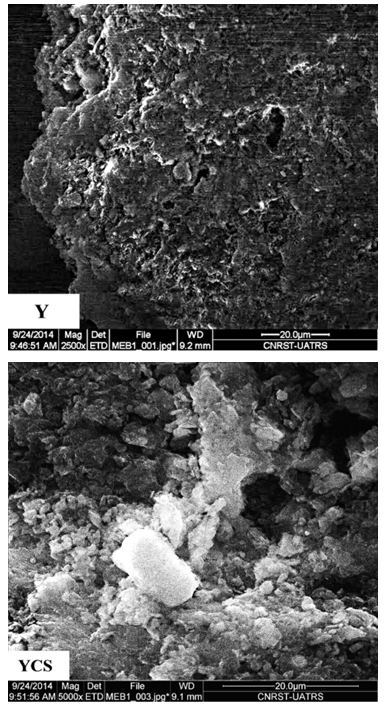 | Figure 8. SEM images of (Y) and (YCS) |
3.5. Adsorption Equilibrium
- The Adsorption equilibrium was applied to discuss the equilibrium of the adsorption process for Cd (II) on activated carbon based on oil shale (YCS).
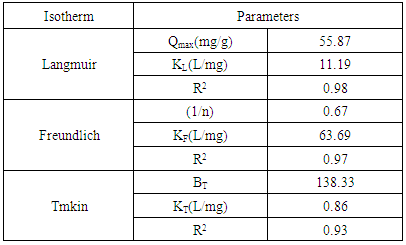
3.5.1. Langmuir Isotherm
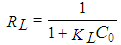
- The Langmuir isotherm is valid for single-layer adsorption on a surface containing a finite number of identical sites. The linear Langmuir isotherm represented the following equation [18]:
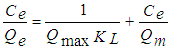 | (3) |
 | (4) |
3.5.2. Freundlich Isotherm
- Freundlich isotherm is one of the first empirical equations. The Freundlich Isotherm takes the form of [20]:
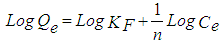 | (5) |
3.5.3. Temkin Isotherm
- Temkin is one of the isotherms that assume the heat of adsorption decreases linearly with an increasing coverage. The Temkin isotherm model is as follows [22]:
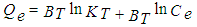 | (6) |
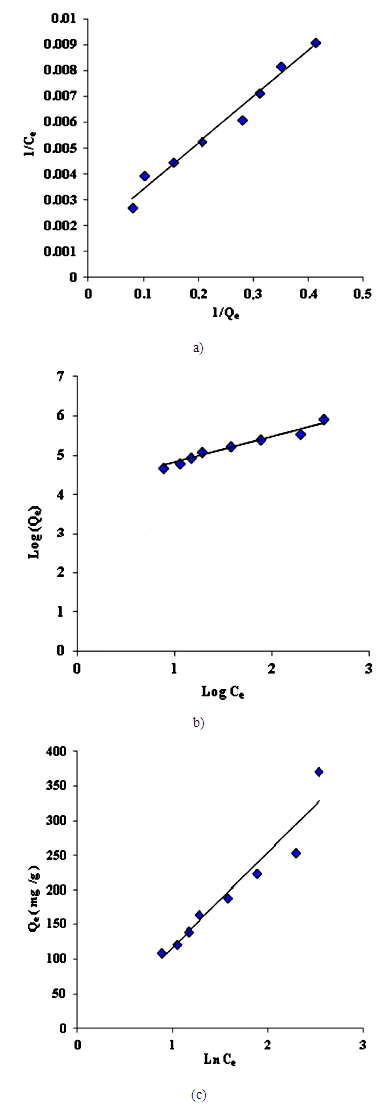 | Figure 9. (a) Langmuir isotherm for adsorption of Cd (II) ions, (b). Freundlich isotherm for adsorption of Cd (II) ions, (c). Temkin isotherm for adsorption of Cd (II) ions |
3.6. Adsorption Kinetics
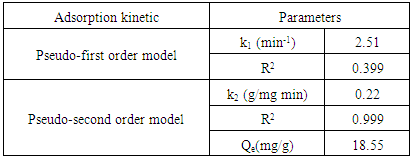
- The experimental kinetics data of removal of Cd (II) ions assessed by conventional models, namely the pseudo-first and second order, in order to study of the mechanism of the adsorption process. Kinetics properties and constant of model are presented in Table 4 at the initial Cd (II) ions concentration of 20 mg/L using 0.1g of activated carbon based on oil shale (YCS).
3.6.1. Model of Pseudo-first Order
- The pseudo-first order model presented in Eq. (7), by plotting the values of log (Qe - Qt) versus t, the k1 and Qe values can be determined from its slope and the intersection.
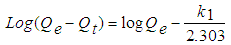 | (7) |
3.6.2. Model of Pseudo-second Order
- The model of pseudo-second order may be described in a linear form as:
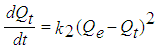 | (8) |
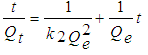 | (9) |
|
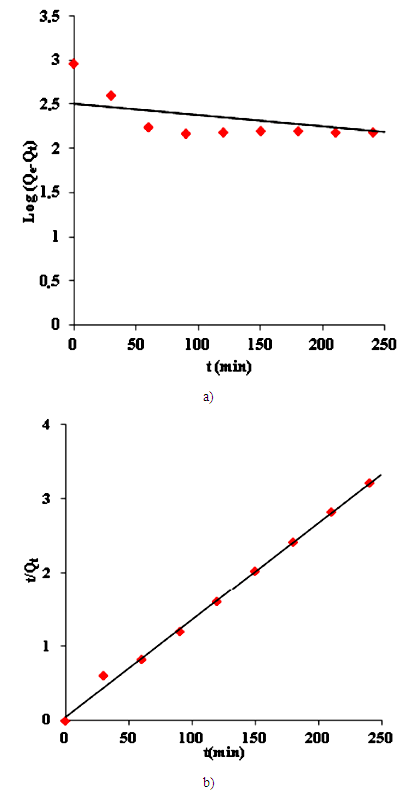 | Figure 10. (a) Plots of pseudo-first order kinetic for Cd (II) ions, (b) plots of pseudo-second order kinetic for Cd (II) ions |
4. Conclusions
- The study that was carried allowed for the determination of the optimum preparation conditions of activated carbon, in particular the activation parameters. This study shows that the optimum conditions for the preparation of the activated carbon by activation process is 240°C, massic ratio of 2.5 and 33% of sulfuric acid. The adsorption kinetic and equilibrium were found to be in good agreement with pseudo-second order and Langmuir model, respectively. The maximum adsorption capacity of cadmium by (YCS) achieved was 55.87 mg/g, which is very encouraging and we remain highly confident in light of the results produced in this study.
ACKNOWLEDGMENTS
- We gratefully acknowledge the support and help of ‘‘Centre National de Recherche Scientifique et Technique (CNRST) from MOROCCO”.
References
| [1] | K. Bjørlykke, Petroleum geoscience: From sedimentary environments to rock physics. Second edition, 2015. |
| [2] | E. C. Moine, M. Tangarfa, M. Khachani, A. El Hamidi, M. Halim, and S. Arsalane, “Thermal oxidation study of Moroccan oil shale: A new approach to non-isothermal kinetics based on deconvolution procedure,” Fuel, vol. 180, pp. 529–537, 2016. |
| [3] | J. G. Speight, “Refining Shale Oil,” in Shale Oil Production Processes, 2012, pp. 139–163. |
| [4] | J. R. Dyni, “Geology and resources of some world oil-shale deposits,” Oil Shale, vol. 20, no. 3. pp. 193–252, 2003. |
| [5] | S. Guven, S. Akin, and B. Hascakir, “Comprehensive spectral and thermal characterization of oil shales,” in Society of Petroleum Engineers SPE Middle East Unconventional Resources Conference and Exhibition. The Journey of Unconventional Resources: From Exploration to Successful Development, 2015, pp. 402–414. |
| [6] | A. Kundu et al., “Micro-fuel cells-Current development and applications,” Journal of Power Sources, vol. 170, no. 1. pp. 67–78, 2007. |
| [7] | E. Knaus, J. Killen, K. Biglarbigi, and P. Crawford, “An overview of oil shale resources,” in ACS Symposium Series, 2010, vol. 1032, pp. 3–20. |
| [8] | H. Barkia, L. Belkbir, and S. A. A. Jayaweera, “Oxidation kinetics of Timahdit and Tarfaya Moroccan oil shales,” Fuel Energy Abstr., vol. 45, no. 3, p. 167, 2004. |
| [9] | K. El Harfi, A. Mokhlisse, M. B. Chanâa, and A. Outzourhit, “Pyrolysis of the Moroccan (Tarfaya) oil shales under microwave irradiation,” Fuel, vol. 79, no. 7, pp. 733–742, 2000. |
| [10] | M. Elharti et al., “Preparation of adsorbent material from Moroccan oil shele of Timahdit: Optimization of parameters processes and adsorption tests,” Der Pharma Chem., vol. 4, no. 5, pp. 2130–2139, 2012. |
| [11] | A. Aboulkas and K. El Harfi, “Study of the kinetics and mechanisms of thermal decomposition of Moroccan Tarfaya oil shale and its kerogen,” in Oil Shale, 2008, vol. 25, no. 4, pp. 426–443. |
| [12] | A. Saoiabi, A. Doukkali, M. Hamad, A. Zrineh, M. Ferhat, and Y. Debyser, “Comportement thermique des schistes bitumineux de Timahdit (Maroc),” Comptes Rendus l’Academie des Sci. - Ser. IIc Chem., vol. 4, no. 5, pp. 361–366, 2001. |
| [13] | M. Sevilla, G. A. Ferrero, and A. B. Fuertes, “Beyond KOH activation for the synthesis of superactivated carbons from hydrochar,” Carbon N. Y., vol. 114, pp. 50–58, 2017. |
| [14] | K. Z. Elwakeel, A. M. Daher, A. I. L. A. El-fatah, H. A. El Monem, and M. M. H. Khalil, “Biosorption of lanthanum from aqueous solutions using magnetic alginate beads,” J. Dispers. Sci. Technol., vol. 38, no. 1, pp. 145–151, 2016. |
| [15] | W. Davenport, M. King, B. Rogers, and a Weissenberger, “Sulphuric Acid Manufacture,” South. African Pyrometallurgy 2006, no. March, pp. 5–8, 2006. |
| [16] | S. Mashhadi, H. Javadian, M. Ghasemi, T. A. Saleh, and V. K. Gupta, “ Microwave-induced H2SO4 activation of activated carbon derived from rice agricultural wastes for sorption of methylene blue from aqueous solution,” Desalin. Water Treat., vol. 57, no. 44, 2016. |
| [17] | Z. Z. Chowdhury et al., “Preparation of carbonaceous adsorbents from lignocellulosic biomass and their use in removal of contaminants from aqueous solution,” BioResources, vol. 8, no. 4, pp. 6523–6555, 2013. |
| [18] | S. J. Allen, G. Mckay, and J. F. Porter, “Adsorption isotherm models for basic dye adsorption by peat in single and binary component systems,” J. Colloid Interface Sci., vol. 280, no. 2, pp. 322–333, 2004. |
| [19] | M. Ghaedi et al., “Cadmium telluride nanoparticles loaded on activated carbon as adsorbent for removal of sunset yellow,” Spectrochim. Acta - Part A Mol. Biomol. Spectrosc., vol. 90, pp. 22–27, 2012. |
| [20] | C. Sheindorf, M. Rebhun, and M. Sheintuch, “A Freundlich-type multicomponent isotherm,” J. Colloid Interface Sci., vol. 79, no. 1, pp. 136–142, 1981. |
| [21] | T. A. Khan, S. A. Chaudhry, and I. Ali, “Equilibrium uptake, isotherm and kinetic studies of Cd(II) adsorption onto iron oxide activated red mud from aqueous solution,” J. Mol. Liq., vol. 202, pp. 165–175, 2015. |
| [22] | S. Azizian, “Kinetic models of sorption: A theoretical analysis,” J. Colloid Interface Sci., vol. 276, no. 1, pp. 47–52, 2004. |
| [23] | D. Robati, “Pseudo-second-order kinetic equations for modeling adsorption systems for removal of lead ions using multi-walled carbon nanotube,” J. Nanostructure Chem., vol. 3, no. 1, p. 55, 2013. |
| [24] | R. M. Ali, H. A. Hamad, M. M. Hussein, and G. F. Malash, “Potential of using green adsorbent of heavy metal removal from aqueous solutions: Adsorption kinetics, isotherm, thermodynamic, mechanism and economic analysis,” Ecol. Eng., vol. 91, pp. 317–332, 2016. |