-
Paper Information
- Paper Submission
-
Journal Information
- About This Journal
- Editorial Board
- Current Issue
- Archive
- Author Guidelines
- Contact Us
American Journal of Chemistry
p-ISSN: 2165-8749 e-ISSN: 2165-8781
2017; 7(2): 48-57
doi:10.5923/j.chemistry.20170702.02

Na doped ZnO Nanoparticles Assisted Photocatalytic Degradation of Congo Red Dye using Solar Light
 Abstract
 Reference
 Full-Text PDF
 Full-text HTML
Taha M. Elmorsi, Mohamed Hammad Elsayed, Mostafa F. Bakr
Chemistry Department, Faculty of Science, Al-Azhar University, Cairo, Egypt
Correspondence to: Taha M. Elmorsi, Chemistry Department, Faculty of Science, Al-Azhar University, Cairo, Egypt.
| Email: |  |
Copyright © 2017 Scientific & Academic Publishing. All Rights Reserved.
This work is licensed under the Creative Commons Attribution International License (CC BY).
http://creativecommons.org/licenses/by/4.0/

A simple route of synthesis of doped ZnO nanoparticles with efficient response to solar light has always been demanded. Doped ZnO has been applied as a photocatalyst for the degradation of hazardous dyes such as Congo red (CR) dye. In this study, a simple approach for Na-doped ZnO (Na-ZnO) nanoparticles by co-precipitation using NaOH as a precipitating and doping agent was reported. Changing the molar ratio between the moles of NaOH and Zn+2 ions as 3:1 was the main key for this approach. As-prepared Na-ZnO was characterized by different morphological and optical analysis. Na-ZnO confirmed to be solar photocatalyst used for the degradation of aqueous solution of 30 mg/L CR dye with high efficient as 98.9% removal in 70 min under direct sunlight. Moreover, main parameters affecting the photocatalytic degradation of CR dye such as the effect of pH, initial dye concentration and effect of day time on the photodegradation process of CR dye were investigated. In presence of direct sunlight, Na-ZnO enhanced the photodegradation and the mineralization of 30 mg/L CR dye at pH 9. The rate of photodegradation found to decrease with increasing its initial concentration due to a constant number of •OH radicals compared to the concentration of CR dye. The photodegradation of CR using Na-ZnO under sunlight followed a first order kinetics. Determining the decrease in the value of chemical oxygen demeaned (COD) indicated that about 97% of 20 mg/L CR dye were mineralized in 4.0 hr. In addition, Na-ZnO acts as a demand photocatalyst with high efficiency for the mineralization of CR dye with 99% removal up to 7 recycles. The results of this research concluded that Na-ZnO has an efficient potential to be used as a commercial solar photocatalyst.
Keywords: Solar photocatalysts, Na doped ZnO, ZnO, Congo red, Nanorods
Cite this paper: Taha M. Elmorsi, Mohamed Hammad Elsayed, Mostafa F. Bakr, Na doped ZnO Nanoparticles Assisted Photocatalytic Degradation of Congo Red Dye using Solar Light, American Journal of Chemistry, Vol. 7 No. 2, 2017, pp. 48-57. doi: 10.5923/j.chemistry.20170702.02.
Article Outline
1. Introduction
- Organic compounds such as dyes present in wastewater stream of industry and agriculture are the main sources for the environmental problems. To purify water and wastewater contaminated by dyes, several physical and chemical techniques have been employed. Conventional treatment methods, such as coagulating sedimentation, electro-coagulation, and adsorption by activated carbon, are unproductive for completely removing the organic compound from industrial wastewater [1]. Advanced oxidation processes (AOPs) compose significant, promising, effective and environmentally friendly methods, that characterized by the generation of hydroxyl radicals, which are highly reactive and non-selective substances used to mineralize toxic organic compounds present in wastewater to CO2, water and mineral salts[2]. Heterogeneous photocatalysis is a very important method than the other AOPs process because it employs low energy UV light, with reusable and nontoxic semiconductor catalyst (such as TiO2, ZnO etc), and it does not require addition of any other strong oxidants [3]. ZnO is a semiconductor used in field emission, short-wavelength optoelectronics, electroacoustic transducers, gas sensors, transparent conducting coating materials, piezoelectric devices, and photocatalysis [4]. When ZnO irradiated by photon at suitable energy (λ<400 nm), electrons excited from valence band (VB) to the conduction band (CB), resulting hole in the valence band and electron in the conduction band. These electron-hole pairs produce a series of oxidation-reduction reaction which can mineralize organic pollutant into CO2 and H2O. ZnO has wide bandgap energy around 3.3 eV, it can just be activated by UV light of which is about 5-7% of the sun's rays [5]. Thus, we need to improve this faintness of ZnO. Many researchers have tried to modify ZnO by metal doping to enhance the using of the solar spectrum. The impurities made by metal ions doping into the ZnO could efficiently narrow its band gap and extend the absorption edge into the visible light range [6]. Many dopants such as N, P, Sb, Er and Al have been used [7-11]. Especially, Na was considered as one of the most important doping elements for improving the photocatalytic activity of ZnO because of the different structure of the electronic shell and the similar size of Na and Zn [5]. Recently several techniques were reported for preparation of Na-doped ZnO such as sol–gel method [12], Pulsed-laser deposition (PLD) [13], chemical vapor deposition (CVD) [14] and continuous flow microreactor (CFM) [5]. Also S.V. Elangovan et al. [15] use CH3COONa as doping agent and NaOH as precipitating agent for preparation of Na-ZnO and pure ZnO by wet chemical method. However, its enhancement for photocatalytic activity compared to pure ZnO was small. Here we report the preparation of Na-doped ZnO by co-precipitation method as a simple method in which NaOH used as a precipitating and doping agent without any surfactant. The Na-ZnO characterized by different technique such as XRD, HRTEM, SEM-EDX, N2 adsorption, IR, XRF and ICP-OES. As-prepared Na-ZnO used for photocatalytic degradation of congo red dye (anionic dye) under direct sunlight.
2. Experimental
2.1. Materials and Reagents
- Congo red (CR) an anionic dye (Figure 1) with Molar Mass of 696.7 g/mol) used in the present work, zinc acetate dihydrate and ferrous ammonium sulphate were purchased from LOBA Chemie Company, India. Sodium hydroxide, Potassium dichromate, potassium iodide, ferrous sulphate and concentrated sulphuric acid purchased from Biotech laboratory chemicals Company. Ethyl alcohol was purchased from ADWIC Company and 1-10-phenanthroline mono hydrate was purchased from Merck Company. Dilute solutions of HNO3 and NaOH were prepared to control the pH during the experiments. All chemicals were used without further purification. A stock solution of CR dye with a concentration of 1000 mg/L was prepared in distilled water and further diluted to perform the photodegradation experiments.
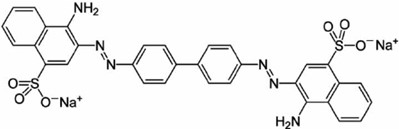 | Figure 1. Molecular structure of Congo red |
2.2. Preparation and Characterization of the Photocatalyst
- Both pure ZnO and Na-doped ZnO nanoparticles (Na-ZnO) were prepared by co-precipitation method [5, 16] based on the ratio between moles of NaOH and Zn+2 ions as reported in our previous research [17]. Briefly, pure form of ZnO nanoparticles was prepared by using 1:1 molar ratio of NaOH: Zn+2 ions. While, doping process in this study was very simple and performed by increasing the amount of NaOH in the solution with a percent of 3:1 NaOH: Zn+2 ions. NaOH act as both precipitating and doping agent. In this procedure, an aqueous solution of specified mmol NaOH were added drop wise to specified mmol of (CH3COO)2Zn.2H2O solution and stirred. The produced white precipitate of ZnO in the two forms was reserved at 70°C for 15 hr. Then the precipitate left to coal down and rinsed several times with solution of (70: 30% H2O: C2H5OH) then dried at 70°C for 10 hr. ZnO and Na-ZnO were characterized and used as a photocatalyst for the degradation of CR dye in aqueous solution. Several techniques were used for the characterization of ZnO samples. Including, X-ray diffraction (X' Pert PRO PANalytical– Netherland equipment) to investigate the crystal structure using λ= 0.1542 nm and 2θ values started from 10° to 80°. N2 adsorption (using Micromerities ASAP2010) to determine the value of specific surface area by the method of Brunauer–Emmett–Teller (BET) [18]. Scanning electron microscopy/Energy-dispersive X-ray spectroscopy (SEM-EDS) Model Quanta 250 FEG (Field Emission Gun), employed to analyze the size, morphology and the elemental analysis [19]. Scanning electron microscope, X-ray fluorescence (XRF), using the JSX-3222 analyzer, used to determine the main chemical composition and elemental analysis. Inductively coupled plasma (ICP-OES) prodigy high dispersion, Leeman, USA, was used to determine the metal concentration in the prepared sample. The band gap of the prepared samples was determined using Perkin Elmer Lambda 35, UV-vis spectrophotometer. The photocatalyst sample was ultrasonically dispersed in deionized water at room temperature [20]. The optical absorption was measured in the range of 200–1000 nm. The pH at point of zero charge (PZC) was determined by batch equilibrium technique (solid addition method) for the prepared samples [21]. pH values measured by a pH meter (HANNA).
2.3. Photocatalytic Degradation Experiments
- All solutions were irradiated with sunlight in 50 mL Pyrex centrifuge tubes on sunny days between 10:30 a.m. and 4:30 p.m. (May–September). The ambient temperature was between 37°C and 42°C. The pH of the solution was measured by HANA pH meter and adjusted by using dilute solution of HNO3 and/or NaOH. To achieve adsorption–desorption equilibrium between CR dye and Na-ZnO. Specific amount of Na-ZnO was added to known volume of CR at specific pH and magnetically stirred (120 rpm) in dark for 60 min. Then, photocatalytic experiments started by exposing the suspension to the sunlight. Then corresponding experiments were conducted on CR dye solutions in absence of the photocatalyst to assess the degradation of CR dye by direct photolysis. In experiments requiring scavengers these were added to the water prior to introduction of CR dye or Na-ZnO photocatalyst. In addition, a series of experiments (under similar conditions) were performed to study recyclability of Na-ZnO as a photocatalyst and to investigate its stability after 7.0 consecutive rounds. After photolyzing for a specified time, CR solutions were centrifuged to separate the photocatalyst and the supernatant analyzed by UV-Vis spectrophotometer (Perkin Elmer Lambda 35, UV–vis spectrophotometer) to follow the change in its concentration at λ max of wavelengths 495nm using a pre-prepared calibration curve. The degradation efficiency (or % removal) was then calculated as in equation (1):
 | (1) |
 and
and  are the concentration (mg/L) of CR before and after time (t) during the photoirradiation experiment respectively.
2.4. Chemical Oxygen Demand
- Chemical oxygen demand (COD) was determined by the method of back titration [22, 23]. A sample of CR dye is refluxed in strongly acid solution with a known excess of potassium dichromate (K2Cr2O7). After digestion, the remaining unreduced K2Cr2O7 is titrated with ferrous ammonium sulphate (FAS) to determine the amount of K2Cr2O7 consumed and the oxidizable CR dye is calculated in terms of oxygen equivalent. The amount of COD of each sample was calculated using the following equation (2).
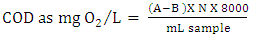 | (2) |
3. Results and Discussion
3.1. Characterization of the Prepared Samples
- The specific surface area, average pore radius and total pore volume of as-prepared Na-ZnO were determined from BET (Figure 2) as 28.35 m2/g, 4.34 nm, and 0.062 cc/g respectively. Surface morphology along with determining the main elements determined by SEM-EDS are shown in Figure 3. The image of Na-ZnO shows the presence of bunch of nanorods along with aggregate of particles without any specific morphology. In addition, the main elements in the prepared sample found to be Zinc and oxygen only with % mass as 84.5 and 15.5% respectively.
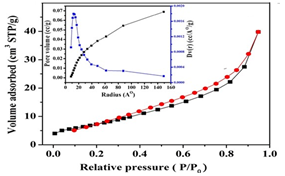 | Figure 2. N2 adsorption–desorption isotherm for Na-ZnO (Type 2) |
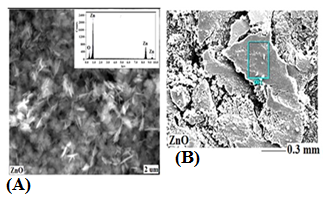 | Figure 3. SEM (a) and EDS (b) images of Na-ZnO (inset is the EDS spectra for elemental analysis in ZnO) |
 | (3) |
 is the crystallite size of (hkl) plane, K is a constant (K= 0.94),
  is the Bragg angle of (hkl) peak (which is half of the angle between the incident and scattered X-ray), λ is the X-ray wavelength used (0.1542 nm) and β is FWHM in radiance if Na-ZnO crystal assumed to be spherical (β = (FWHM x 3.14)/180)). The result of calculated crystallite size (D) of Na-ZnO was found to be in the range from 7.7 to 26.1 nm with an average of 21.9 nm. It should be noted that the diffraction peaks of Na-ZnO shifted toward lower angles as compared with those of the pure ZnO (JCPDS Card No. 36-1451) as shown in the inset of Figure 4. This could be attributed to the larger ionic radius of Na+ (0.102 nm) than that of Zn2+ (0.074 nm) [14]. Thus, Na substitution for Zn in ZnO will induce the expansion of the crystal lattice and lead to the lower angle shifts of the diffraction peaks.
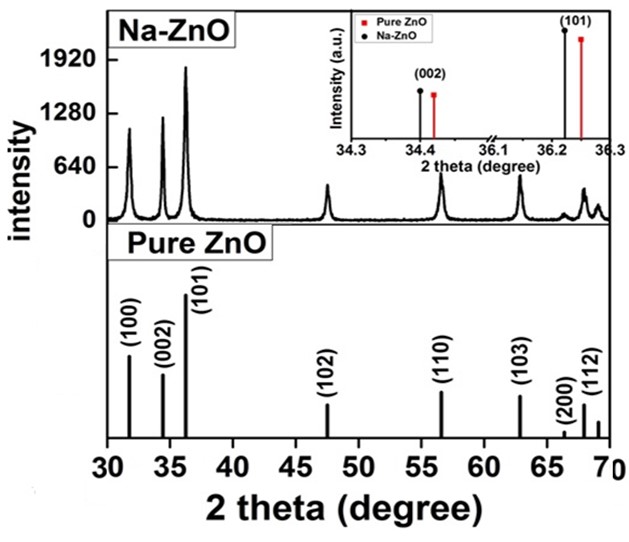 | Figure 4. XRD pattern of pure ZnO (standard JCPDS No. 36-1451) and Na-ZnO nanoparticles |
3.2. Optical Analyses and Band Gap Detrmination of Na-ZnO
- The UV–vis spectrum of the Na-ZnO nanoparticles is exhibited in Figure 5. The absorption spectrum of the Na-ZnO nanoparticles presents a sharp absorption peak around 368 nm which is the characteristic single peak of hexagonal ZnO nanoparticles [26]. The nature of the optical band gap can be determined using the fundamental absorption, which corresponds to electron excitation from valence band to conduction band. Direct absorption band gaps of the Na-ZnO nanoparticles can be obtained by directly plotting the absorbance versus wavelength [27, 28]. The values of optical transition obtained by extrapolating the straight line portion to wavelength axis at zero absorption coefficients give the direct optical band gaps. Figure 5 showed that the straight line passes through wavelength axis at λ = 418 nm. The band gap energy
 can be calculated from equation (4).
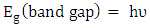 | (4) |
 is the band gap energy, h is the Planck constant (h = 6.62607x10⁻³⁴ J.s = 4.135667x10⁻¹⁵ eV. s) and
  is the Frequency. By expressing the Frequency
  as
as  equation (4) becomes equation (5).
 | (5) |
 is the speed of light (c = 3x10⁸ms-1), and λ is the wavelength. Then
  can be calculated from equation (6) by substituting the values of
  and
and 
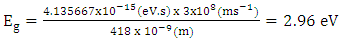 | (6) |
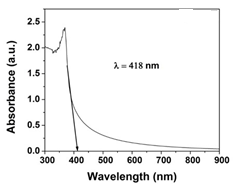 | Figure 5. UV–vis spectrum of the Na-ZnO nanoparticles |
3.3. Determination of Point of Zero Charge
- Point of zero charge (PZC) is a fundamental description of the oxide surface. Batch equilibrium technique (solid addition method) was employed to determine the pH at PZC of the prepared samples as in the following procedure. A several samples of 0.1 g of Na-ZnO introduced into 20 ml of 0.1 M KCl solution at different initial pHs (3, 5, 7, 8, 9, 10 and 12). Initial pHs (pHi) of all suspensions were adjusted by using 0.1 M KOH and/or 0.1 M HCl solutions. Then the suspensions of known pHi were stirred at room temperature and allowed to equilibrate for 24 hr. After that, the samples were filtered and the final pH values (pHf) were measured after the period of 24 hr. The difference between both the initial and final pHs (ΔpH = pHf- pHi) was calculated and the graph was plotted between ΔpH and pHi. In the plot, the point of intersection of the resulting curve at which ΔpH = zero is the pHPZC value of Na-ZnO. the result from figure 7 showed PZC of Na-ZnO equal to 7.6.
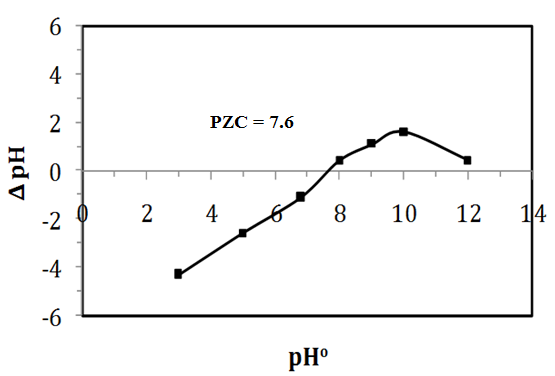 | Figure 6. Point of zero charge of Na-ZnO powder |
3.4. Photocatalytic Degradation of CR Dye
3.4.1. Removal of CR Dye by Hydrolysis, Dark Adsorption, and Photolysis
- Before starting the photocatalytic degradation (in presence of a photocatalyst), it is important to study the effect of different processes (which may affect the removal of CR dye) such as hydrolysis or blank (without catalyst and light), dark adsorption (catalyst without light) and direct photolysis (light without catalyst) at pH 9.0, 0.5g/L catalyst and 0.01L of 30 mg/L as [CR]0 dye at temperature of 37°C. Hydrolysis experiments performed by lifting the solution of CR dye in dark place for 60 min (Figure 7 at -60 and 0.0 min). Then photolysis experiments performed by exposure that solution of CR dye to sunlight irradiation. While, dark adsorption experiments performed by introducing specific amount of pure ZnO or Na-ZnO to CR dye solution and keeping for 60 min to reach equilibrium in dark. The results (Figure 7) indicated that the removal rate of both hydrolysis and direct photolysis of CR dye was negligible at selected pH. While dark adsorption led to removal of CR dye by only 2.5% and 3.8% by ZnO and Na-ZnO respectively at pH9. Therefore, experiments were performed to study the efficiency of Na-ZnO compared to pure ZnO for the photocatalytic degradation of CR dye under sun light.
3.4.2. Effect of Na-ZnO on the Photocatalytic Degradation of CR Dye
- Photocatalytic activity of Na-ZnO compared to pure ZnO was investigated under similar conditions of the experiment as mentioned above. The results (Figure 7) indicated that presence of pure ZnO as a photocatalyst, resulted in 33% removal of CR after 120 min under sunlight. However, presence of Na-ZnO led to a dramatic increase in the degradation of CR dye with 98.8% removal in the same photoperiod. This result can be attributed to the lower band gap of Na-ZnO (2.96 eV) compared to 3.13eV which is the band gap of pure ZnO. The band gap of Na doped ZnO allowed the absorption of the visible wavelength from sunlight. It can be noted that doping process of ZnO with Na produced a modified photocatalyst as Na-ZnO, which possess a great response to the visible light. Presence of Na in Na doped ZnO nanoparticles in addition to its small particles size (21.9 nm), would change the optical properties as discussed previously. This could be attributed to the larger ionic radius of Na+ (0.102 nm) than that of Zn2+ (0.074 nm) [14] which will induce the change in the optical properties of Na-ZnO and lower its energy gap. Furthermore, nanoparticles of Na-ZnO with large surface area (28.5 m2/g) would have more available surface sits for photodegradation process [30]. Therefore, further experiments performed to investigate the effect of Na-ZnO on the photodegradation of CR dye.
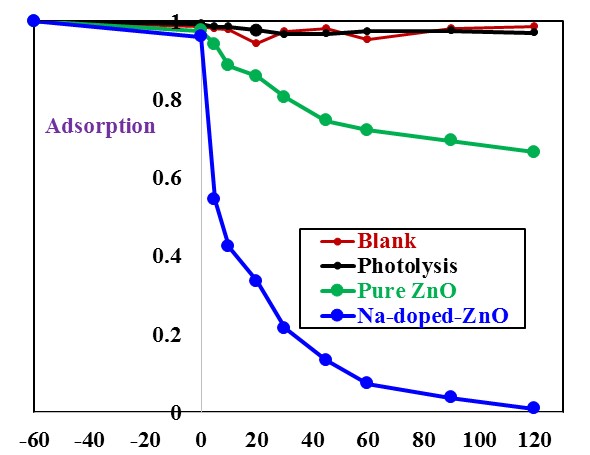 | Figure 7. Efficiency of Na-ZnO for degradation of CR dye under sunlight, Na-ZnO dose of catalyst = 0.5 g/L, [CR]0 = 30 mg/L and pH 9 at 37°C |
3.5. Effect of Different Parameters on the Photocatalytic Process of CR Dye
- There are different parameters usually affect the photocatalytic process. In this study, several parameters such as the effect of pH, light source, initial dye concentration and effect of dye time on the photodegradation process of CR dye were investigated.
3.5.1. The Effect of pH
- The value of the pH of the aqueous solution plays an important role for the disappearance of the pollutant from the aqueous solution either by adsorption and/or photocatalytic degradation process [31]. Before starting the photocatalytic degradation experiments of CR dye, samples kept in the dark for 30 min to reach equilibrium and to investigate removal of CR dye by dark adsorption onto the surface the photocatalyst. Solution of CR dye with initial concentration of 30 mg/L, 0.5g/L Na-ZnO at different pHs (5, 7, 8, and 9) kept in dark at 37°C. Then after 30 min, same samples exposed to sunlight to perform photocatalysis experiments at intervals time. Figure 7 showed that the removal of CR dye by dark adsorption onto the surface of Na-ZnO decreased by increasing the pH value from 5 to 9. Solution of CR dye at pH 9 showed 9.0% of CR adsorbed, while decreasing the pH value to 5 led to increase the rate of the adsorption with 60% of CR adsorbed. On the other hand, photocatalytic experiments started by exposure same solutions to sunlight. The results (Figure 7) showed that in the reaction period of 90 min, CR dye solutions were rapidly degraded with high efficiency at all pHs. At pH 5 the removal increases from 60% (by adsorption) to about 75% removal of CR occurs within 30 min then reached 97% by increasing the time to 90 min. While at pH 9 the percent removal of CR increased from 9% (removed by adsorption) to 64% degradation in the first 30 min, then reached also 98.7% after 90 min. However, it is better to point out few notes appeared during these experiments. The % removal of CR dye by dark adsorption process at pH5 was higher than the pH 9. This result can be attributed to the point of zero charge (PZC) of the surface of Na-ZnO which determined by solid addition method and found to be at pH 7.6. solution of CR dye after photocatalytic experiment at pH5 and 9). Hence the charge on the surface of Na-ZnO at pH 5 is positive, this will facilitate the adsorption of CR as an anionic dye, while negative of the surface at pH 9, would minimize the adsorption of CR dye. Secondly, although the high degree of adsorption of CR at pH5 would increase the photocatalytic degradation by adsorbed •OH radicals. The removal of CR dye at pH 5 was mainly due to adsorption process. We noted that after the photodegradation experiment the solution of CR was clear, however the surface of the photocatalyst appeared in red color. Then stirring the solution for several minutes produced a reddish color of CR dye in the solution as shown in the inset of Figure 6. Although the final color of the solution is very light compared to the original color of the starting concentration of 30 mg/L CR dye. It can be concluded that at pH 5 the removal of CR dye is due to a competition between adsorption and photocatalysis processes. Also, the decrease in the rate of photocatalysis at pH 5, may be due to the increase of the concentration of the adsorbed CR dye onto the surface of Na-ZnO. Adsorbed CR dye would cover the active sites and absorb amount of the sunlight which would minimize the excitation process. On the other hand, the high rate of removal of CR dye (98.8%) at pH 9 was mainly by photocatalytic degradation process. Hence stirring the CR dye solution after photocatalysis experiment did not produce any red color in the solution (solution is very clear) as shown in the inset of Figure (8). This can be attributed to the high concentration of OH- ions at pH 9 which helps in formation of more •OH radicals to degrade CR dye in the solution. Similar results were reported for different studies [32, 33]. Also, presence of only 9.0% of CR onto the surface of Na-ZnO did not affect the excitation process of the photocatalyst.
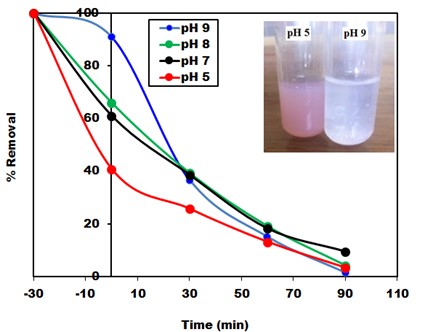 | Figure 8. The effect of pH on photodegradation of CR by Na-ZnO under solar light, dose of catalyst = 0.5 g/L, [CR]0 = 30 mg/L and pH 9 at 37°C. (The inset is the photo of stirred) |
3.5.2. Effect of Initial Concentration on Degradation of CR Dye
- Experiments were also performed to study the effect of the initial concentration of CR solution on the rate of degradation under sunlight using Na-ZnO. Four different initial CR concentrations were studied as 14, 2, 32 and 43 mg/L. The results in Figure (9) illustrated the change of concentration with time. The results showed that approximately complete decolorization of CR dye occurs at time of 60, 90, 110 and 120min when the initial concentration was 14, 2, 32 and 43 mg/L respectively. In the same time, the results also showed a decrease in the efficiency of photodegradation of CR dye with increasing its initial concentration. This result may be due the effect of increasing the number of adsorbed CR molecules onto the surface of Na-ZnO at a constant number of •OH radicals (at fixed dose of the photocatalyst) which will be led to a decrease in the degradation rate as discussed previously.
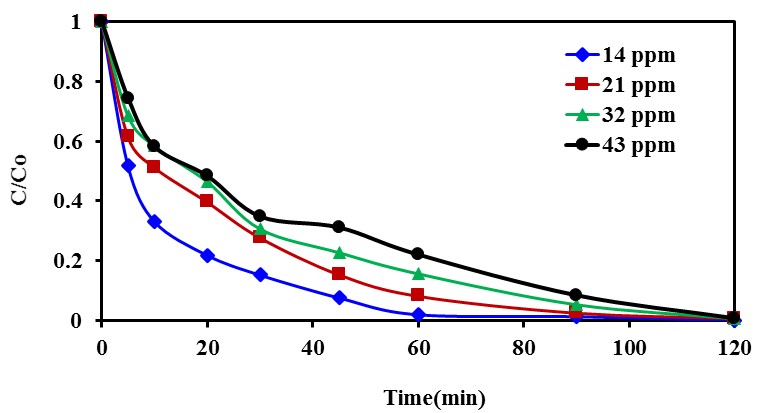 | Figure 9. The effect of initial concentration of CR dye onto photodegradation rate, dose of catalyst = 0.5 g/L, [CR]0 = 14-43 mg/L and pH 9 at 37°C |
 | (7) |
 | (8) |
 are the initial concentration and the concentration at time
  and
and  are the reaction rate constants of first-order and second-order reactions respectively. The first-order rate constant
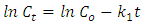
  for the four different concentrations, were determined from the slops of the relation between
  against t as shown in Figure (10a). In dditions, the second-order rate constant
  for the four different concentrations, were determined from the slops of the relation of
  against
  as shown in Figure (10b). The kinetics parameters along with the values of R2 for both first-order and second-order are presented in Table 1. It is noted that the first-order model for four different initial concentrations of CR (14, 2, 32 and 43 mg/L) gives straight lines with a very good value of correlation coefficient (R2). The values of R2 were 0.943, 0.993, 0.987 and 0.970 respectively. While applying the second-order model did not show a straight line and resulted in very low values of R2 as 0.858, 0.775, 0.809 and 0.824 respectively. These results indicated that the kinetic of photodegradation of CR using Na-ZnO under sunlight followed a first order kinetics.
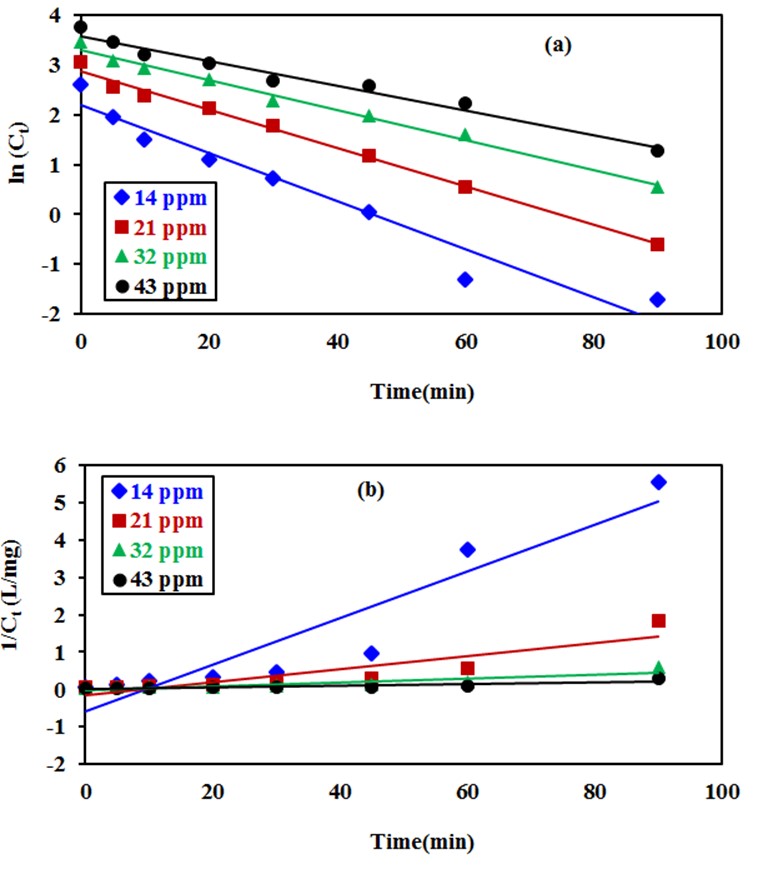 | Figure 10. Kinetic study of the photodegradation of CR using: (a) pseudo first-order (b) pseudo second-order model, dose of catalyst = 0.5 g/L, [CR]0 = 30 mg/L and pH 9 at 37°C |
|
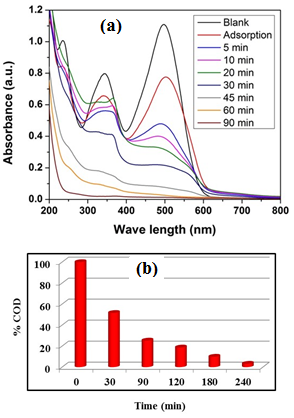 | Figure 11. Photocatalytic degradation and mineralization of CR dye using Na-ZnO under solar light (a) the decrease in UV-vis spectrum of CR dye and (b) the decrease in % COD of CR dye, dose of catalyst = 0.5 g/L, [CR]0 = 20 mg/L and pH 9 at 37°C |
3.6. Recyclability of Na-ZnO for Photodegradation of CR under Sunlight
- The performance of the photocatalyst, is measured by its stability for long time after consecutive usage cycles. Na-ZnO catalyst was used and recycled for consecutive reuse for the photocatalytic degradation of CR dye up to 7 times. All parameters including irradiation time, initial concentration of the dye and the pH of the medium were kept constant during the recyclability experiments. In these experiments, photocatalytic degradation of 20 mL of CR dye with initial concentration of 20 mg/L, performed for 3.0 hr. Then the photocatalyst (Na-ZnO) was collected and reused without washing or drying for the next recycle up to 7 cycles. The results in Figure (12a) show that the % removal of CR dye in all 7 recycles is more than 99%. Furthermore, COD experiments were performed also to ensure complete mineralization of CR dye during the 7 cycles. Figure 12b showed the mineralization of CR dye in each cycle. It was found that in the first recycle the % COD remaining was 9.9% in the reaction period. However, increasing the number of the recycles up to 7 recycles resulted in only small increase in the %COD remaining which reached about 34.1% in the photoperiod. This result confirmed that Na-ZnO acts as a stable photocatalyst with high efficiency for the mineralization of organic dyes from the environment using sunlight as low-cost source of energy.
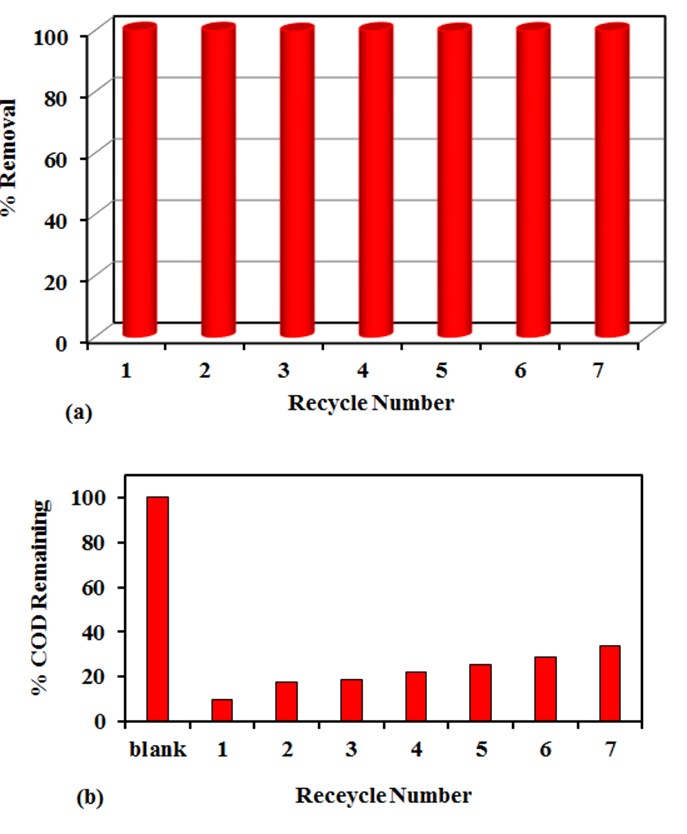 | Figure 12. Recyclability of the photocatalyst (Na-ZnO) for the photodegradation of CR, (a) % Removal of CR dye and (b) % COD Remaining of CR dye, dose of catalyst = 0.5 g/L, [CR]0 = 20 mg/L and pH 9 at 37°C |
3.7. Application of Na-ZnO as a Commercial Solar Photocatalyst
- Alternative sources for the non-renewable energy such as solar energy will acquire an increasingly significant role in the near future. It is known that photocatalysis is among the solar photoreaction and it has different applications. Therefore, synthesizing solar photocatalysts is an important key for using solar energy as a low-cost source of energy [31]. In this study, we have investigated the potential of using Na-ZnO as a solar photocatalyst for commercial applications in degradation and mineralization of a binary mixture of organic dyes such as congo red (CR) and methylene blue dye (MB). Experiments were performed to simulate the waste adsorbed dyes accumulated from adsorption tank. In this experiment, Na-ZnO acts as an adsorbent to collect the samples and then used as a photocatalyst for their degradation. A specific dose of Na-ZnO was added to a mixture of CR and MB dye and stirred for 120 min to reach equilibrium. After adsorption time, samples were centrifuged to separate the Na-ZnO with the two dyes accumulated on its surface. The amount of adsorbed dyes onto the surface of Na-ZnO (qe) was calculated as 20.8 and 44.0 mg/5mg of CR and MB dye respectively. Samples were dried at 60°C for 120 min, then suspended in 10 ml of fresh distilled water adjusted at pH 8 at which minimal desorption occurs. Then suspended solution exposed to sunlight. The results in Figure 13a is a photograph showing the degradation of the suspended photocatalyst (Na-ZnO) carrying the adsorbed dyes. The suspended solution stirred and exposed to direct solar light for specific time. The mixture was degraded with an efficient rate in the first 4.0 hrs as shown in the photograph (Figure 13a). However, complete decolorization of the samples occurred in 12.0 hrs. To ensure mineralization of dyes, samples kept in the sunlight for 16 hrs. The amount of COD was determined to confirm the mineralization of dyes. The results in Figure (13b) indicated that the amount of % COD decreased to 74.07% at the first 4.0 hrs. However, after a period of 16 hrs, the % COD decreased dramatically and reached very small amount as 11.2%. It is noted that the amount of COD decreased from 172.8 mg O2/L for the mixture of dyes at zero time to only 11.2 mg O2/L at 16 hrs as shown in Figure 13b. It can be concluded that Na-ZnO has an efficient potential to be used as a commercial solar photocatalyst.
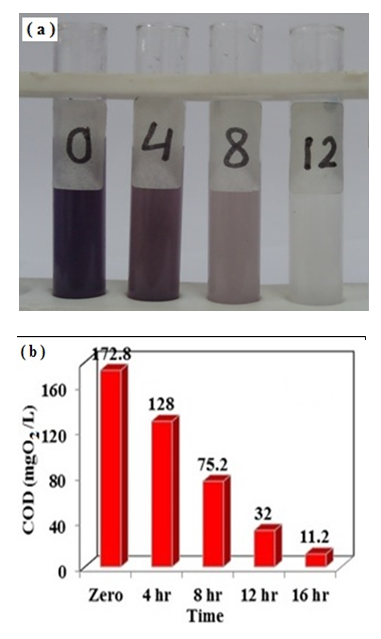 | Figure 13. (a) Photocatalytic degradation of adsorbed mixture of CR and MB dye using Na-ZnO under solar light, catalyst dose = 5 mg, volume = 10ml distilled water, [CR]0 = 20.8mg/5mg [MB]0 =44 mg/5mg at pH 8. (b) % remaining COD at different time of photodegradation process |
4. Conclusions
- Na-ZnO was simply synthesized by co-precipitation using NaOH based on the change of the molar ratio of NaOH to Zn2+ ions. At pH 9 about 98.8% of CR dye was de colorized in 90 min and mineralized in 4.0 hrs in presence of Na-ZnO using direct sunlight. As-prepared Na-ZnO was stable with the ability to mineralize CR dye up to 7 recycles under direct sunlight. The high response of Na-ZnO to direct sunlight compared to pure ZnO confirmed that Na-ZnO can be as a commercial solar photocatalyst.