-
Paper Information
- Paper Submission
-
Journal Information
- About This Journal
- Editorial Board
- Current Issue
- Archive
- Author Guidelines
- Contact Us
American Journal of Chemistry
p-ISSN: 2165-8749 e-ISSN: 2165-8781
2016; 6(5): 119-125
doi:10.5923/j.chemistry.20160605.02

Synthesis, Spectral Characterization and Antimicrobial Activity of Schiff Bases and Their Mixed Ligand Metal Complexes of Co(II), Ni(II), Cu(II) and Zn(II)
 Abstract
 Reference
 Full-Text PDF
 Full-text HTML
Padma Sikarwar, Sapna Tomar, A. P. Singh
Department of Chemistry, F.E.T., R.B.S. College, Bichpuri (Campus) Agra, India
Correspondence to: Padma Sikarwar, Department of Chemistry, F.E.T., R.B.S. College, Bichpuri (Campus) Agra, India.
| Email: |  |
Copyright © 2016 Scientific & Academic Publishing. All Rights Reserved.
This work is licensed under the Creative Commons Attribution International License (CC BY).
http://creativecommons.org/licenses/by/4.0/

In the present study a new series of Copper(II), Nickel(II) Cobalt(II) and Zinc(II) complexes with two newly synthesized Schiff base ligands N-[(E)-(5-Methylfuran-2-yl)methylidene]-ethane-1,2-diamine (MFMEDA) and N-p-hydroxybenzalidine-2-aminopyridine (HBAPy) have been prepared. The Schiff bases MFMEDA and HBAPy ligands were synthesized by the condensation of 5-methyl furfural with ethylene-1,2-diamine and p-hydroxybenzaldehyde with 2-aminopyridine respectively. The ligands and their metal complexes have been characterized by FT-IR, Mass, 1H NMR, UV–Vis., elemental analysis and Thermal gravimetric analysis. The Schiff base and their metal complexes were tested for antimicrobial activity against gram positive bacteria Staphylococcusaureus and gram negative bacteria Escherichiacoli,Salmonellatyphimurium and fungus Aspergillusnidulence,Candidaalbicansand Saccharomycescerevisiae using Broth Dilution Method.
Keywords: Synthesis, Characterization, Antimicrobial studies, Schiff base, Mixed ligand metal complex, Antimicrobial activity
Cite this paper: Padma Sikarwar, Sapna Tomar, A. P. Singh, Synthesis, Spectral Characterization and Antimicrobial Activity of Schiff Bases and Their Mixed Ligand Metal Complexes of Co(II), Ni(II), Cu(II) and Zn(II), American Journal of Chemistry, Vol. 6 No. 5, 2016, pp. 119-125. doi: 10.5923/j.chemistry.20160605.02.
Article Outline
1. Introduction
- Metal chelation is involved in many important biological processes where the coordination can occur between a variety of the metal ions and a wide range of ligands [1, 2]. Schiff base metal complexes have been widely studied because they have industrial, antifungal and biological applications [3-5]. They serve as models for biologically important species and find applications in biomimetic catalytic reactions. Chelating ligands containing O and N donor atoms show broad biological activity and are of special interest because of the variety of ways in which they are bonded to metal ions [6]. The synthesis of schiff base ligands and their metal complexes have been extensively studied because of their interesting biological activities [7-10]. Schiff bases have been reported to possess antimicrobial [11-15], antiviral [16], anticancer [17-20] and anti-inflammatory activity [21] The imine functional functional group (HC=N) is believed to be responsible for the biological activity of schiff base compounds. Vanillin is a phenolic aldehyde organic compound with the molecular formula C8H8O3. It is the primary component of the extract of the vanilla bean. Vanillin Schiff bases have been demonstrated to possess polyvalent metal ions [22]. Condensation product of vanillin with amines confers biological activity; as well as having good complexation ability with metal ions [23-25]. In this study, we present the synthesis, characterization and antimicrobial activity of a series of ONO schiff base ligands derived from condensation of o-aminophenol with vanillin and their metal(II) complexes.
2. Experimental
- Materials:All the chemicals and solvents used were of Analar (AR) grade and were used without further purification. They are 5-methyl furfural, ethylene-1,2-diamine, p-hydroxybenzaldehyde and 2-aminopyridine, CoCl2.6H2O, NiCl2.6H2O, Cu(CH3COO)2.H2O, Zn(CH3COO)2.2H2O, methanol, ethanol, petroleum ether, chloroform, benzene, ethylacetate and acetone. Physical measurements:The percentage (%) Co, Ni, Cu and Zn were determined by EDTA complexometric titration [26]. IR spectra (4000–400 cm−1) of the metal complexes were obtained using KBr discs, on 8400 FT-IR SHIMADZU spectrometer. Mass spectra were recorded on QP 2010 SHIMADZU GCMS spectrometer. 1H NMR spectra of ligands were recorded on Bruker Avance II 400 MHz FT-NMR spectrometer using TMS as an internal standard and DMSO-d6 as a solvent. ESI mass spectra of complexes were recorded VG-70-S Spectrometer. Electronic spectra of the metal complexes in DMF were recorded on a Perkin Elmer Lambda 19 spectrophotometer, and ESR was recorded on E-112 ESR spectrometer, at X-band microwave frequency (9.5 GHz) with sensitivity of 5 × 10¹⁰ ΔH spins. Molar conductance of the metal complexes was determined on Systronics direct reading conductivity meter type CM-82T. TGA was carried out by using Perkin Elmer (Pyris 1 TGA) from 50°C to 800°C under heating rate of 10°C/min. Elemental analysis (C, H and N) were carried out on Elemental Analyzer PERKIN ELMER 2400, and analysis of metal was carried out by EDTA titration method, in which the metal complex first evaporate in conc. nitric acid and prepare a stock solution. This solution with ammonia then titrates against EDTA by using appropriate indicator. The M.P. of ligands was carried out by a standard laboratory thermometer. Magnetic moment of the compound was measured by GOUY balance using Hg[Co(CNS)] as standard.Synthesis of the Schiff base ligands:(1) Synthesis of N-[(E)-(5-Methylfuran-2-yl)methylidene] -ethane-1,2-diamine (MFMEDA) Ligand5-methyl furfural in methanol (20 mL) were added to a refluxed solution of ethylene-1,2-diamine in same solvent in an equimolar ratio for 10 minutes followed by 2-3 drops of acetic acid. Then the reaction mixture was refluxed for 6 h by monitoring through TLC. When the reaction was completed, it was cooled to room temperature, filtered, and volume reduced to about one-third using rotary evaporator. The solid product thus obtained was filtered, washed with methanol, and dried. It was recrystallized in hot methanol/ether (2:1) [27].Yield = 1.15gm(73%), M.P. = 175°C, Color = Reddish brown(2) Synthesis of N-p-hydroxybenzalidine-2- aminopyridine (HBAPy) Ligand: 0.41gm, (0.003M) p-hydroxybenzaldehyde dissolved in 20 ml dry ethanol and 0.32 gm, (0.003M) 2-aminopyridine dissolved in 15 ml ethanol, were mixed together in 250 ml round bottom flask and refluxed for 12 hours over a water bath. The solution containing the product was allowed to cool at room temperature. The excess of ethanol was allowed to evaporate and kept in refrigerator for 12 hours. A viscous product was obtained which was washed several times with ether resulting in a solid product. It was filtered, washed and dried in vacuum desiccators over anhydrous CaCl2 [27].Yield = 2.7 gm, M.P. = 100°C, Color = brown.Synthesis of the ternary Complexes of Co(II), Ni(II), Cu(II) and Zn(II) metal ions, [MLL’] TypeSynthesis of 1:1:1, M(II)-HBAPy-MFMEDA: An ethanolic solution of 0.54 gm (3x10⁻³M) of HBAPy ligand was mixed with an ethanolic solution of 0.128 gm (3x10⁻³M) MFEDA ligand in a round bottom flask and stirred. This mixture an ethanolic solution of metal acetate (3x10⁻³M) (0.130 gm Co(CH3COO)2.4H2O; 0.25 gm Ni(CH3COO)2.4H2O; 0.10 gm Cu(CH3COO)2.H2O; 0.11 gm Zn(CH3COO)2.2H2O;) was added in a round bottom flask and stirred. This mixture was refluxed for three hours over a water bath after maintaining pH 6-7 of this mixture by adding the 1-2 ml of ethanolic solution of ammonia and allowed to cool. The product obtained was filtered and washed first with ethanol and finally with ether and dried in vaccum desiccator over anhydrous CaCl2 [28, 29].Yields = 0.154 gm Co(II)/ 0.142 gm Ni(II)/ 0.140 gm Cu(II)/ 0.141 gm Zn(II).Antimicrobial screening:All newly synthesized compounds were tested for their antibacterial activities against gram positive bacteria Staphylococcus aureus and gram negative bacteria Escherichia coli, Salmonella typhimurium and antifungal activity against Candida albicans, Aspergillus nidulence and Saccharomyces cerevisiae. The method used to evaluate the antimicrobial activity was ‘Broth Dilution Method’. It is one of the non-automated in vitro susceptibility tests. Serial dilutions were prepared in primary and secondary screening [30, 31]. The control tube containing no antibiobitic is immediately sub-cultured by spreading a loopful evenly over a quarter of plate of medium suitable for the growth of the test organism and put for incubation at 37°C overnight. The MIC (minimal inhibitory concentration) of the control organism is read to check the accuracy of the drug concentrations. The lowest concentration inhibiting growth of the organism is recorded as the MIC. The MIC values of the newly synthesized compounds have been compared with the standard drugs ampicillin, chloramphenicol, nystatin and greseofulvin.
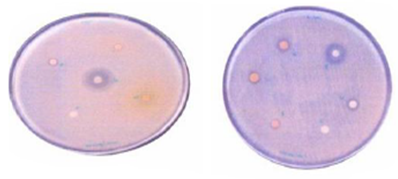 | Figure 1. Showing zone of inhabitation against S. aureus, and E. coli |
3. Results and Discussion
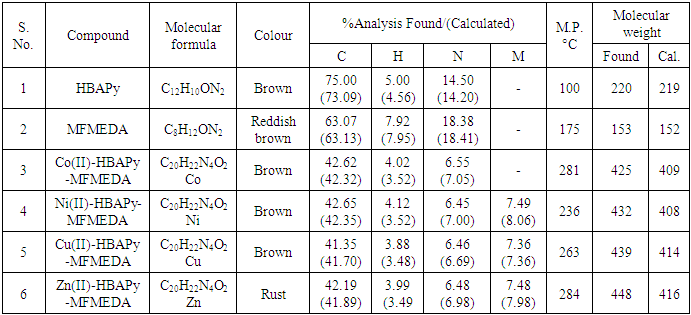
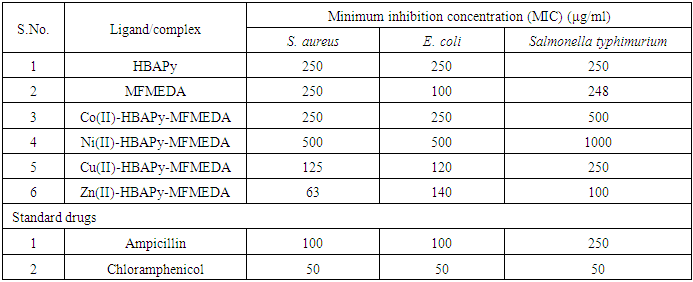
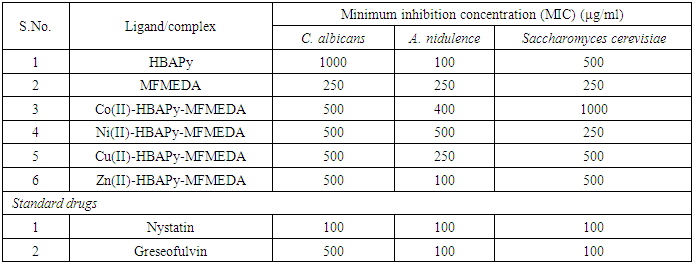
- The synthesized Schiff bases and their metal complexes were characterized by various analytical techniques such as IR, 1H NMR Mass, ESR, UV–Vis. spectroscopy, conductance, magnetic properties and TG analysis. Table 1 lists the physical and analytical data of the Schiff bases and their metal complexes. The IR frequencies of Schiff base ligands and metal complexes are given in Table 2. Electronic spectral data, magnetic moments and molar conductivities of the ligands and their metal complexes are given in Table 3. The antimicrobial activities of Schiff base ligands and metal complexes are listed in Table 4a and Table 4b.
|
|
|
|
|
3.1. Characterization of Schiff Base Ligands
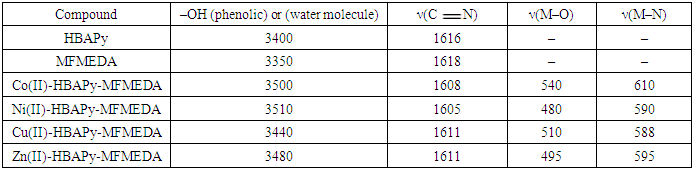
- IR spectra:The characteristic bands of the IR spectra of the complexes are shown in Table 2. The IR spectra are consistent with the formation of HBAPy and MFMEDA ligands. The fundamental stretching mode of the azomethine moiety, ν(–C
 N–), is readily assigned by comparison with the infrared spectra of substituted aldehydes and substituted amines. The intense band at 1618-1616 cm−1 for the ligands are assigned to the –C
 N– stretching frequency and is characterized for the azomethine moiety of most Schiff base compounds. In the infrared spectrum of the HBAPy and MFMEDA ligands, the absorption band of the C
 O group in the substituted aromatic aldehydes disappeared, which indicates that the condensation has occurred. The IR spectrum of the ligand shows a broad band at 3400–3350 cm−1 due to the stretching vibration of phenolic hydroxyl group, the broadness is due to intermolecular hydrogen bonding between the phenolic groups and the azomethine groups [32].1H NMR spectra:The 1H NMR spectra of ligands were recorded in DMSO-d6. The proton NMR spectrum of one of the ligands is shown in fig. 2. The signal due to methyl protons appeared as singlet in the range δ 2.36–2.51 ppm, whereas signals due to methoxy protons (HBAPy ligand) appeared as singlet at δ 3.35 ppm. In the aromatic region, a few doublets and in few cases some overlapping doublets/multiplets are observed in the range δ 6.40–8.35 ppm. Another singlet corresponding to phenolic proton is observed at δ 12.91 ppm [33].
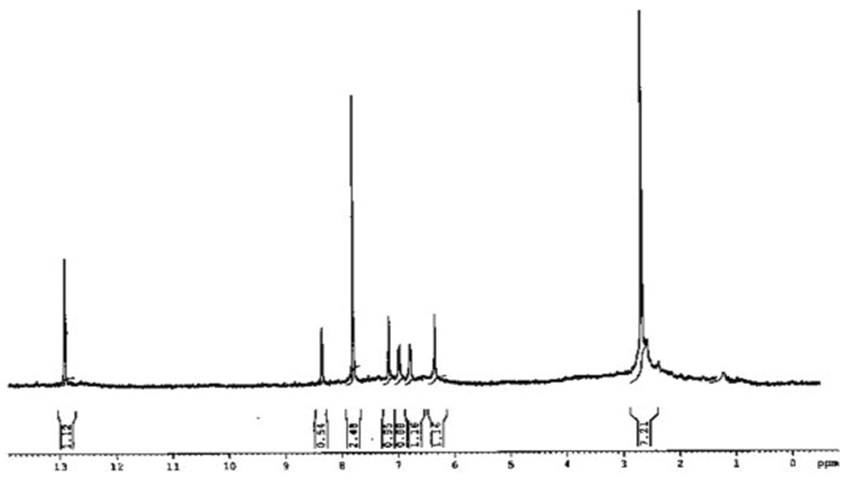 | Figure 2. 1H NMR spectra of ligand HBAPy |
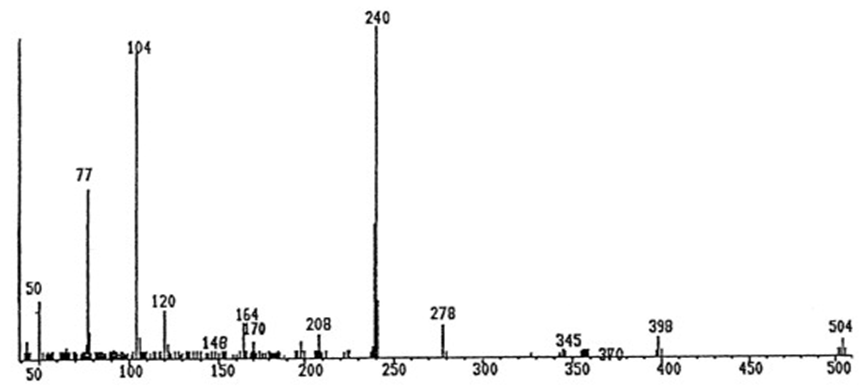 | Figure 3a. Mass spectra of ligand HBAPY |
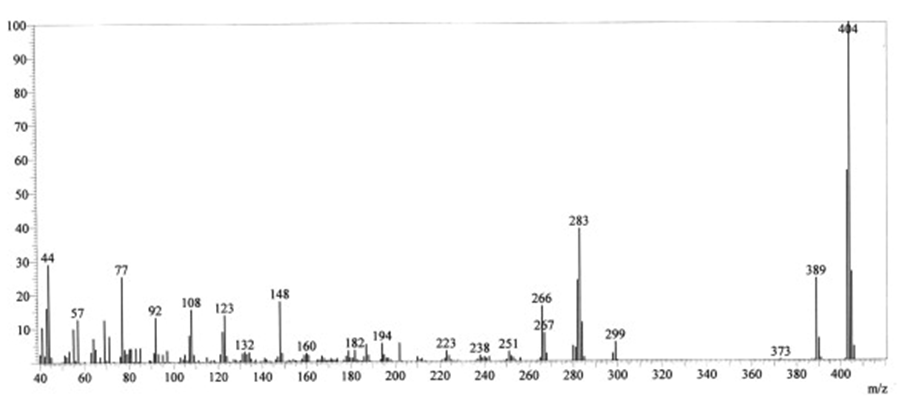 | Figure 3b. Mass spectra of ligand MFMEDA |
3.2. Characterization of Metal Complexes
- IR spectra:The vibrational frequencies and their tentative assignments for transition metal complexes are given in Table 2. The assignments were aided by comparison with the vibrational frequencies of the free ligand and their related compounds. There are three conceptual features in the infrared spectra of the complexes. The former one is the shift of the stretching frequencies of the azomethine (–C
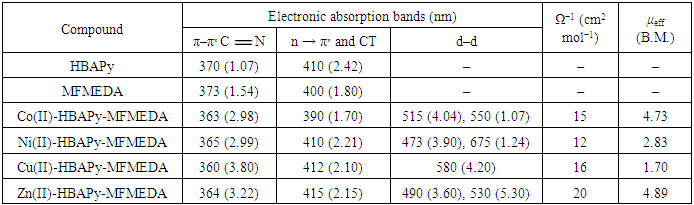
 N–) group of the transition metal complexes to lower frequencies and lie in the range of 1605–1611 cm−1, compared with the free ligand bands at 1616 and 1618 cm−1, which may be due to the coordination of the two azomethine groups to metal ions. This lowering shift is not significant in most cases as expected and it is believed that, this is due to the interference with the deformation of the water molecules associated with the complexes. The second feature is the bands in the range of 3510-3440 cm−1 which can be assigned to the stretching frequencies of the ν(OH) of water molecules associated to the complexes which are also confirmed by the TG analysis. The third feature is the weak to medium bands in the two ranges 480–540 and 588–610 cm−1, which could be assigned to the stretching frequencies of the ν(M–O) and (M–N) bands, respectively, supporting that the bonding of the ligands to the metal ions is achieved by the phenolic oxygen, and azomethine nitrogen atoms of the ligands [35, 36]. Electronic spectra, magnetic moments and molar conductivity:The electronic spectra of the complexes showed several absorption bands, including absorption bands of the ligands and d–d transitions of the metal ions Table 3. The electronic spectrum of the ligands HBAPY and MFMEDA (10−3M in DMF), shows mainly three bands at 210, 242 and 370 nm due to (1La → 1A1) and (1Lb → 1A1) transitions of the phenyl ring and π–π∗ transition within the C
 N group. In addition, a broad band at 410 nm is due to the n–π∗ transition which is overlapping with the intermolecular CT from the phenyl ring to the azomethine group. The electronic spectra of Co (II) complexes have multiple bands observed at 428 nm, 390–410 nm and 480–500 nm. These bands are ascribed to 4T1g(F) → 4T2g; 4T1g(F) → 4A2g and 4T1g(F) → 4T1g(P) transitions respectively, which is consistent with the octahedral geometry. The Ni(II) complexes have three spin allowed transitions at 250 nm, 462 nm, 520–581 nm and 735 nm. These bands are correlated to 3A2g → 3T2g; 3A2g → 3T1g(F) and 3A2g → 3T1g(P) transitions, respectively in an octahedral stereochemistry. The electronic spectra of Cu(II) complexes shows a band in the range 580–595 nm for2B1g → 2A1g in a square planar geometry [37, 38]. The magnetic moment value of the Cu(II) complexes 5 and 8 (1.70 B.M.) is very close to the spin value (1.73 B.M.) expected for one unpaired electron which offers the possibility of an octahedral geometry. The magnetic moment of Cu(II) complexes 11 and 14 show less value (1.48 B.M.). The larger variation in the magnetic moment values (2.9–3.4 B.M.) for a high-spin Ni(II) complex (2.83 B.M.) depends on the magnitude of the orbital contribution. The magnetic moment value (2.88 B.M.) in the present work is within the range expected for similar octahedral Ni(II) ions. The magnetic moment values for the Co(II) complexes have been used as criterion to determine the type of coordination around the metal ion. Due to the intrinsic orbital angular momentum in the ground state, there is consistently a considerable orbital contribution and the effective magnetic moment lies between 4.7 and 5.2 B.M. at room temperature. In the present complexes the magnetic moment value (4.74 B.M.) suggests an octahedral geometry for the Co(II) complex in the high-spin state. The magnetic moments of the complexes of Co11, Ni11 and Cu11 presented in table-1 indicate that all these complexes are high spin complexes supporting the octahedral geometry proposed to these complexes [39]. Antimicrobial activities: The Minimal inhibitory concentration (MIC) against bacteria and fungi of Schiff base ligands and their metal complexes were compared with the MIC values of standard drugs (Table 4a and 4b). The MIC values of the ligands HBAPy (250 μg/ml) and MFMEDA (250 μg/ml) against Salmonella typhimurium are comparable to standard drug ampicillin. The ligand MFMEDA (100 μg/ml) show identical MIC value against E.Coli with reference to ampicillin. The MIC values of ligand MFMEDA (250 μg/ml) is half in comparison with standard drug greseofulvin against the fungi C. albicans, while the MIC value of ligand HBAPy (100 μg/ml) is comparable to standard nystatin against A.nidulence. The MIC values of Co(II)-HBAPy-MFMEDA metal complexes (250 μg/ml), Ni(II)-HBAPy-MFMEDA (500 μg/ml) and Cu(II)-HBAPy-MFMEDA (125 μg/ml) are equivalent to the MIC value of ampicillin against S.aureus, while the MIC value of complex Zn(II)-HBAPy-MFMEDA metal complexes (63 μg/ml) is slightly more than the standard drug chloramphenicol against S.aureus. The MIC values of the complex Co(II)-HBAPy-MFMEDA (250 μg/ml), Ni(II)-HBAPy-MFMEDA (500 μg/ml) and Cu(II)-HBAPy-MFMEDA (120 μg/ml) are nearly equivalent to the MIC value of ampicillin against E.coli. The MIC values of the complexes Co(II)-HBAPy-MFMEDA (500 μg/ml), Ni(II)-HBAPy-MFMEDA (1000 μg/ml) and Cu(II)-HBAPy-MFMEDA (250 μg/ml) against Salmonella typhimurium are similar to that of standard drug ampicillin, while the complexes Zn(II)-HBAPy-MFMEDA (100 μg/ml) show relatively low MIC value. The MIC values of metal complexes Co(II)-HBAPy-MFMEDA (500 μg/ml), Ni(II)-HBAPy-MFMEDA (500 μg/ml), Cu(II)-HBAPy-MFMEDA (500 μg/ml) and Zn(II)-HBAPy-MFMEDA (500 μg/ml) against C. albicans are similar to that of standard drug greseofulvin. The MIC values of complexes Zn(II)-HBAPy-MFMEDA (100 μg/ml) against A.nidulence are comparable to the standard drugs nystatin and greseofulvin. The MIC values of the complexes Zn(II)-HBAPy-MFMEDA (100 μg/ml) against Saccharomyces cerevisiae are comparable to standard drugs nystatin and greseofulvin.