American Journal of Chemistry

p-ISSN: 2165-8749    e-ISSN: 2165-8781

2016;  6(3): 65-73

doi:10.5923/j.chemistry.20160603.01


Precursors Influencing Tropospheric Ozone Formation and Apportionment in Three Districts of Ilupeju Industrial Estate, Lagos

Azeez L.1, Oyedeji O. A.2, Adewuyi S. O.3, Tijani K. O.4, Adebisi S. A.1, Olaogun M. A.5

1Analytical, Environmental and Nutritional Research Laboratory, Department of Chemical Sciences, Osun State University, Osogbo, Nigeria

2Department of Science Laboratory Technology, The Federal Polytechnic Ilaro, Nigeria

3Department of Pure and Applied Chemistry, Ladoke Akintola University of Technology, Ogbomoso, Nigeria

4Department of Chemical Sciences, Fountain University, Osogbo, Nigeria

5Environmental Chemistry Unit, Environmental Accord Nigeria, Limited, Gbagada, Nigeria

Correspondence to: Azeez L., Analytical, Environmental and Nutritional Research Laboratory, Department of Chemical Sciences, Osun State University, Osogbo, Nigeria.

Email:

Copyright © 2016 Scientific & Academic Publishing. All Rights Reserved.

This work is licensed under the Creative Commons Attribution International License (CC BY).
http://creativecommons.org/licenses/by/4.0/

Abstract

This study determined concentrations of toxic pollutants, volatile organic compounds and meteorological parameters in three sampling locations (SL1, SL2 and SL3) at Ilupeju industrial Estate. Average concentrations of toxic pollutants; CO (14.70 ppm), NO2 (0.88 ppm), and SO2 (0.55 ppm) and O3 (17.67 ppb) were determined. These had high correlation with temperature, wind speed, pressure and relative humidity. In terms of air quality, unhealthy air quality was obtained for CO, NO2 and SO2 while O3 gave a good air quality. Seventeen VOCs species belonging to alkane, alkene, aromatic and chlorinated hydrocarbons were determined. m/p - xylene was the most abundant species accounting for 16.28%, 11.66% and 14.06% at SL1, SL2 and SL3 respectively. Different ratios such as toluene/m,p – xylene, Σ Xylene/CO, trichloroethene/CO and tetrachloroethene/CO indicated solvent related emissions from these locations while Benzene/Toluene ratio indicated a traffic related emission. m/p - xylene and propene were the major contributors to O3 formation at SL1, SL2 and SL3 respectively. Ozone determined was VOC sensitive at all locations. Factor analysis using principal component analysis suggested traffic, industrial related emission sources solvent evaporation as sources for toxic pollutants and VOCs.

Keywords: Toxic pollutants, Ozone formation, Principal component analysis, Diurnal pattern, VOCs

Cite this paper: Azeez L., Oyedeji O. A., Adewuyi S. O., Tijani K. O., Adebisi S. A., Olaogun M. A., Precursors Influencing Tropospheric Ozone Formation and Apportionment in Three Districts of Ilupeju Industrial Estate, Lagos, American Journal of Chemistry, Vol. 6 No. 3, 2016, pp. 65-73. doi: 10.5923/j.chemistry.20160603.01.

1. Introduction

Air pollution is a well-documented problem in urban centres especially where residential houses are in the neighborhood of industries. Anthropogenic emissions such as vehicular activities, industrial emissions and solvent evaporation are the largest sources of air pollution in most urban cities [1-3]. Air emissions from these sources are usually critical and have been associated with numerous diseases such as cardiovascular diseases, fatigue, headache, immune impairment and cancer [4, 5]. Most of these primary pollutants are acid anhydrides reacting with moisture to form acidic compounds that are dangerous to human health, plants and materials [6, 7]. Aside high toxicity these pollutants induce, they also combine to form secondary pollutants which are sometimes more toxic than them [8, 9].
Tropospheric Ozone (O3) also known as bad ozone is a secondary air pollutant formed in the atmosphere through a complex photochemical reaction sequence requiring reactive hydrocarbons, sunlight and nitrogen oxide (NOx) [10, 11]. It is one of the criteria air pollutants, a major constituent of photochemical smog and a powerful oxidant which plays important role in the oxidative capacity of atmosphere [12]. It is a highly corrosive and toxic air pollutant whose pollution is still a serious problem that needs our collective attention [13].
O3 is an irritant to lung tissues and has been reported to cause respiratory inflammation, impair photosynthesis and damage human health by oxidizing biological tissues [14, 15]. O3 concentration is usually high at noon basically due to photo-oxidation of the precursor gases such as CO, CH4 and non-methane hydrocarbons in the presence of sufficient amount of nitrogen oxide (NOx) [16]. O3 production during the day could also be driven by the photochemical reaction between hydroxyl radicals, organic peroxy radicals and NO while it is removed at night by deposition and destruction by alkenes and NO [17].
Non-methane hydrocarbons (NMHCs) are major volatile organic compounds (VOCs) in the ambient atmosphere. They are ozone-producing precursors and also play key role in the formation of secondary organic aerosol. They are usually emitted from vehicular activities and solvent evaporation [15, 18, 19, 20]. They have been reported to induce a wide range of acute and chronic health effects, such as sensory irritation, nervous system impairment, asthma and cancer. Many VOCs are known to be toxic, carcinogenic and mutagenic [21]. Benzene, formaldehyde and carbon tetrachloride have been shown to damage liver, kidney, lung and intestine and DNA [22].
Understanding and identifying ozone precursors’ emission sources are important for policy-makers and for the improvement of air quality. Moreover, these precursors have been well documented and discussed as part of criteria air pollutants in most countries especially Nigeria but same attention has not been given to tropospheric ozone formation and its distribution. Therefore, this study was focused on providing baseline concentration data on toxic air pollutants, and their contribution to ozone formation and apportionment in one of the largest industrial estates with a lot of commercial activities.

2. Sampling Location

Ilupeju Industrial Estate is one of the industrial estates established in Lagos in Oshodi-Isolo, Local Government Area. The Estate has a number of industries such as PZ Cussons Nigeria Plc; Poly Products Nigeria Plc (manufacturer of polyethylene products); Bhojsons Industries Plc; Nestles Nigeria Plc, Patplast and Allied Rubber Products Nigeria Limited, Nigeria Foundries limited, Atlantic Textile Manufacturing Company Limited; Enpee Industries; Absco Industries; Pharmchem Industries; Kiwi Industries. Vehicular activities are usually high on the roads within the industrial estate because many houses and other towns are connected together by these roads.
Measurements of pollutants were conducted in three (3) different sampling locations (SL) selected randomly within the Estate for three consecutive months (February – April, 2014). Measurements were carried out between 0700hr and 1800hr daily. Geographical locations of sampling locations 1, 2 and 3 are 06°33’16.8’’N and 003°21’15.4’’E, 06°33’03.1”N and 003°21’33.4’’E, and 06°33’22.9”N and 003°21’27.0’’E respectively. Sampling locations and industries cited within are shown in figure 1.
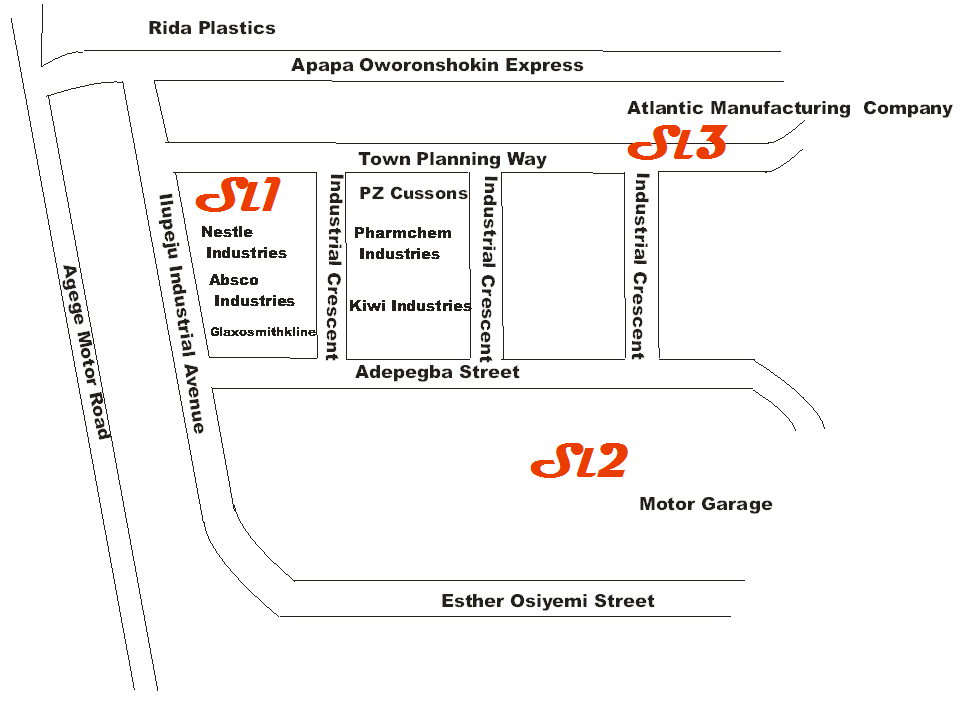
Figure 1. Map of Ilupeju Industrial estate showing sampling locations

2.1. Sampling Methodology

2.1.1. Measurement of Toxic Pollutants and Meteorological Parameters
The concentrations of air pollutants of concerns were determined in-situ with the use of digital hand-held MultiRAE IR monitoring instruments. The MultiRAE IR is a programmable multi-gas monitor designed to provide continuous exposure monitoring of toxic gases (CO, NO, NO2, SO2) in potentially hazardous environments. It uses the following sensors; Organic vapours with the supplied Photo-Ionization Detector (PID) using 9.8eV, 10.6eV gas discharge lamp and toxic gases with several interchangeable electrochemical sensors. All instruments underwent background checks and were purged with high purity zero air to correct instrument drifts.
Meteorological parameters were measured using Kestrel 4500 NV Weather Meter (USA).
2.1.2. Determination of Ozone
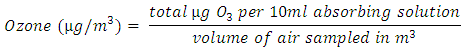
Method of Olajire et al. [23] was used to determine ozone concentration. Air samples were drawn with P4LC air sampler into the impinger containing 10 ml oxidant absorbing solution (1% KI in 0.1 M phosphate buffer at pH 6.8) at a flow rate of 2 l min_1 for 1 hr. The absorbance of exposed absorbing solution was read at 352 nm using unexposed solution as reference. Concentrations of ozone in each solution was extrapolated from the calibration curve prepared from standard iodine solution against ozone concentration. Oxidant concentration in the air was calculated using this equation
2.1.3. Determination of Volatile Organic Compounds (VOCs)
Concentrations of volatile organic compounds (VOCs) were determined using method described by Olajire and Azeez [34] with slight modification. Tubes for sampling were conditioned at 90°C and checked for target VOCs before sampling. Air was drawn into tube containing 100 mg activated charcoal with P4LC sampler at rate of 0.5 l/min for 30 min. After each sampling, the tubes were tightly sealed and wrapped in aluminum foil. Duplicate samples were collected at each sampling point. The content in each tube was transferred into 10 ml vial borosilicate glass. The vial and its content were stoppered by silicone material and were transferred to the cell of headspace sampler coupled with gas chromatography equipped with flame ionization detector (GC-FID) for analysis of VOCs. An HP-VOC capillary column (25 m x 0.32 μm i.d x 0.12 μm film thickness) was used and carrier gas was ultra-pure hydrogen. The GC oven temperature was set initially to 35°C for 2 min., increasing at a rate of 5°C /min to 80°C and then holding for 10 min. Detector and injector temperatures were maintained at 300°C. The target VOC species were identified by their individual retention time.
Laboratory and field blanks were prepared and analyzed as sample.

2.2. Statistical Analysis

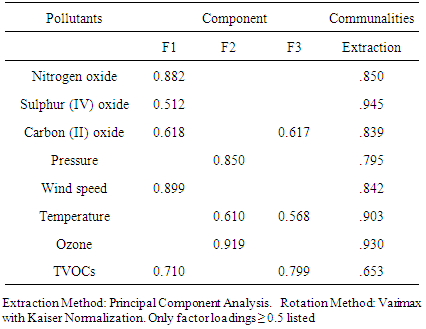
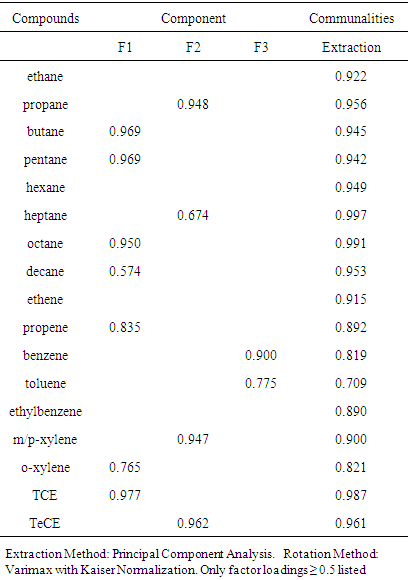
Data obtained are expressed as mean ± standard deviation and were subjected to multivariate statistics using correlation and factor analyses. Correlation analysis was done using Pearson correlation to establish the relationship among different toxic pollutants. R was obtained at 99% confidence levels. Factor analysis was done using principal component analysis (PCA) technique. It was employed to reveal the likely sources and the contributions of different pollutants. Time series was used to provide diurnal pattern of pollutants. SPSS 17 was used for all analyses.

3. Results and Discussion

3.1. Toxic Pollutants and Meteorological Parameters

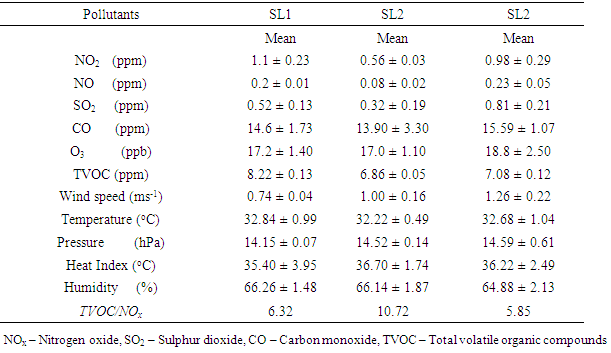
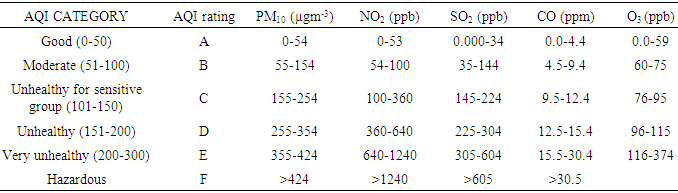
Concentrations of toxic pollutants and meteorological data are presented in table 1.
Table 1. Average concentrations of toxic pollutants and meteorological parameters
     
NO2 concentration was highest at SL1 and lowest at SL2. In terms of air quality index (table 2), NO2 concentrations were very unhealthy in all locations [25]. Diurnal variation of NO2 (Fig. 2a) shows two distinct peaks; one in the morning between 07.00-09.00 while the second was in the evening between 16.00-17.30. This could be as a result of high vehicular activities which are predominant sources of NO2 at these locations in the morning and evening that coincide with the rush hours [20, 26].
Table 2. Air quality index for criteria pollutants (USEPA 2000)
     
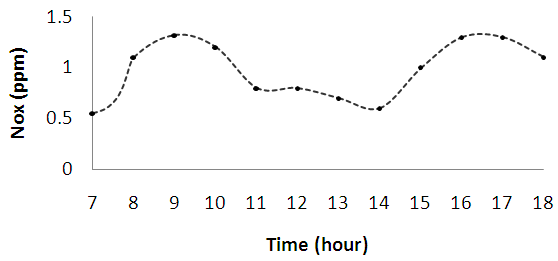
Figure 2a. Diurnal variations of nitrogen (IV) oxide (NO2)
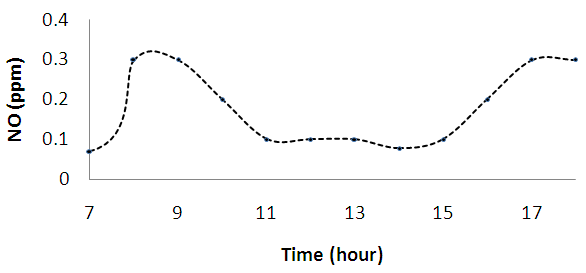
Figure 2b. Diurnal variations of nitrogen (II) oxide (NO)
NO concentration was highest at SL3 and lowest at SL2. Diurnal pattern (fig 2b) shows two peaks; early in the morning and in the evening. This was in agreement with results obtained by [11, 20].
Concentrations of CO ranged from 10.60 ppm at SL2 to 16.66 ppm at SL3. Average concentration of CO exceeded 8-hr maximum of 9 ppm and fell short of 1-hr maximum of 35 ppm of US national ambient quality standard at all locations [25]. This poses a great danger in terms of air quality index (table 2) because the air was unhealthy. CO is a product of incomplete combustion of fossil fuels; therefore, high average concentrations measured suggest vehicular and industrial burning of fossil fuels [26].
Concentrations of SO2 ranged from 0.32 ppm to 0.82 ppm. Average concentrations at all locations were higher than 0.14 ppm (24-hr average) of US national ambient quality standard [25]. Air quality index (table 2) in terms of SO2 shows that at SL1 and SL2, the air was very unhealthy while at SL3, the air was hazardous. Since SO2 is emitted from combustion processes, its high concentrations are indicative of vehicular activities and industrial emissions [23].
Average O3 concentrations ranged from 15.8 ppb at SL2 to 21.3 ppb at SL3. Average concentrations of O3 at all locations were lower than 8-hr maximum of 80 ppb of US national ambient quality standard [25]. In terms of air quality index (table 2), the air was good at all locations. Its diurnal pattern (fig. 2c) shows two peaks; a broad peak spanning for two hours between 11.00-13.00 while a sharp peak occurred at 15.00. High peaks of O3 observed in the noon could be due to the formation of ozone from photo-oxidation of the precursor gases such as CO, CH4 and non-methane hydrocarbons in the presence of sufficient amount of nitrogen oxide (NOx) [16].
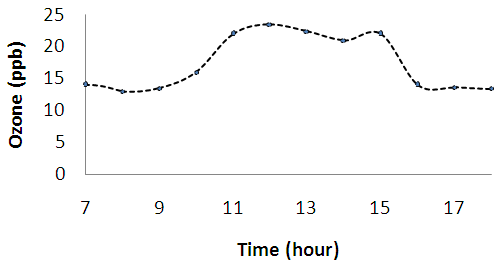
Figure 2c. Diurnal variations of ozone (O3)
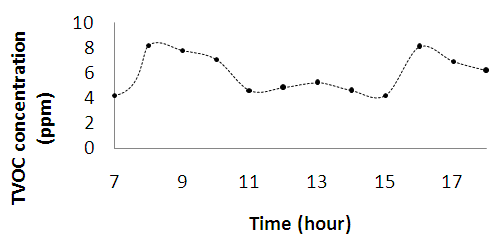
Figure 2d. Diurnal variations of total volatile organic compounds (TVOC)
Total volatile organic compounds (TVOC) concentrations were found in the range of 6.33 ppm to 8.35 ppm. Highest concentration was measured at SL1. Diurnal pattern (fig. 2d) of TVOC shows a distinct peaks in the morning between 08.00 – 08.30 and in the evening between 16.00 – 16.30. Like NOx, high concentrations of TVOC coincided with the rush hours in the morning and evening.
Temperature ranged from 31.64°C to 33.83°C. Wind speed was found in the range 0.70 ms-1 to 1.48 ms-1. Pressure, heat index and relative humidity ranged from 14.08 – 15.20 hPa, 31.45 – 39.35°C and 62.75 – 67.74% respectively. Meteorological parameters such as those measured in this study have been found to play important roles in the formation, dilution, transport and dispersal of pollutants. They have also been found to influence tropospheric ozone concentrations and its precursors [11, 27, 28]. Increase in temperature and pressure as obtained in this study led to increase in ozone concentration while decrease in humidity and wind speed led to increase in ozone concentration. This is in agreement with results obtained by [29, 30].
Factor analysis using principal component analysis (PCA) was used to predict the possible sources and contributions of each pollutant measured. The result is presented in table 3. Three factors were extracted by PCA and they accounted for 82.89% of total variance (eigenvalue ≥ 1). Factor 1 (F1) with variance of 41.23% highly correlated with wind speed, NOx, TVOCs and averagely correlated SO2, and CO. This is identified as a factor indicating anthropogenic sources such as vehicular activities and industrial emission [23]. It also shows that emission and dispersal of these pollutants are controlled by meteorological parameters such as wind speed [28]. Factor 2 (F2) with variance of 21.91% highly correlated with O3 and pressure but averagely correlated with temperature. This suggests photochemical production of O3 influenced by temperature and pressure. Factor 3 (F3) with variance of 19.75% correlated with temperature, CO and total volatile organic compounds. This shows that the emission and reaction of CO and volatile organic compounds are temperature dependent.
Table 3. Factor analysis of toxic pollutants and meteorological parameters
     
Correlation analysis using Pearson correlation established negative correlations between O3 and NO2 (r = -0.766), O3 and CO (r = -0.814) and moderate correlation between O3 and pressure (r = 0.543). This shows that as CO and NO2 were consumed, ozone was produced, and pressure played important role in the formation of O3. It has been discovered that photo-oxidation of CO, NOx and non-methane hydrocarbons in the presence of meteorological parameters favours the formation of O3 [11, 16]. High correlations were also obtained for CO and temperature (r = 0.799), TVOC and temperature (r = 0.918), pressure and wind speed (r = 0.737). This could point to meteorologically-controlled emissions from anthropogenic sources.

3.2. Volatile Organic Compounds Concentrations

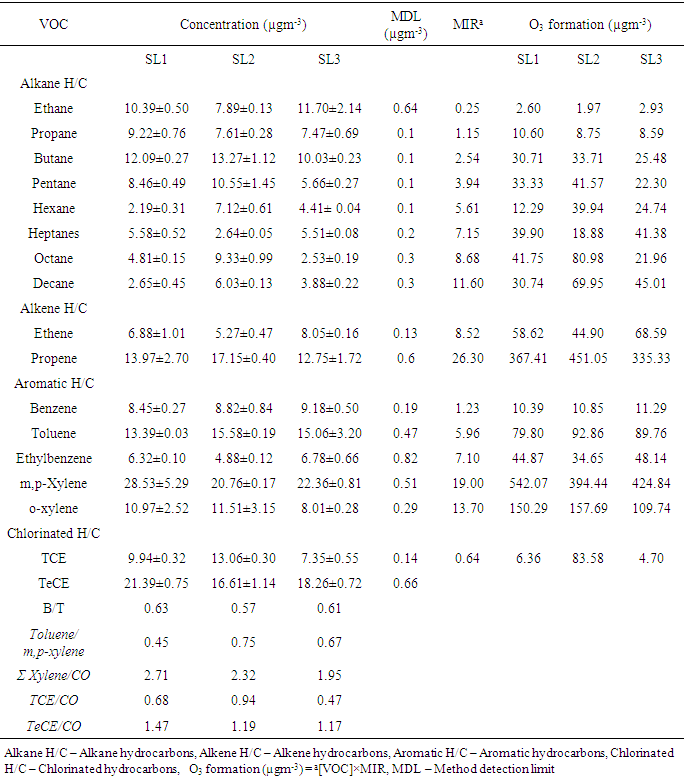
Average concentrations of seventeen VOCs measured belonging to alkane, alkene, aromatic and chlorinated hydrocarbons are presented in table 4. Abundance of VOCs species measured follows SL2 (34.70%) > SL1 (34.20%) > SL3 (31.10%). n - ethane, propene, m,p – xylene and tetrachloroethene dominated alkane, alkene, aromatic and chlorinated hydrocarbons groups respectively. Aromatic hydrocarbons were found to be most abundant at SL1 and SL3 while alkane hydrocarbons accounted for highest abundance at SL2. Alkene hydrocarbons had the lowest abundance at all locations. m/p – xylene was the most abundant at all locations accounting for 16.28%, 11.66% and 14.06% at SL1, SL2 and SL3 respectively.
Table 4. Average concentrations and ozone formation abilities of VOC species
     
VOCs in the atmosphere are emitted from mainly two sources; combustion and solvent evaporation [18]. They are very reactive and are dependent on meteorological parameters, thus, their levels are not determined only by their emissions. However, the ratios of levels for VOC pairs, which are not influenced by dilution, can be used to trace sources if they remain relatively stable during atmospheric reactions or are changed with atmospheric reactions [29, 31].
Benzene to toluene ratio has been used to identify VOCs sources. A B/T ratio of 0.5 has been reported to be characteristic of combustion from vehicular activities while higher values have been reported for bio-fuel burning, charcoal and coal burning [19, 32]. The main source of benzene is the combustion process from traffic exhaust and industrial emissions because of its use as solvent has been forbidden in the industries [18, 19, 26].
B/T ratios (table 4) of 0.63, 0.57 and 0.61 for SL1, SL2 and SL3 respectively suggest that vehicular activities were the major VOC contributors to aromatic hydrocarbons emission in this study. The ratios in this study are in agreement with results obtained by [18, 20].
Other ratios that can be used as markers to identify VOC emission sources are toluene/m,p-xylene, xylene/CO, TCE/CO and TeCE/CO. Xylene, trichloroethene and tetrachloroethene are used as industrial solvents in the production of paints, plastic and as degreasers while CO results from incomplete combustion [24, 26, 31]. These ratios are therefore indicators of solvent use relative to combustion sources. Low ratios (table 4) calculated for all locations suggest solvent evaporation. This agrees with results obtained by [31, 33]. Plastic industries and other manufacturing companies in and around the sampling locations could be the responsible sources of these pollutants.
Factor analysis using PCA was employed to identify different sources of emission of VOCs. Factors extracted by PCA which accounted for 89.79% of total variance (eigenvalue ≥ 1) are presented in table 5. Factor 1 with variance 47.25% is highly loaded with ethane, butane, pentane, octane, propene, o – xylene and trichloroethene. Ethane, butane and pentane are usually products of unburned vehicular emission, gasoline evaporation, liquefied petroleum leakage, propene is a characteristic product of internal combustion engine while o –xylene and trichloroethene are solvent related [18, 19, 20]. Factor 2 is highly loaded with propane, heptane, m/p – xylene and tetrachloroethene. This is related to solvent evaporation. Propane is emitted from gasoline evaporation while m/p – xylene and tetrachloroethene are emitted from fuel and other solvents evaporation [19]. Factor 3 correlated highly with benzene and toluene. This indicates combustion related emission for benzene and industrial applications using solvents for toluene [18].
Table 5. Factor analysis of VOC species
     
Factor analysis and ratios calculated for volatile organic compounds reveal industrial emission, vehicle exhaust and solvent evaporation as their sources.

3.3. Ozone Formation and Apportionment

The ratio of VOCs/NOx can be used to evaluate whether the production of O3 is VOC-sensitive or NOx-sensitive [34]. Morning VOCs/NOx ratios lower than 10 were equated with VOC-sensitive peak ozone and Morning VOCs/NOx ratios greater than 20 correspond to NOx-sensitive peak ozone [11, 35]. In this study, TVOC to NOx ratios (table 1) are lower than 10 in SL1 and SL3 while it is higher than 10 at SL2. This indicates that at all locations, O3 formation is VOCs sensitive.
VOCs are ozone-forming species, thus, photochemical reactivity of measured VOCs were estimated using maximum incremental reactivity (MIR). The results are presented in table 4. m/p – xylene was the highest contributor to O3 formation at SL1 and SL3 while propene had highest contribution at SL2. Ethane contributed the least to O3 formation.
Since O3 formation at all locations was VOC sensitive and m,p- xylene which is solvent related played the most important role in O3 formation at all locations, it could therefore be deduced that solvent use and unburned fuel were the major contributors to O3 formation at all locations.

4. Conclusions

In this study, we have reported the concentrations of toxic pollutants, volatile organic compounds and meteorological parameters measured in three locations of Ilupeju indusrial Estate. Concentrations of toxic pollutants such as CO, NO2 and SO2 were higher than acceptable limits and were dependent on meteorological parameters such as temperature, pressure, humidity and wind speed. Majority of VOCs ratios revealed solvent related and unburned fuel emissions from these locations except B/T ratio which indicated a traffic related emission. m,p - xylene and propene were the major contributors to O3 formation at SL1, SL2 and SL3 respectively. Ozone determined was VOC sensitive at all locations. PCA of the results showed traffic related emission sources for toxic pollutants and solvent use as sources for VOCs.

References

[1]  Parrish D, Holloway J, Jakoubek R, Trainer M, Ryerson T, Hubler G, Fehsenfeld F, Moody J, Cooper O (2000). Mixing of anthropogenic pollution with stratospheric ozone: A case study from the North Atlantic wintertime troposphere. Journal of Geophysical Research. 105(D19):24363-24374.
[2]  Ajayi AB, Dosunmu OO (2002). Environmental hazards of importing used vehicles into Nigeria, Proceedings of International Symposium on Environmental Pollution Control and Waste Management. 521–532.
[3]  Abam FI, Unachukwu GO (2009). Vehicular emission and air quality standards in Nigeria. European Journal of Scientific Research. 34(4): 550–560.
[4]  Hopkins JR, Evans MJ, Lee JD, Lewis AC, Marsham JH, McQuaid JB, Parker DJ, Stewart J, Reeves CE, Purvis RM (2009). Direct estimates of emission from the Megacity of Lagos. Atmospheric Chemistry and Physics. 9: 8471–8477.
[5]  Nagpure AS, Sharma K, Gurjar BR (2013). Traffic induced emission estimates and trends (2000–2005) in megacity Delhi. Urban Climate. 4: 61–73.
[6]  Lirong Z, Xinming W, Quisheng H, Hao W, Guoying S, Chan LY, Jiamo Y, Blake DR (2004). Exposure to hazardous volatile organic compounds, PM10 and CO while walking along streets in urban Guangzhou, China. Atmospheric Environment. 38: 6177-6184.
[7]  Abdul Raheem AMO, Adekola FA (2013). Variation of source distribution of total oxidants: Contributions of oxides of nitrogen, sulphur (IV) oxide emissions and background ozone from Lagos-Nigeria, International Journal of Physical Science. 8(11): 411-420.
[8]  Dara SS (2004). A Textbook of Environmental Chemistry and Pollution Control, S. Chand and Company Ltd. New Delhi 110055.
[9]  Saunois M, Reeves CE, Mari CH, Murphy JG, Stewart DJ, Mills GP, Oram DE, Purvis RE (2009). Factors controlling the distribution of ozone in the West African lower troposphere during the AMMA (African Monsoon Multidisciplinary Analysis) wet season campaign. Atmospheric Chemistry and Physics. 9: 6135–6155.
[10]  Brook RD, Franklin B, Cascio W, Hong Y, Howard G, Lipsett M, Leupker R, Mittleman M, Samet J, Smith SC, Tager I (2004). Air pollution and cardiovascular disease: a statement for healthcare professionals from the expert panel on population and prevention science of the American Heart Association. Circulation. 109: 2655-2671.
[11]  Pudasainee D, Sapkota B, Shrestha ML, Kaga A, Kondo A, Inoue Y (2006). Ground level ozone concentrations and its association with NOx and meteorological parameters in Kathmandu valley, Nepal. Atmospheric Environment. 40: 8081–8087.
[12]  Minga A, Thouret V, Saunois M, Delon C, Serca D, Mari B. Sauvage C, Mariscal B, Leriche, B. Cros M (2010). What caused extreme ozone concentrations over Cotonou in December 2005? Atmospheric Chemistry and Physics. 10: 895–907.
[13]  Bell ML, McDermott A, Zeger SL, Samet JM, Dominici F (2004). Ozone and short term mortality in 95 US urban communities 1987–2000. JAMA. 292: 2372-2378.
[14]  Volkamer R, Sheehy P, Molina LT, Molina MJ (2010). Oxidative capacity of the Mexico City atmosphere – Part 1: A radical source perspective. Atmospheric Chemistry and Physics. 10: 6969-6991.
[15]  Kgabi NA, Sehloho RM (2012). Tropospheric Ozone Concentrations and Meteorological Parameters, Global Journal of Scientific Frontier in Research and Chemistry. 12: (2012) 10–21.
[16]  Nair PR, Chand D, La S, Modh KS, Naja M, Parameswaran M, Ravindran S, Venkataramani S (2002). Temporal variations in surface ozone at Thumba (8.6N, 77 E) –a tropical coastal site in India. Atmospheric Environment. 36: 603–610.
[17]  Gerasopoulos E, Kouvarakis G, Vrekoussis M, Donoussis C, Mihalopoulos N, Kanakidou M (2006). Photochemical ozone production in the Eastern Mediterranean, Atmospheric Environment. 40: 3057–3069.
[18]  Barletta B, Meinardi S, Rowland FS, Chan CY, Wang X, Zou S, Chan LY, Blake DR (2005). Volatile organic compounds in 43 Chinese cities. Atmospheric Environment. 39: 5979–5990.
[19]  Barletta B, Meinardi S, Simpson IJ, Khwaja HA, Blake DR, Rowland FS (2002). Mixingratios of volatile organic compounds (VOCs) in the atmosphere of Karachi, Pakistan. Atmospheric Environment. 36: 3429–3443.
[20]  Duan J, Tan J, Yang L, Wu S, Hao J (2008). Concentration, sources and ozone formationpotential of volatile organic compounds (VOCs) during ozone episode in Beijing. Atmospheric Research. 88: 25–35.
[21]  Zhou J, You Y, Bai Z, Hu Y, Zhang J, Zhang N (2011). Health risk assessment of personal inhalation exposure to volatile organic compounds in Tianjin, China. Science of Total Environment. 409(3): 452- 459.
[22]  Maruo YY, Yamada T, Nakamura J, Izumi K, Uchiyama M (2010). Formaldehydemeasurements in residential indoor air using a developed sensor element in the Kanto area of Japan. Indoor Air. 20(6): 486-493.
[23]  Olajire AA, Azeez L, Oluyemi EA (2011). Exposure to hazardous air pollutants along Oba-Akran Road, Lagos Nigeria. Chemosphere. 84:1044-1051.
[24]  Olajire AA, Azeez L (2014). Source apportionment and ozone formation potential of volatile organic compounds in Lagos, Nigeria. Chemistry and Ecology. 30(2):156-168.
[25]  USEPA Office of Air and Radiation, Implementation principles for the clean air amendment of 1990, 2000.
[26]  Wang T, Cheung TF, Li YS, Yu XM, Blake DR (2002). Emission characteristics of CO, NOx, SO2, and indications of biomass burning observed at a rural site in eastern China. Journal of Geophysical Research. 107(D12): 4157, doi:10.1029/2001JD000724.
[27]  Elminir HK (2005). Dependence of urban air pollutants on meteorology. Science of Total Environment. 350: 225 – 235.
[28]  Chu HJ, Lin CY, Liau CJ, Kuo YM (2012). Identifying controlling factors of ground-level ozone levels over southwestern Taiwan using a decision tree. Atmospheric Environment. 60: 142-152.
[29]  Atkinson R, Arey J (2003). Atmospheric degradation of volatile organic compounds. Chemical Reviews. 103: 4605–4638.
[30]  Li W, Tu J, Xia Z, Wang H (2007). Temporal variations in surface ozone and its precursors and meteorological effects at urban sites in China. Atmospheric Research. 85: 310-337.
[31]  Zhang Y, Wang X, Blake DR, Li L, Zhang Z, Wang S, Guo H, Lee FRC, Gao B, Chan L, Wu D, Rowland FS (2012). Aromatic hydrocarbons as ozone precursors before and after outbreak of the 2008 financial crisis in the Pearl River Delta region, South China. Journal of Geophysical Research. 117 d15306, doi:10.1029/2011jd017356.
[32]  Zhao LR, Wang XM, He QS, Wang H, Sheng GY, Chan LY, Fu JM, Blake DR (2004). Exposure to hazardous volatile organic compounds, PM10, and CO while walking along streets in urban Guangzhou, China. Atmospheric Environment. 38:6177-6184.
[33]  Na K, Kim YP, Moon K (2003). Diurnal characteristics of volatile organic compounds in the Seoul atmosphere. Atmospheric Environment. 37: 733–742.
[34]  Carter WPL (1994). Development of ozone reactivity scales for volatile organic compounds. JAWMA. 44: 881–899.
[35]  Sillman S (1999): The relation between ozone, NOx and hydrocarbons in urban and polluted rural environments. Atmospheric Environment. 33:1821–1845.