-
Paper Information
- Paper Submission
-
Journal Information
- About This Journal
- Editorial Board
- Current Issue
- Archive
- Author Guidelines
- Contact Us
American Journal of Chemistry
p-ISSN: 2165-8749 e-ISSN: 2165-8781
2016; 6(2): 60-64
doi:10.5923/j.chemistry.20160602.06

Qualification and Quantitation of Kratom Compounds in Human Urine by High Performance Liquid Chromatography-Tandem Mass Spectrometry
 Abstract
 Reference
 Full-Text PDF
 Full-text HTML
S. K. Sudheedibu1, 2, R. L. Jangher1, A. H. Kaive3, N. J. Naickereebu4
1Turis Chemicals Company, Anantapur, Andhra Pradesh, India
2College of Agriculture, Engineering and Science, University of Kwazulu-Natal, South Africa
3Quality Assurance, Erina Analytical Services, Addis Ababa, Ethiopia
4Production Department, Erina Analytical Serivices, Khartoum, Sudan
Correspondence to: S. K. Sudheedibu, Turis Chemicals Company, Anantapur, Andhra Pradesh, India.
| Email: |  |
Copyright © 2016 Scientific & Academic Publishing. All Rights Reserved.
This work is licensed under the Creative Commons Attribution International License (CC BY).
http://creativecommons.org/licenses/by/4.0/

Mitragynine and its major metabolite, 7-hydroxymitragynine (also known as “Kratom”), are drugs which extracts from a tree planted in Thailand, Myanmar and other Southeast Asian countries. Nowadays, kratom compounds are used as recreational drugs in many countries all over the world. Chromatography coupling to mass spectrometry becomes a vital instrumentation tool for the separation and determination of small molecules qualitatively and quantitatively. The previous report studied a novel method for screening and identification of mitragynine and 7-hydroxymitragynine in human urine by liquid chromatography tandem mass spectrometry. However, the method conditions were not optimized. The objective of this study is to explore a rapid approach to separate and identify the kratom compounds by new instrumentation-ultra high performance liquid chromatography tandem mass spectrometry (UHPLC-MS/MS). Ultra high performance liquid chromatography tandem mass spectrometry (UHPLC-MS/MS) was utilized to perform method development and optimization. Experiments were carried out using a state-of-the-art ultra high performance liquid chromatography system. The method was found linear in the range of 10 - 100 ng/mL. In the linearity study, good regression equation and correlation coefficient were achieved. Comparing to HPLC system, UHPLC exhibited short analysis time and high selectivity. The optimized method can be used for the separation and detection of mitragynine and 7-hydroxymitragynine.
Keywords: Mitragynine, 7-hydroxymitragynine, Liquid chromatography, Mass spectrometry
Cite this paper: S. K. Sudheedibu, R. L. Jangher, A. H. Kaive, N. J. Naickereebu, Qualification and Quantitation of Kratom Compounds in Human Urine by High Performance Liquid Chromatography-Tandem Mass Spectrometry, American Journal of Chemistry, Vol. 6 No. 2, 2016, pp. 60-64. doi: 10.5923/j.chemistry.20160602.06.
Article Outline
1. Introduction
- Mitragynine and its major metabolite, 7-hydroxymitragynine (also known as “Kratom”), are drugs which extracts from a tree planted in Southeast Asian countries [1]. Nowadays, kratom compounds are used as recreational drugs in many countries all over the world. Mitragynine and 7-hydroxymitragynine (physical properties shown as Table 1) is structurally similar to each other [2, 3].
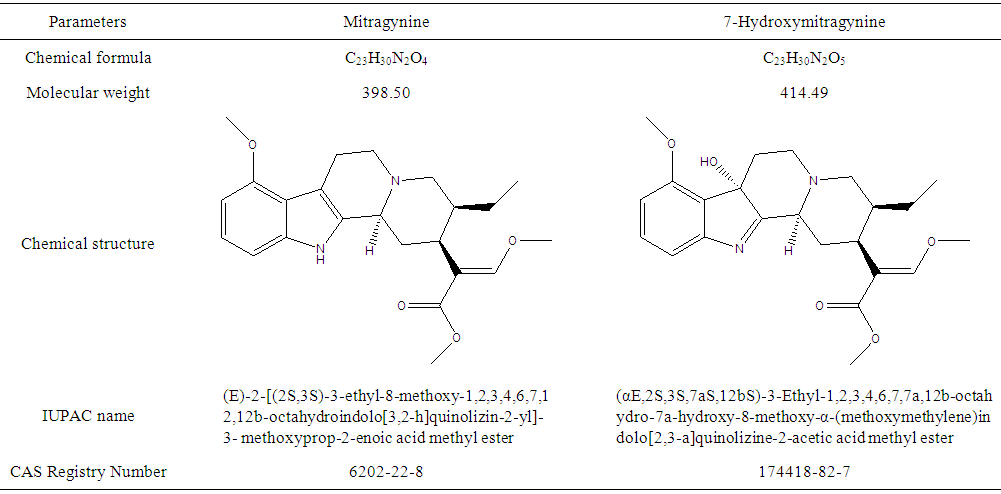 | Table 1. Physical properties of mitragynine and 7-hydroxymitragynine |
2. Experimental
2.1. Reagents
- Acetonitrile and LC-MS grade water were purchased from Aldrich Chemical Company Inc. (Milwaukee, WI, USA). Mitragynine and 7-hydroxymitragynine standards were purchased from Cerilliant Chemicals (Texas, USA). The C-18 column was purchased from Agilent Technologies. Calibration standard solutions were prepared prior to method development and stored at -4°C to keep the active component effective.As presented in Table 1, mitragynine and 7-hydroxymitragynine have the molecular weight of 398.50 and 414.49, respectively. The chemical formula of mitragynine is C23H30N2O4 with Chemical Abstract Service (CAS) registry number 6202-22-8, and the chemical formula of 7-hydroxymitragynine is C23H30N2O5 with CAS registry number 174418-82-7. The difference between the two compounds is only one oxygen in terms of atoms.
2.2. Instrument
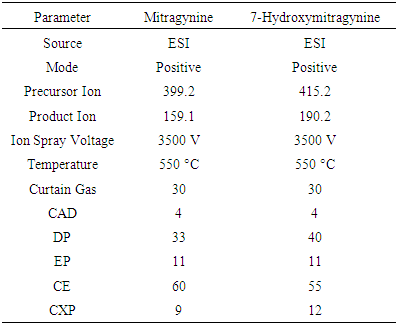
- The experiments were carried on an Agilent 1290 Infinity LC Systems coupling to a Sciex API 4000 triple quadrupole mass spectrometer. A 2.6-µm 50 mm × 2.1 mm C-18 analytical column was utilized with a 0.6-mL/min flow rate of mobile phases.The mass spectrometer was optimized to achieve rapid and effective goals for the objectives using direct infusion techniques before exploring UHPLC parameters. The mass spectrometer parameters are shown as Table 2.
|
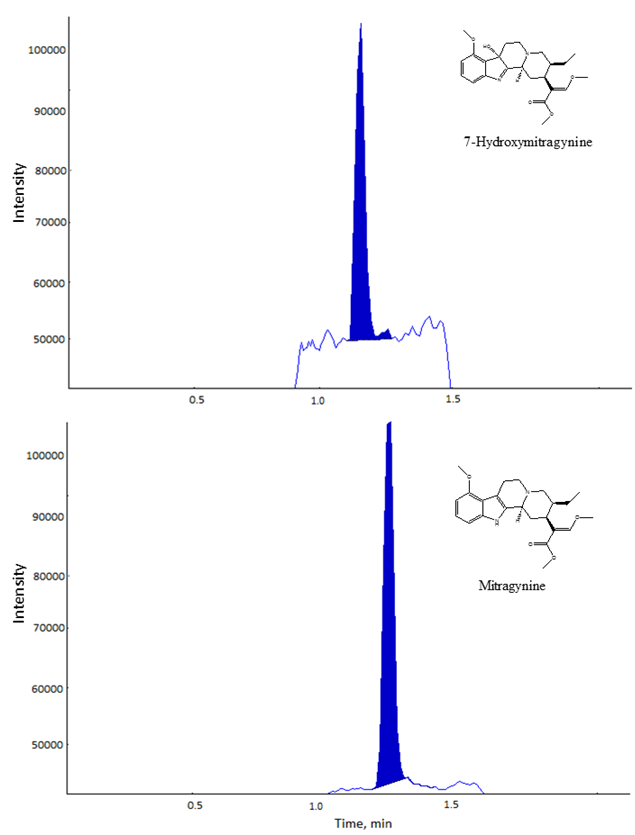 | Figure 1. Extracted Ion Chromatogram of mitragynine and 7-hydroxymitragynine |
2.3. Preparation of Standard Solutions
- Stock solutions of 100 µg/ml of mitragynine and 100 µg/ml of 7-hydroxymitragynine were prepared by dissolution of standard compounds in 100% methanol for long term storage. The stock solutions were further diluted with methanol to prepare working standard solutions at lower concentrations.
3. Results and Discussion
3.1. Method Optimization
- Kratom compounds were eluted with mobile phases of water with 0.01% formic acid as mobile phase A) and acetonitrile as mobile phase B). Fig. 1 illustrates the optimized separation results of the two analytes, mitragynine and 7-hydroxymitragynine. The gradient begins with 10% of mobile phase A, with a linear gradient to 60% within 3 min. A 3-minute post run was employed after both compounds eluted.As demonstrated in Fig. 1, the 7-hydroxymitragynine was eluted first at 1.26 min. The mitragynine was then eluted at 1.38 min. The two compounds were separated under the previously describe conditions.This method provides a rapid approach for qualitative and quantitative analysis of the mitragynine and 7-hydroxymitragynine, where both compounds were eluted within 2 min.
3.2. Method Examination
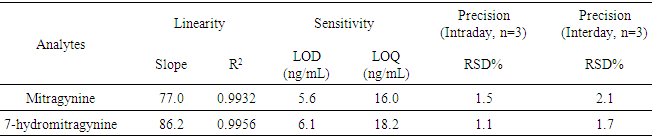
- The calibration model or linearity of the method is a mathematical representation of the correlation between instrument signal and analyte concentration [3]. To examine the linearity of the developed method, five levels of concentration were used. The peak area ratios (PAR) from these calibrators are then plotted versus concentration. After the data are plotted, they should be fitted (regressed) with a best fit line. While the R2 or correlation value (r) may be evaluated, it is more appropriate to evaluate residuals. In general, the r should be greater than 0.98 and the residuals (back calculated values) should be within 25% of the expected values. Fig. 2 demonstrates the linearity of mitragynine.
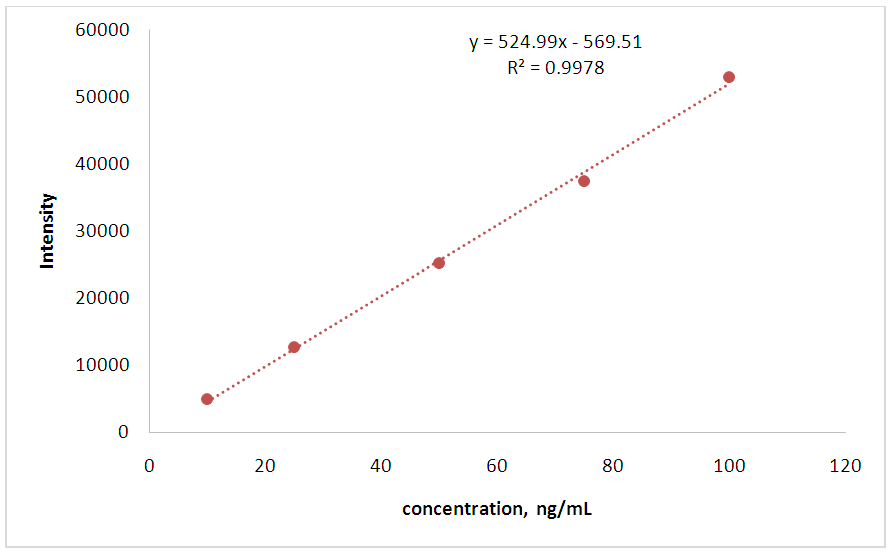 | Figure 2. Linearity of mitragynine |
|
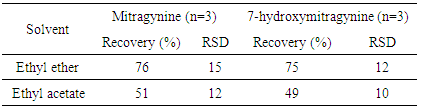
3.3. Liquid-liquid Extraction Evaluation
- Liquid-liquid extraction is widely used for sample clean-up and sample pre-concentration purposes. The liquid-liquid extractions of mitragynine and 7-hydroxymitragynine were evaluated with two solvents, ethyl ether and ethyl acetate. The ratio between quantified values and control spiked values, termed as the recoveries, were examined using urine samples spiking with a known amount of mitragynine and 7-hydroxymitragynine standards.The calculation results of mitragynine and 7-hydroxymitragynine using different solvents were presented in Table 4. It can be concluded that both solvents are good choice for liquid-liquid extraction of mitragynine and 7-hydroxymitragynine compounds.
|
4. Conclusions
- The current study presents a rapid and selective method for the separation and detection of mitragynine and 7-hydroxymitragynine using ultra high performance liquid chromatography-tandem mass spectrometry (UHPLC-MS/MS). This method can be applied for routine clinical and forensic applications.