-
Paper Information
- Next Paper
- Paper Submission
-
Journal Information
- About This Journal
- Editorial Board
- Current Issue
- Archive
- Author Guidelines
- Contact Us
American Journal of Chemistry
p-ISSN: 2165-8749 e-ISSN: 2165-8781
2016; 6(2): 36-46
doi:10.5923/j.chemistry.20160602.03

The Influence of Addition of CdS on the Properties of TiO2 Nanoparticle Prepared by Sol-Gel Method
 Abstract
 Reference
 Full-Text PDF
 Full-text HTML
Ramzei R. AL-Ani , Yousif K. Abdul Amir , Fadhela M. Hussein
Chemistry Department, College of Science, AL-Mustansiriyah University, Baghdad, Iraq
Correspondence to: Fadhela M. Hussein , Chemistry Department, College of Science, AL-Mustansiriyah University, Baghdad, Iraq.
| Email: |  |
Copyright © 2016 Scientific & Academic Publishing. All Rights Reserved.
This work is licensed under the Creative Commons Attribution International License (CC BY).
http://creativecommons.org/licenses/by/4.0/

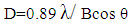
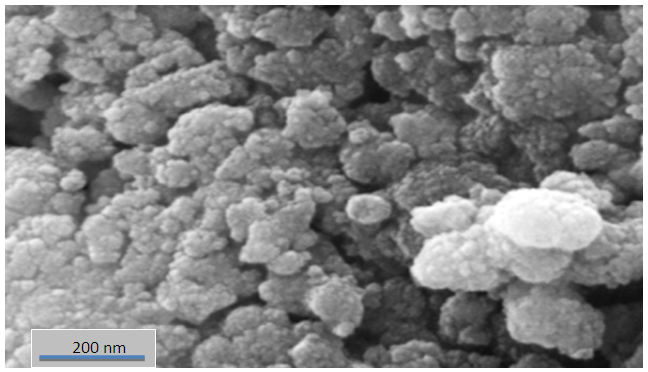
In this study TiO2/CdS nanoparticles synthesized through chemical reaction by sol-gel method. The nanoparticles were characterized using techniques like X-ray diffraction (XRD), scanning electron microscope (SEM), UV-visible reduction spectroscopy and atomic force microscope AFM. TiO2/CdS Nanoparticles, the coupling of CdS nanoparticles with TiO2 resulted in changes in electronic absorption and crystal shape. Spectral techniques used to measured particle sized, which was found around (17.42) nm. SEM image shows that the TiO2/CdS are spherical in shape with average diameter (28.5) nm, the photo degradation of p-nitrotolune was observed by kinetic studies indicate that the reaction to pseudo first order and decreasing of rate reaction with increasing initial concentration for p-nitrotolune.
Keywords: Sol-Gel method, Nano TiO2/ CdS, Photocatalytic activity
Cite this paper: Ramzei R. AL-Ani , Yousif K. Abdul Amir , Fadhela M. Hussein , The Influence of Addition of CdS on the Properties of TiO2 Nanoparticle Prepared by Sol-Gel Method, American Journal of Chemistry, Vol. 6 No. 2, 2016, pp. 36-46. doi: 10.5923/j.chemistry.20160602.03.
Article Outline
1. Introduction
- Nano technology has remained tiny exciting field of interest of research and gained a great importance from the past two decades. Nanoparticles are smaller microscopic particles or nano-technology allows us to address the matter at the molecular level (much less than 100nm) [1].Attracted semiconducting nanoparticles to the benefits over the past decade due to the unique size of its kind attached, chemical and physical properties. [2] Semiconducting nanoparticles due to specific optical, electronic and catalytic properties, and damping is achieved mostly bonds capping such bipyridine thiolates have been reported to minimize surface defects and increase luminescence efficiency. [3] Nano-sized particles of semiconductor material has gained more attention in recent years due to the characteristics of the coveted and their applications in various fields such as catalysts, prospector, optical devices, Nanomaterials. This highly functional contains the electronic and structural properties, and new thermal involving the interests of scientific and high in basic and applied fields. [4]Light heterogeneous is one of the advanced oxidation processes for the removal of organic contaminants.In this process, metal oxide semiconductors absorb light and generate an activity which leads to complete oxidation of organic compounds found in wastewater. TiO2 metal oxide semiconductor with a wide band gap (3.2ev). And the role of transition metal ions in TiO2 is that the transition metal ion provides a way to trap charge carriers and thus improve the efficiency of the catalyst. [5]The main goal of the dope is to make a bathochromic turns into a low band gap, or the forefront of countries within the band gap, which causes the absorption of light more clearly.It seems that modifying the surface of nanoparticles TiO2 be more beneficial than modifying TiO2 wholesale.Photocatalysts semiconductor alongside the exhibition is very high optical activity of both gas and liquid phase reactions by increasing the separation of the charge and the expansion of the scope of the power of excitement image.The molecular geometry, surface texture and size of the particles play an important role in the transfer. There particle electron great deal of interest in coupling particales semiconductors with various TiO2, with couples like TiO2 -Bi2S3, TiO2-WO3, TiO2-SnO2, TiO2-MoO3, and iO2-Fe2O3 [6].Here in TiO2/CdS were prepared by sol- gel method. Its photocatalytic activity was evaluated by degradation of p-nitrotolune and effects of various parameters on the photocatalytic of TiO2 /CdS were studied.
2. Materials and Methods
- Cadmium chloride, sodium sulfide (Merck) and Titanium tetraisopropoxide was supplied by Sigma-Aldrich with purity of 97%. thioglycerol (Fluka). All reagents consumed were of analytical grade purity and were procured from Merck chemical Reagent Co. LTD. Technical grade (Sigma, Aldrich), ethanol absolute (Merck) and distilled water used for the preparation of nanoparticles by the sol-gel. p-nitrotolune was supplied by Sigma-Aldrich with purity of 99.5%.The prepared crystalline nanoparticles structure were characterized using X-ray diffraction (Shimadzu XRD -6000) at room temperature operating at 40 Kv, current 30 mA range (20-80) deg speed 5(deg/min), preset time =0.6 sec. Using CuKα, λ = 0.15406 nm radiation. Surface morphology was studied by using SEM (Sigma). electronic spectra UV-visible spectrophotometer (100 Conc/ Varian. USA), the average particale size were measured using atomic force microscope (AFM) AA300 scanning probe microscope angstrom Advanced Inc.The surface area of nanoparticles was studied by using Instrument NOVA station A.Fourier transform infrared (FT-IR) measurements were executed using perkin Elmer spectrum, the recording spectrum in the range (400-4000 cm-1). The U.V light is generated from a 150 w medium pressure mercury lamp supplier from PHYWE (England).The photocatalytic activity of the calcined powder was investigated by the degradation of p-nitrotolune solution was employed as model pollutant to measure the photocatalytic activity of TiO2/ CdS catalysts.40 ml of p-nitrotolune aqueous solution, the solution was placed in a photocatalytic reactor and stirred and irradiated with UV-lamp, 3 ml of the suspension was extracted and separate the powder from the supernatant for 15 min by centrifuged at 7000 rev/min .UV-Visible spectroscopy was used to generate time dependent absorbance changes in the range 200-800 nm .degraded of p- nitrotolune solution was determined by measuring the absorbance at λ = 285 nm.Synthesis of TiO2 coupled CdS nanoparticle.(A) The synthesis of TiO2 was obtained from titanium tetra isopropoxide (TTIP) was dissolved in absolute ethanol and deionization water of a molar ratio of Ti:H2O = 1:4, Nitric acid was used to adjust the pH and for restrain the hydrolysis process of the solution. After for 24 hour the gels were dried under 80°C for 2 hours to evaporate water and organic material to the maximum extent. Then the dry gel was calcination at 450°C for 2 hours were subsequently carried out to obtain desired TiO2 nanoparticles. [7, 8](B) Synthesis of TiO2/ CdS by addition aqueous solution of step (A) (0.8 gm ) dissolved in absolute ethanol with CdCl2 in deionization water molar ratio (2:1), thioglycerol (TG) was added drop wise into the aqueous solution and (0.1 mol) of Na2S solution was injected drop by drop into the above solution for 60 minute under stirring. Final mixture was stirred for six hours at 70°C reflux. The solid were separated from solution by centrifuge (3500 rpm) for 15 minutes and was washed several times with acetone to get rid of unreacted solvent pale yellow, drying for 4 hours and aging for 72 hour nanoparticle was collect as white.
3. Results and Discussion
- X-ray diffraction patterns of TiO2/CdS by sol-gel technique figure (1) shows peaks at 2 θ = 25.21, 47.95 and 53.82° which belong to (101), (002) and (105) these peaks can be indexed to anatase phase (JCPDS card No.21-1272), and these peaks also appeared in all doped which indicates that CdS doping did not change TiO2 lattice structure with lower CdS doping exhibited strong preferential orientation of (101) plane.
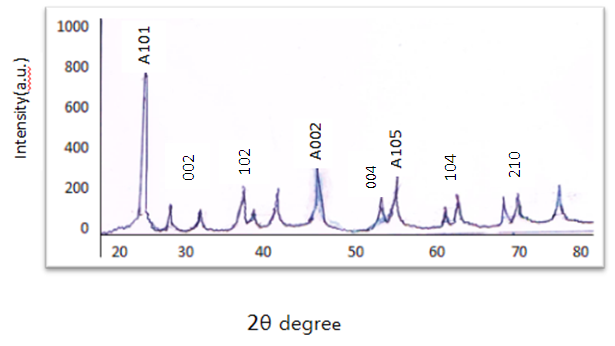 | Figure (1). XRD pattern of TiO2 /CdS nanoparticles by sol-gel method |
 | (1) |
 | Figure (2). SEM images of TiO2/CdS nanoparticles |
 | Figure (3). AFM image of TiO2 coupled CdS nanoparticles |
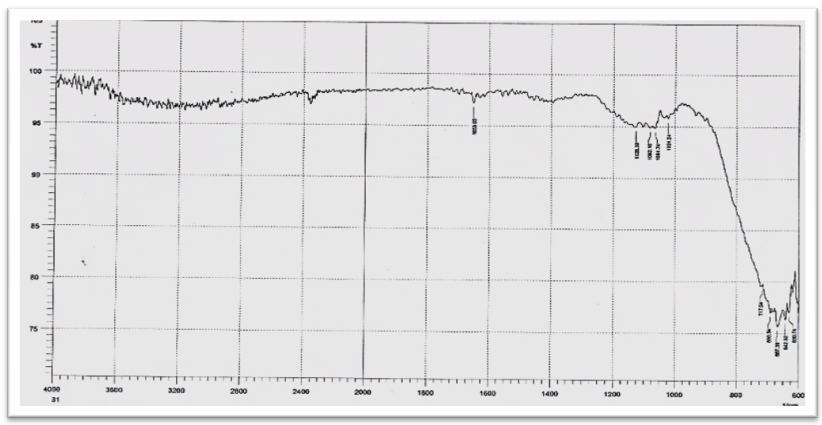
 | Figure (4). FTIR Spectrum of CdS nanoparticles |
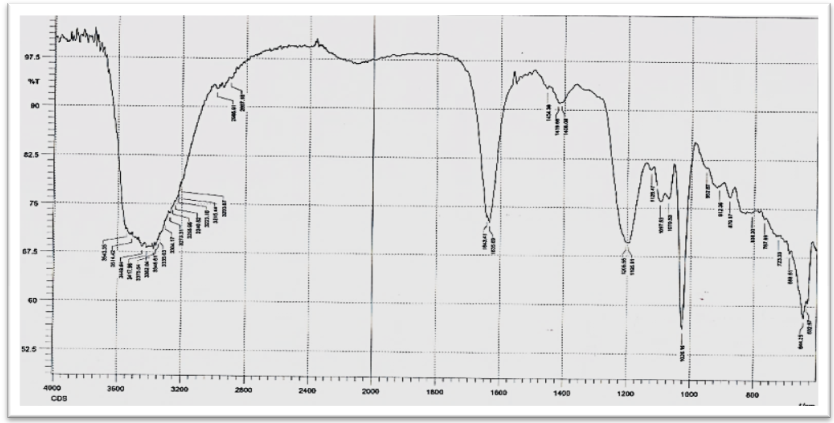
 | Figure (5). FTIR Spectrum of TiO2/ CdS nanoparticles |
 | (2) |
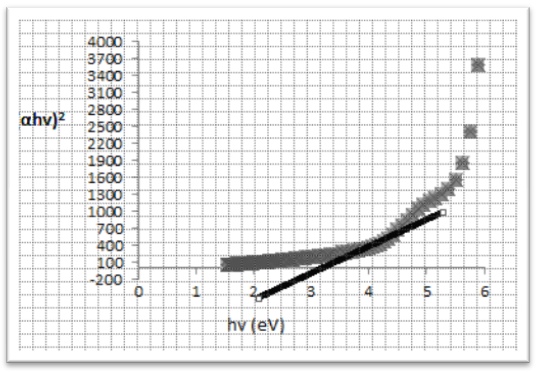 | Figure (6). Band gap measurement by plot (αhv)2 via hv for TiO2/ CdS |
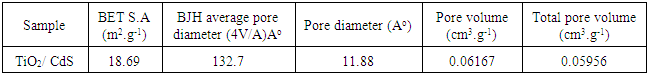
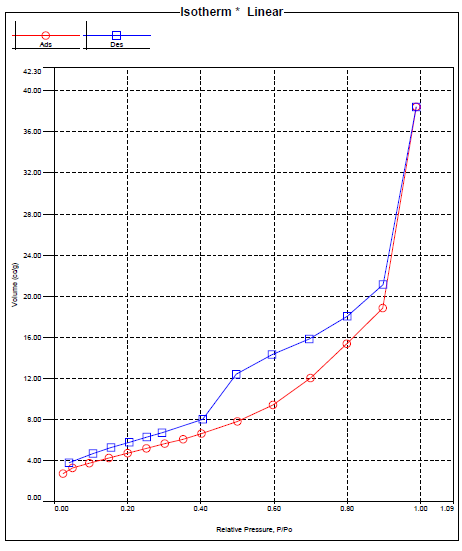 | Figure (7). Isotherm of TiO2/ CdS |
|
3.1. Effect Concentration of TiO2/CdS Nanoparticle
- Numerous forms of TiO2 have been synthesized by different methods with the aim to achieve materials exhibiting desirable physical properties, activity and stability for photocatalytic application [15].To optimum of catalyst loading was studied within the range of 0.025 to 0.25 gm/l.Figure (8) shows that photodegradation of p-NT increased gradually with loading of TiO2 / CdS nanoparticles up to 0.125 gm/l and 66.8% efficiency was achieved after 180 min irradiation time.
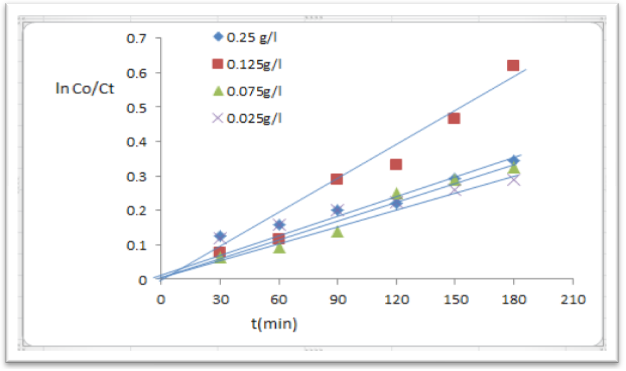 | Figure (8). Concentration different of nanoparticle TiO2/ CdS, p-NT (1*10-4)M |
3.2. Effect of Initial Concentration of p-NT
- The effect of varying 4-NT concentration at range (1-7*10-4M) on its degradation rate is shown in figure (9) from the results of the higher of 4-NT concentration, the higher the degradation efficiency of 4-NT decomposition.A Langmuir –Hinshelwood medal of relationship can be used to describe the effect of 4-NT concentration on its degradation.The results clearly that the photocatalytic process is promising of the pollutant, this is occurs for heterogeneous catalytic systems.When the initial concentration of 4-NT is 7*10-4 M as presented in figure (9) can be higher efficiency degradation (71.3%) within the 180 min irradiation time.
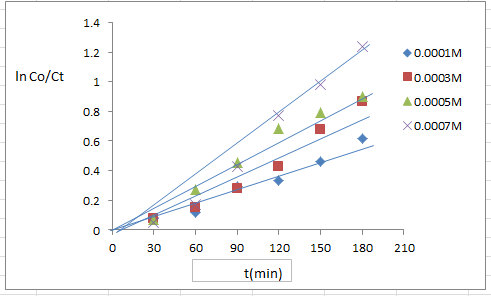 | Figure (9). Different concentration of p-NT, TiO2/CdS nanoparticle (0.125 g/l) pH 5.9, T 25°C |
 | (3) |
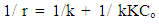
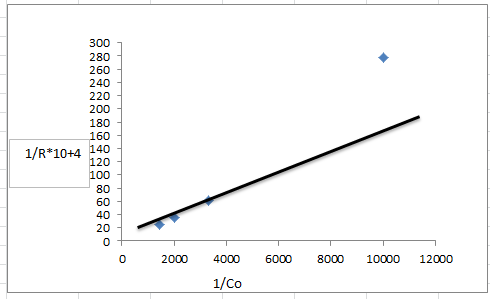 | Figure (10). plot of the reverse of the initial rate of p-NT in TiO2/ CdS nanoparticle (0.125 g/l) against the revese of the initial p- N.T concentration |
3.3. Effect of pH Value
- The pH of the solution has strong effect on the photodegradation process, the pH value of 4-NT solution has significant influence on the photocatalytic activity of sample.The optimal pH of reaction mixture for the photodegradation of 4- NT a series of experiments was conducted at different pH values of (3, 5.9, 7 and 9).The results increase in pH of 4-NT solution from (3 to 7) led to the enhanced efficiency in the photodegradation of solution, but increase in pH at 9 showed only small decrease in the photodegradation efficiency.As shown in figure (11) shows the initial rate of 4-NT photodegradation process in different solution pH, this results as similar to the results photodegradation of permethrin on TiO2 surface was obtained in acidic medium (pH7 and pH2) occurs the highest rate of photodegradation [19].
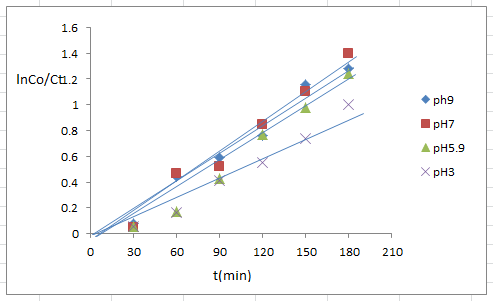 | Figure (11). pH different of nanoparticle TiO2/CdS (0.125 g/l), 4-NT( 7*10-4)M |
 | (4) |
 | (5) |
3.4. Effect of Temperature on Photodegradation of 4-NT by TiO2/CdS Nanoparticle
- The dependence of photocatalytic activity with temperature [21] generally the increase in temperature enhances recombination of charge carriers, resulting in a decrease of photocatalytic activity [15].The photodegradation reaction for 4- NT have been carried out by varying the reaction temperature from 288 to 318 k figure (12) shows represent the rate constant for 4-NT in aqueous TiO2 /CdS suspension at different temperatures at 298 k occurs higher degradation efficiency (75.26%).
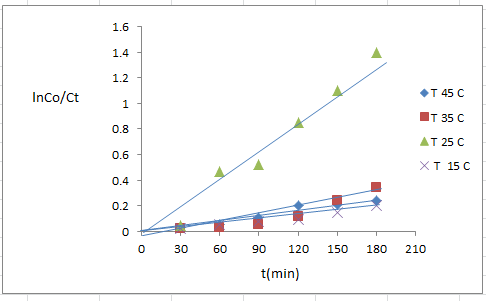 | Figure (12). Temperature different of nanoparticleTiO2/ CdS (0.125 g/l), 4-NT(7*10-4)M, pH7 |
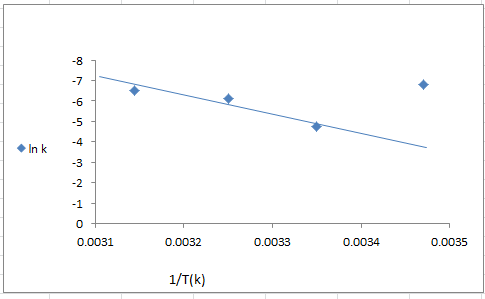 | Figure (13). Arrhenius plot for the degradation of p-N.T (7*10-4M) on irradiated TiO2/CdS nanopartical (0.125 g/l) |
3.5. Effect Different of Sources Light
- The rate of photodegradation of 4-NT in aqueous TiO2 coupled CdS suspension determined under (UV-light, visible light and sun light) irradiation.The result observed in figure (14) and figure (15) shows the degradation efficiency (83.04%) under 300 watt.
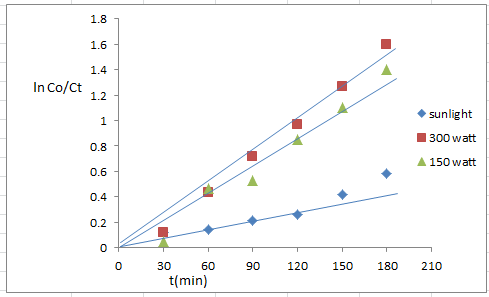 | Figure (14). Sources different of nanoparticle TiO2/CdS (0.125 g/l), 4-NT( 7*10-4)M, pH7 |
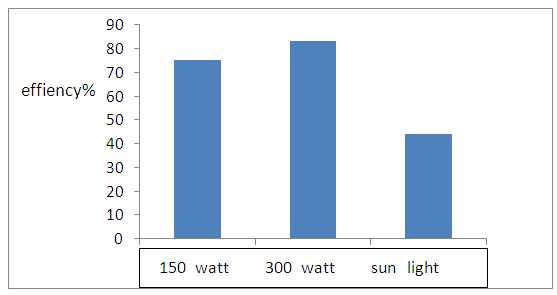 | Figure (15). Effiency of sources light of degradation 4-NT |
4. Conclusions
- In this work TiO2/CdS photocatalyst was prepared by sol-gel method and its photocatalytic activity on degradation of organic material were tested, coupling with CdS could narrow the band gap of TiO2 and the absorption to visible –light region. Particle size of TiO2/CdS (42) nm, Surface area of TiO2/CdS was (18.69) m2g-1 with average pore diameter (132.7) Ao.The photodegradation study of p-nitrotolune provides for highly efficiency method degradation of P-nitrotolune was degraded within 180 min when 0.125 gm.l-1 of TiO2/CdS nanoparticle at pH 7 under 300 watt that photocatalyst degraded products were less toxic.