American Journal of Chemistry

p-ISSN: 2165-8749    e-ISSN: 2165-8781

2016;  6(1): 12-17

doi:10.5923/j.chemistry.20160601.03


Some Physicochemical Charactistics of Bottled Drinking Water Samples

Mohamed Ezeldin1, 2

1Department of Chemistry, Faculty of Science and Technology, Omdurman Islamic University, Khartoum, Sudan

2Department of Quality Control, Almazaq Factory, South of Khartoum, Sudan

Correspondence to: Mohamed Ezeldin, Department of Chemistry, Faculty of Science and Technology, Omdurman Islamic University, Khartoum, Sudan.

Email:

Copyright © 2016 Scientific & Academic Publishing. All Rights Reserved.

This work is licensed under the Creative Commons Attribution International License (CC BY).
http://creativecommons.org/licenses/by/4.0/

Abstract

The used samples were produced from Almazaq factory Khartoum, Sudan and have been treated by chlorine ultra violet radiations and ozone gases, four samples of bottled drinking water were taken and Some “tests”, to determine physicochemical properties were carried out. pH and electric conductivity of bottled drinking water were determined according to standard methods for the examination of water and wastewater, magnesium, calcium, potassium, sodium , aluminum, sulfate, chloride, phosphate, nitrate and nitrite were determined by Ion Chromatography (IC). The results obtained were compared with parameters of drinking water recommended by the International Bottled Water Association (IBWA), United States Food and Drug Administration (FDA), United States Environmental Protection Agency (EPA) and the World Health Organization (WHO) drinking water standard. All obtained results were found within the right permissible ranges.

Keywords: Bottled drinking water, Physical characteristics of water, Chemical characteristics of water

Cite this paper: Mohamed Ezeldin, Some Physicochemical Charactistics of Bottled Drinking Water Samples, American Journal of Chemistry, Vol. 6 No. 1, 2016, pp. 12-17. doi: 10.5923/j.chemistry.20160601.03.

1. Introduction

According to the International Bottled Water Association (IBWA), [1] drinking water has become extremely popular with a current U.S. market of more than 11 billion American dollars. Its consumption has tripled in the past 10 years, making it the second largest beverage product consumed, behind soft drinks. USA consumption in the year 2006 was 32 billion liters compared to 20 billion liters in the year 2001. The average number of liters consumed by person per year in the USA is 90.5 and the global average is 24.2 liters. Such tremendous growth in the bottled water industry is presumably a result of people’s demand for of pure, safe, better taste, convenience, and increasing public awareness of fitness and beneficial effects of drinking water on health. More than half of Americans drink bottled water, and approximately one-third of the public consumes it regularly. [2] Bottled water is regulated by the International Bottled Water Association (Alexandria, Virginia). However, regulations are less stringent compared to U.S. Environmental Protection Agency (U.S. EPA) regulations for tap water. [3, 4] Bottled water is considered a food product and is also regulated by the Food and Drug Administration (FDA) (Rockville, Maryland). All bottled water products must comply with FDA’s quality standards, labeling regulations, and Good Manufacturing Practices. [1, 4] Recently, an increasingly worldwide concern about the quality of bottled water regarding their chemical contents has risen. [5-9] Water quality can be measured by means of its concentration in organic and inorganic chemicals. As part of our ongoing research on the assessment of human exposure to toxic chemicals, chemical, physical and microbial evaluations of local bottled drinking water were conducted. This paper discusses the levels of some physicochemical of different four bottled drinking water samples produced from Almazaq water factory Khartoum, Sudan.

2. Methodology

2.1. Samples Collection

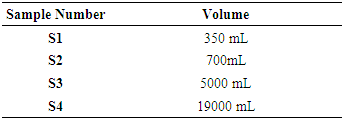
Four bottles of bottled drinking water were purchased randomly from different supermarkets in Khartoum, Sudan, during the summer of 2015. All samples were in plastic containers with plastic screw caps. Table 1 presents the classification of the bottled water samples in terms of brands, types, sources and volumes.
Table 1. Bottled drinking water samples and it’s a volumes
     
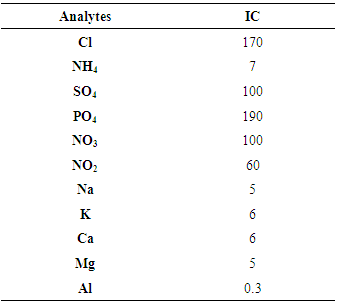
Table 2. Analytical techniques that were used for water analysis and their detection limits (µg/L)
     

2.2. PH and Electric Conductivity of Samples

About 250 mL of samples was taken and transferred into deferent four clean beakers, the PH electrode was attached to a HACK instruments model (2432 PH and conductivity). Then the pH electrometer was calibrated by 4, 7 and 10 buffer solutions, the PH of samples was determined directly.
Electric conductivity was determined directly by selective electrode, used HACK instruments (2432) [22].

2.3. Ion Chromatography

Ion chromatography was carried out using a Dionex gradient HPLC system (Sunnyvale, CA) equipped with a CD20 conductivity detector. Isocratic separations of both cations and anions were performed on CS12 and AS 14 analytical columns, respectively. Dedicated guard columns and suppressor systems to either cationic or anionic analyses were also used in connection with the analytical columns. Methanesulphonic acid (20 mM) was used as the mobile phase for eluting cations, while a mixture of 3.5 mM Na2 CO3 /1.0 mM NaHCO3 was used as the mobile phase for eluting the anions. Data acquisition and instrument settings were performed by Peaknet software (Dionex, CA). Primary calibration standard solutions (1000 ppm) for ions were prepared from their ultra-pure salts. Working standard solutions were prepared from the primary solutions following proper serial dilutions. The concentrations were measured using external calibration method and the analyses were carried out in triplicate and the average values were reported. Instrument precision was determined by introducing the same quantity of one sample 10 times, then the relative standard deviation was calculated and found to be less than 8%.

3. Results and Discussion

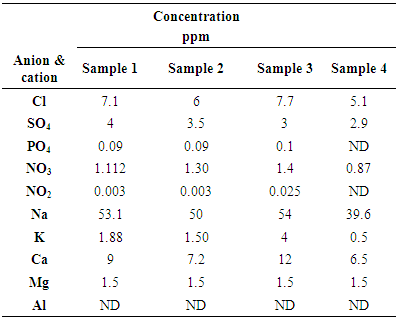
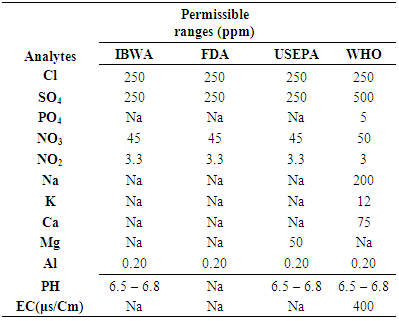
PH and electrical conductivity and concentrations of major cations and anions in bottled water samples are shown in Table 3 and Table 4. The Drinking water recommended standards set by the IBWA, FDA, EPA and the WHO are shown in Table 5.
Table 3. PH and electric conductivity of bottled drinking water samples
     
Table 4. Some chemical characteristics of bottled drinking water samples produced from Almazaq water factory
     
Table 5. Show for the maximum allowable levels of contaminants in drinking Water
     
Physical properties
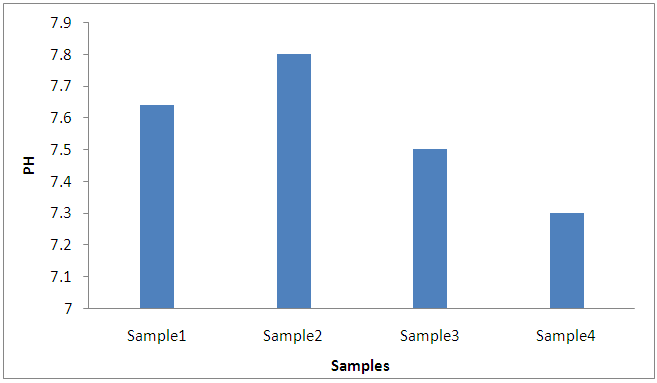
The obtained results from PH test of four samples within the recommended range (6.5 – 8.5) in table 5.
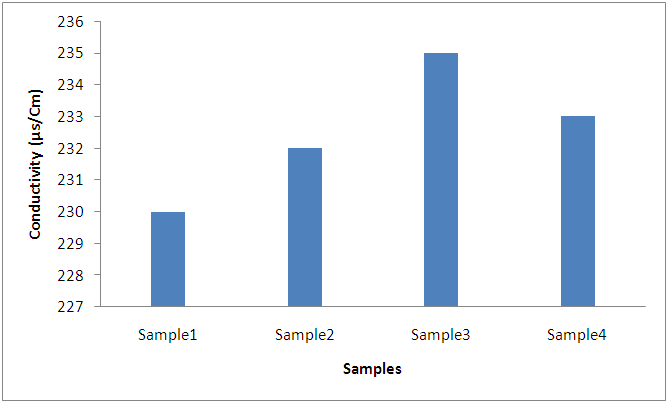
Electric conductivity (EC) generally reflects total dissolved solids in drinking water. It was found within the range assigned by FAO. An elevated TDS concentration is not a health hazard. It was regulated by WHO recommendations because it is more of an aesthetic rather than being harmful to health, the results of PH and electric conductivity were shown in figure 1 and figure 2 respectively.
Figure 1. PH of analyzed bottled drinking water samples
Figure 2. Electric conductivity of bottled drinking water samples
Anions
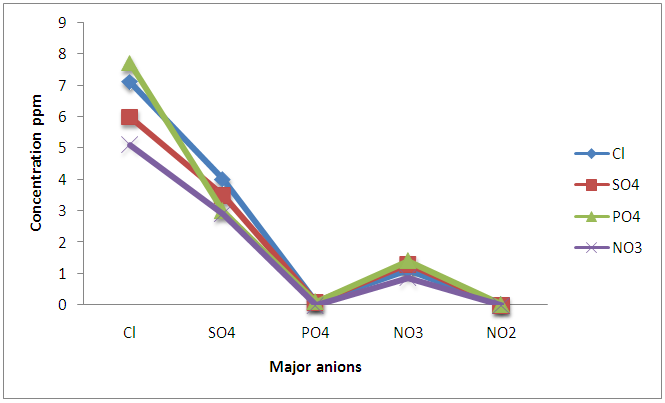
Chloride, sulfate, phosphate, nitrate and nitrite in bottled drinking water samples were analyzed by ion chromatography. The concentrations of chloride in bottled water samples was found within the permissible ranges assigned by IBWA, FDA, USEPA AND WHO. Sample 4 showed the least concentration in comparison with other three samples.
Chloride levels in excess of 250 mg/L can give rise to unpleasant taste in water, but the threshold depends on the associated cations. [27] Taste thresholds for NaCl and CaCl2 in water are in the range of 200–300 mg/L. Consumption of drinking water containing chloride is not harmful to health. High amounts of chloride can give a salty taste to water.
Concentrations of Sulfates in samples was found to be 4, 3.5, 3 and 2.9 these results within the ranges assigned by IBWA, FDA, USEPA and WHO (Table 5). Sulfate is one of the least toxic anions, the lethal dose for humans as potassium or zinc sulfate is 45 g. The major physiological effects resulting from the ingestion of large quantities of sulfate are catharsis, dehydration, and gastrointestinal irritation. No health-based assigned value for sulfate in drinking water is proposed by either WHO or EPA. However, because of the gastrointestinal effects resulting from the ingestion of drinking water containing high sulfate levels, it is recommended that health authorities be notified of sources of drinking water that contain sulfate concentrations in excess of 500 mg/L.
The concentrations of phosphates within the permissible ranges assigned by IBWA, FDA, USEPA and WHO (Table 5). Sample 4 showed the least concentration. No health-based value assigned for phosphate in drinking water is proposed by either WHO or EPA.
The concentration of Nitrate and nitrite in marked bottled water samples was found lower than permissible limits assigned by IBWA, FDA, USEPA and WHO (Table 5), sample four showed the least concentrations. contamination of drinking water with nitrate presents a health hazard, because nitrate ion can be converted to nitrite ion in the gastrointestinal tract. [29, 30] High nitrate levels can cause blue syndrome and certain forms of cancer. Scientific literature suggests that neither nitrate nor nitrite acts directly as a carcinogen in animals, but there is some concern about a possible increased risk of cancer in humans from the endogenous and exogenous formation of N-nitrosamine compounds, many of which are carcinogenic in animals. The WHO’s recommended value for nitrate in drinking water is established solely to prevent methemoglobinemia, which depends on the conversion of nitrate to nitrite. The results of anions concentration in used bottled samples was shown in figure 3.
Figure 3. The concentration of major anions in Bottled drinking water samples
Cations
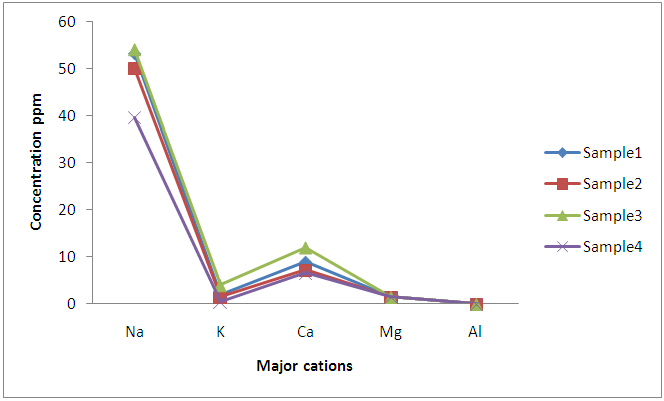
Sodium, potassium, magnesium and calcium concentrations in the bottled water samples were analyzed by ion chromatography as shown in the experimental section. The results are shown in Table 4 and figure 4.
Figure 4. The concentration of major cations in bottled drinking water
The sodium concentrations of bottled sample1, 2,3 and 4 was found to be 53.1, 50, 54 and 39.6 respectively, these results are lower than the limit assigned by WHO but not limits of sodium concentrations assigned by the IBWA, FDA and USEPA. None of the values exceeded the sodium maximum limit of 200 mg/L (Table 5) guidelines for aesthetic quality. Most water contains some sodium, which naturally leaches from rocks and soils. An excess of sodium more than 200 mg/L in drinking water may cause a salty taste or odor, as well as presenting long-term health effects like. [25].
Potassium concentration of bottled water sample 1, 2, 3 and 4 were found to be 1.88, 1.50, 4 and 0.5 respectively, sample 4 showed a lower by potassium content. The obtained potassium concentrations within the permissible range assigned by WHO.
Calcium concentrations of bottled samples in Table 4 were found within the permissible rang assigned by WHO. Natural water sources typically contained concentrations of up to 10 mg/L for calcium. However, levels up to 800 mg/L were found in natural water. [26] The threshold for the calcium ion is in the range 100 to 300 mg/L, depending on the associated anion, but higher concentrations are acceptable to consumers. Hardness levels above 500 mg/L are generally considered to be aesthetically unacceptable, although this level is tolerated in some communities. [27] Calcium is one of the major elements responsible for water hardness. Water containing less than 60 mg/L of Ca is considered as soft water. There does not appear to be any convincing evidence that water hardness causes adverse health effects in humans. In contrast, the results of a number of epidemiological studies have suggested that water hardness may protect against disease. [25].
Magnesium and aluminum concentrations of bottled drinking water samples in Table 4 were lower than permissible range assigned by marked organizations but the IBWA, FDA and WHO would not set limits for magnesium concentrations in drinking water. All Physicochemical characteristics within the limits of detection show in Table 2.

4. Conclusions

Based on the previously discussed analyses, the following conclusions can be summarized as.
Ÿ Four samples of bottled drinking water samples produced from Almazaq bottled drinking water were purchased randomly from different supermarkets in Khartoum, Sudan, during the summer of 2015. The water produced from Almazaq factory have been treated by chlorine, ultra violet radiations and ozone gases.
Ÿ PH and Electric Conductivity (EC) were found within the recommended range assigned by IBWA, USEPA and WHO.
Ÿ The major anions and cations included chloride, sulfate, phosphate, nitrate, nitrite, sodium, potassium, calcium, magnesium and aluminum were analyzed by Ion Chromatography (IC).
Ÿ The obtained results from analysis of anions and cations in marked bottled drinking water samples were lower than limits recommended by IBWA, FDA, USEPA and WHO.

ACKNOWLEDGEMENTS

Special thanks to Mr. Osman Ahmed Osman Vice chancellor of Almazaq water factory, prof. Hatel H. Alkamali, Dean of faculty of science and technology, Omdurman Islamic university. Special thanks also expressed to prof. Mohamed hamaad, Dr. Ali Mohamed Masaad, Mr. Omar Abdalhameed Goda and all staff at water and environment laboratory in Central Petroleum Laboratories (CPL).

References

[1]  IBWA International Bottled Water Association, Alexandria, VA 22314, 2004.
[2]  Natural Resources Defense Council (NRDC) New York, NY10011, March 1999.
[3]  U.S. Environmental Protection Agency. Providing Safe Drinking Water in America. National Public Water System Annual Compliance Report and Update on Implementation of the 1996 Safe Drinking Water Act Amendments, Executive Summary. U.S. Environmental Protection Agency, Washington, DC, September, 1996.
[4]  Food and Drug Administration, The FDA Bottled Water Regulations. Code of Federal Regulations, Parts 129 and 165, Title 21; Food and Drug Administration: Rockville, Maryland, 1997.
[5]  Soupioni, M.J.; Symeopoulos, B.D.; Papaefthymiou, H.V. Determination of trace elements in bottled water in Greece by instrumental and radiochemical neutron activation analyses. J. Radioanal. Nucl. Chem. 2006, 268(3), 441–444.
[6]  Batarseh, M.I. The quality of potable water types in Jordan. Environ. Monitor. Assess. 2006, 117, 235–244.
[7]  Momani, K.A. Chemical assessment of bottled drinking waters by IC, GC, and ICP-MS instrumentation. Sci. Technol. 2006, 34, 587– 605.
[8]  Raj, S.D. Bottled water: How safe is it? Water Environ. Res. 2006, 77(7), 3013–3018.
[9]  Saleh, M.; Ewane, E.; Jones, J.; Wilson, B. Chemical evaluation of commercial bottled drinkingwater from Egypt. J. Food Comp. Anal. 2001, 14, 127–152.
[10]  Lalumandier, J.A. Fluoride and bacterial content of bottled water vs. tap water. Arch. Fam. Med. 2000, 9, 246–250.
[11]  Armas, A.B.; Sutherland, J.P. A survey of the microbiological quality of bottled water sold in the UK and changes occurring during storage. Int. J. Food Microbiol. 1999, 48, 59–65.
[12]  Warburton, D.; Harrison, B.; Crawford, C.; Foster, R.; Fox, C. A further review of the microbiological quality of bottled water sold in Canada: 1992–1997 survey results. Inter. J. Food Microbiology, 1998, 39, 221–226.
[13]  Schindler, P.R. Enterobacteria in mineral, spring and table water. Gesundheitswesen 1994, 56, 690–693.
[14]  Rivera, F.; Glavan, M.; Robles, E. Bottled mineral waters polluted by protozoa in Mexico. J. Protozool. 1981, 28, 54–56.
[15]  Salazar, H.C.; Moura, H.; Ramos, R.T. Isolation of free-living amoebas from bottled mineral water. Rev. Saude Publica. 1982, 16, 261– 267.
[16]  Caroli, G.; Levre, E.; Armani, G.; Biffi-Gentili, S.; Molinari, G. Search for acid-fast bacilli in bottled mineral waters. J. Appl. Bacteriol. 1985, 58, 461–464.
[17]  Papapetropoulou, M.; Tsintzou, A.; Vantarakis, A. Environmental mycobacteria in bottled table waters in Greece. Can. J. Microbiol. 1997, 43, 449–502.
[18]  Hunter, P.R.; Burge, S.H.; Hornby, H. An assessment of the microbiological safety of bottled mineral waters. Rivista Italianad Igiena 1990, 50, 394–400.
[19]  Warburton, D.W. A review of the microbiological quality of bottled water sold in Canada. Part 2. The need for more stringent standards and regulations. Can. J. Microbiol. 1993, 39, 158–168.
[20]  Warburton, D.W.; Bowen, B.; Konkle, A. The survival and recovery of Pseudomonas aeruginosa and its effect upon salmonellae in water: methodology to test bottled water in Canada. Can. J. Microbiol. 1994, 40, 987–992.
[21]  Kerr, M.; Fitzgerald, M.; Sheridan, J.J.; McDowell, D.A.; Blair, I.S. Survival of Escherichia coli O157:H7 in bottled natural mineral water. J. Appl. Microbiol. 1999, 87, 833–841.
[22]  Standard Methods for the Examination of Water and Wastewater, 21th ed. American Public Health Association (APHA), American Water Works Association (AWWA) & Water Environment Federation (WEF), 2005.
[23]  Martin, T.D.; Martin E.R. Method 200.8, Revision 5.4, U.S. Environmental Protection Agency: Washington, DC, 1996.
[24]  Reasoner, D.J. Heterotrophic plate count methodology in the United States. Int. J. Food Microbiol. 2004, 92, 307–315.
[25]  Derry, C.; Bourne, D.; Sayed, A. The relationships between the hardness of treated water and cardiovascular disease mortality in South Africa urban areas, S Africa Med. J. 1990, 77, 522–524.
[26]  Al-Redhaimen, K.; Abdel-Magid, H. Magnesium and other elements and cardiovascular disease. Water Air Soil Pollut. 1985, 137, 235–246.
[27]  Zoeteman, B.C.J. Sensory Assessment of Water Quality. In Pergamon Series on Environmental Science Volume 2. Pergamon Press, Exeter, UK.1980, 189–210.
[28]  Hardisson, A.; Rodriguez, M.; Burogs, A.; Diaz Flores, L.; Gutierrez, R.; Varela, H. Fluoride levels in publicly and bottled drinking water in the island of Tenerife, Span. Bull. Environ. Contam. Toxicol. 2001, 67, 163–170.
[29]  Guidelines for Canadian Drinking Water Quality, Supporting Documentation- Lead; Department of National Health and welfare (Canada): Ottawa, 1978.
[30]  Alabdulaaly, A. Nitrate concentrations in Riyadh drinking water supplies. Environ. Monit. Assess. 1997, 47, 315–324.
[31]  Food and Drug Administration, What Americans are drinking in 2002. Food and Drug Administration: Washington, DC (2002).