-
Paper Information
- Next Paper
- Previous Paper
- Paper Submission
-
Journal Information
- About This Journal
- Editorial Board
- Current Issue
- Archive
- Author Guidelines
- Contact Us
American Journal of Chemistry
p-ISSN: 2165-8749 e-ISSN: 2165-8781
2015; 5(1): 10-18
doi:10.5923/j.chemistry.20150501.02
Spectroscopic Investiqation Complex Formation of Vanadium Using 2,6-Dithiolphenol and Hydrofob Amins
 Abstract
 Reference
 Full-Text PDF
 Full-text HTML
Kerim A. Kuliyev, Naila A. Verdizade
Department of Chemistry, Azerbaijan State Pedagogical University, Baku, Azerbaijan
Correspondence to: Kerim A. Kuliyev, Department of Chemistry, Azerbaijan State Pedagogical University, Baku, Azerbaijan.
| Email: |  |
Copyright © 2015 Scientific & Academic Publishing. All Rights Reserved.
Mixed-ligand complexes of Vanadium (IV, V) with 2,6-dithiolphenol (DTP) and hydrofob amins have been studied by spectrophotometry. Extraction of mixed ligand complexes is maximal at pH 3.5-4.9. The optimal conditions for the formation and extraction of mixed-ligand compounds have been found and the ratios of components I the complexes have been determined. The Beer’s law was applicable in the range of 0.05-16g/ml. The method is free from common interferences. A procedure has been developed for extraction – spectro-photometric determination vanadium in soils andin oil and oil-products.
Keywords: Extraction-spectrophotometric Method, Vanadium, 2,6-dithiolphenol (DTP), Hydrofob amins (Am), Mixed-ligand complexes
Cite this paper: Kerim A. Kuliyev, Naila A. Verdizade, Spectroscopic Investiqation Complex Formation of Vanadium Using 2,6-Dithiolphenol and Hydrofob Amins, American Journal of Chemistry, Vol. 5 No. 1, 2015, pp. 10-18. doi: 10.5923/j.chemistry.20150501.02.
Article Outline
1. Introduction
- A great variety of photometric reagents is known for the determination of vanadium. However, the studies aiming to find and investigate new photometric reagents with different functional groups are still going on.The very sensitive, fairly selective direct spectrophotometric method for the determination of trace amount of V(V) with naphthalene -1, 5 -diamine has been developed. The method was successfully applied in the determination of vanadium in environmental, and biological samples [1].Novel, rapid, highly sensitive and selective spectrophotometric method for the determination of traces of V (V) in environmental and biological samples, pharmaceutical and steel samples was studied. The method is based on oxidation of 2,4- dinitro phenyl hydrazine (2,4-DNPH) by V (V) followed by coupling reaction with N-(1-naphthalene-1-yl)ethane-1,2-diamine-dihydrochloride (NEDA) in acidic medium to give red colored derivative or onoxidation of 4-Amino Pyridine by V (V) followed by coupling reaction with NEDA in basic medium to give pink colored derivative [2]. Several kinetic methods based on its catalytic action on the oxidation of organic compounds have been reported in literature [3-5]. The bromates have been extensively used as the oxidizing agents [4, 5], although hydrogen peroxide and potassium chlorate have also been used for the same purpose [6]. In the present paper, a simple and sensitive metod is proposed for V (IV) determination in the presense of V (V). This is based on the oxidation of V (IV) present in the sample to V(V) by addition of Fe (III) cation, followed by a complexation reaction of Fe (III) with the spectrophotometric reagent2-(5-bromo-2-pyridylazo)-5-diethylaminophenol (Br-PADAP) [7].In scrutiny of literature reveals that several spectrophotometric methods have been reported for the determination of vanadium in environmental and biological samples. Recently, few authors introduced various reagents for spectrophotometric determination of Vanadium in various samples such as2-(2-quinolylazo)-5-diethylaminophenol [8], variamineblue [9], cryamine R [10], Benzylacetate [11], pyrogallol [12],2-(8-quinolylazo)-5-dimethylaminopheno [13], 2-hydroxyacetophenone [14], 4-(2-pyridylazo) resorcinol [15], tannicacid [16],2-(5-chloro-2-pyridylazo)-5-dimethylaminophenol [17] andN,N’-bis(2-hydroxyl-3-sulfopropyl)-tolidine [18].Oxyphenolate complexes of Vanadium are insoluble in chloroform, while mixed-ligand complexes with hydrophobic amines and aminophenols easily dissolve in various organic solvents [19-21]. In this respect, a very promising reagent is 2,6-dithiolphenol (DTP), which contains one hydroxyl and two sulfohydryl groups and is a sulfur-containing analogue of mononuclear polyphenols with two oxygen atoms replaced with sulfur atoms.The present study is concerned with the investigation of V (IV, V) interaction with 2,6-Dithiolphenol (DTP), rsulting in the formation o colored complexes insoluble in nonpolar solvents. Experiments on electromigration in a U-shaped tube and on sorption on EDE-10P (EDE- ethylenediamine, epichlorohydrin; 10- serial number of the brand: P- means that the matrix has a macroporous structure) anion exchangers have demonstratedthe anionic nature of single-ligand complexes, in the eectromigration study of the complexes, it was found that the blue-green dithiophenolate complexes of Vanadium (IV, V) moved to the cathode. When the sign of the charge of the single-ligand complexes was determined by ion chromatography, the EDE-10P anion exchanger completely absorbed the colored component of the solution. When hidrophob amins (Am) were introduced into the system, the extraction of these compounds into the organic phase as a mixed-ligand complex (MLC) was observed among hydrophob amins, o-tolydine (o-tol), m-tolydine (m-tol) and p-tolydine (p-tol) were used. Based on these data, new selective and highly sensitive procedures were developed for the extraction-spectrophotometric determination of trace vanadium in soils in and oil and oil-products.
2. Experimental
2.1. Instruments
- The absorbance of the extracts was measured using a KFK-2 photocolorimeter and an SF-26 spectrophotometer; the equilibrium value of the pH of aqueous phase was measured using a I-120.2 potentiometer with a glass electrode. ESR spectra of solutions of mixed-ligand complexes were registered on a JEOS-JES-PE-3X spectrometer (Japan) with working a frequency of 9400 MHz. IR - spectra were recorded on a spectrophotometer UR-20.
2.2. Reagents and Solutions
- Stock solutions (1.96x10⁻²M) of V (IV, V) were prepared from chemically pure salts VOSO4 x 3H2O and NaVO3 x 2H2O. The working solutions with concentration 0.1 mg/mL were obtained by the dilution of the stock solutions. The concentration of solutions of Vanadium (V) and vanadium (IV) was determined by titration with iron (II) salts and potassium permanganate, respectively [22]. Solutions of DTP and Am in chloroform (0.01M) were used. To create the optimal acidity, 0.1M solutions of KOH and HCl were used. The extractant was purified chloroform.
2.3. General Procedure
2.3.1. General Procedure for the Determination of Vanadium (IV, V)
- Portions of stock solutions of Vanadium (IV, V) varying from 0.1 to 1.0 mL with a 0.1-mL step, a 2.5 –mL portion of a 0.01 M solution of DTP, and a 2.0 mL portion of a 0.01M solution of Am were placed in to calibrated test tubes with ground-glass stoppers (the volume of the organic phase was 5 mL). The required value of pH was adjusted by adding 0.1M HCl. The volume of the aqueous phase was increased to 20 mL using distilled water. In 10 minnute after the complete separation of the phases, the organic phase was separated from the aqueous phase and the absorbance of the extracts was measured on KFK-2 at room temperature and 590 nm (l=0.5cm).
2.3.2. Determination of Vanadium in Soils
- The proposed procedures for the determination of Vanadium were applied to its determination in light-chestnut soil from the Caspian zone. A 0.5-g weight was finely ground in an agate mortar and calcined in muffle furnace for 3 h. after cooling, the sample was treated and dissolved in a graphite cup in a mixture of 16 mL of conc. HF, 5mL of conc. HNO3, and 15 mL of conc. HCl at 50-60℃, to remove excess hydrogen fluoride, a 8 mL portion of conc. HNO3 was added triply to the solution that was each time evaporated to 5-6mL. After that, the solution was transferred into a 100 mL volumetric flask and its volume was brought to the mark with distilled water. Vanadium was determined in aliquot portions of the solution using the proposed procedures.
2.3.3. Determination of Vanadium in oil and Oil-Products of Baku
- For this purpose, we took a china cup (9 cm diameter) of used fuel (40g) and bumed it. Twenty grams of fuel oil or 10 grams of hydron (±0.0001g) were used. The China cup was heated at 500±20℃ for one hour. After cooling 5 mL of HCl(1:1), 2 mL of fuel, and 0,5g Na2CO3 without water was added to the cup and warmed. The cup was heated for 2 to 3 minutes in an oven at 800℃. After cooling 5 mL of distilled water was added to the mass in the cup. It was poured twice through the same filter into a 50-mL graduated cylinder to a volume of 15mL. We then added a little vanadyl-sulphate with 10 mkg of vanadium, 2-3 mL of concentrate HCl and corrected the volume with distilled water. To a given quantity of this solution, we added 0.5 g of thiocarbamide, 3 mL of 0.01 M DTP and 2.0 mL of 0.01 M Am. After shaking we increased the volume of solution to 25 mL with distilled water. We separated the organic-phase from the water-phase and sured the optical absorbency of the extract at 590 nm using the CFC-2. The concentration of Vanadium was determined and corrected statistically.
3. Results and Discussion
- In weakly acid and neutral media (pH 1.2-7.0) V (IV, V) forms with DTP a blue compound soluble in water. When the concentration of the reagent and pH were increased, the color became more intense. Being organic cations, hydrophob amins under certain conditions in acid media form intensely colored MLC with the acidocomplexes of V (IV, V). The formed complexes are extractable with organic solvents.
3.1. The Choice of the Extractant
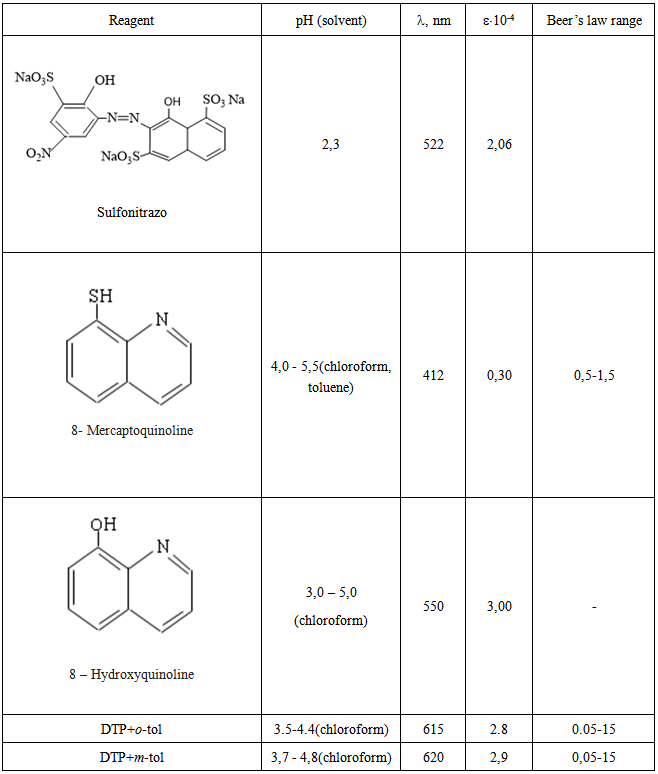
- For the extraction of complexes we used chloroform, tetrachloromethane, benzene, toluene, xylene, isobutanol, isopentanol, and dichlorethane. The extractivity of the complexes was estimated by the distribution coefficient and recovery. Chloroform, dichloroethane, and chloro-benzene appeared to be the best extractants. All the further investigations were carried out with chloroform. The concentration of vanadium in the organic phase was determined with 8-hydroxyquinoline [23] by photometric measurements after back extraction, while in the aqueous phase it was determined by the difference. The basicity of AP hardly influences the recovery of vanadium. After a single extraction with chloroform, 98.2-98.8% of vanadium was extracted was extracted as an ion associate.
3.2. Influence of the pH of the Aqueous Phase
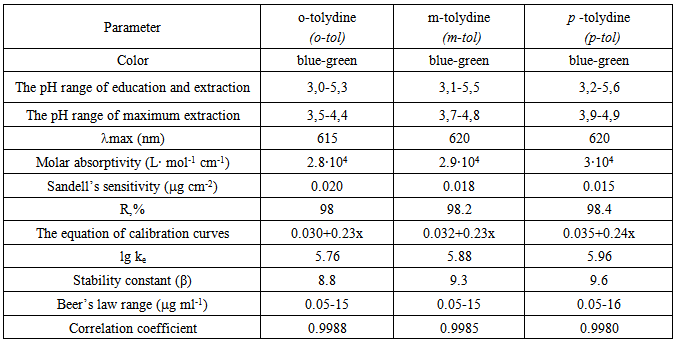
- The effect of pH on the intensity of the color reaction is shown in the Fig. 1. The absorbance was found to be maximum in the pH range 3,5-4,9. Hence further analytical investigations were carried out in media of pH 4. Extraction of V(IV,V) enhanced with the increase in the acidity of the initial solution; the further increase in acidity lead to the gradual decrase of recovery, which was obviously associated with a decrease in the concentration of the ionized form of DTP. Probably, it is present in the solution in the non-dissociated state. At pH ≥ 7, the complexes were hardly extracted, obviously because of the decrease in the degree of Am protonation (Fig.1).
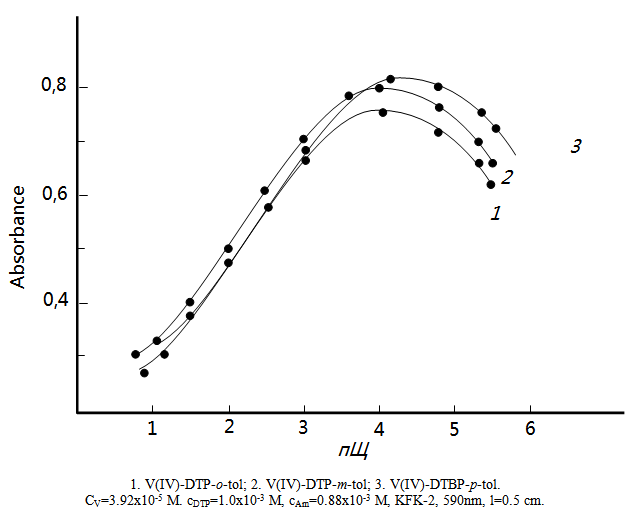 | Figure 1. Absorbance of mixed-ligand complexes as a function of the pH of the aqueous phase |
3.3. Influence of Reagent Concentration and Incubation Time
- For the formation and extraction of MLC, a 20-25-fold excess of complexing reagents is required; for example, the optimal conditions for formation and extraction of these compounds are provided by (1.0-1.2)x10-3 M DTP and (0.80-0.88)x10-3 M Am. A large excess of hydrophob amin interferers with the determination. However it was found that the presence of excess of the reagent solution does not alter the absorbance of the color reaction. Unlike single-ligand complexes, mixed-ligand complexes of V (IV, V) with DTP and Am were stable in aqueous and organic solvents and did not decompose for two days, or over a month after extraction. The required duration of the phase contact was 10 min. the system obeyed the Beer’s law in the range 0.05-16 mg/mL of vanadium.
3.4. Electronic Absorption Spectra
- Neither the metal ion nor the reagent has appreciable absorbance at specified wavelengths. Hence further studies were carried out at 615-620 nm (fig.2). The molar absorption coefficient was (2.8-3.0)x104 L· mol-1 cm-1.
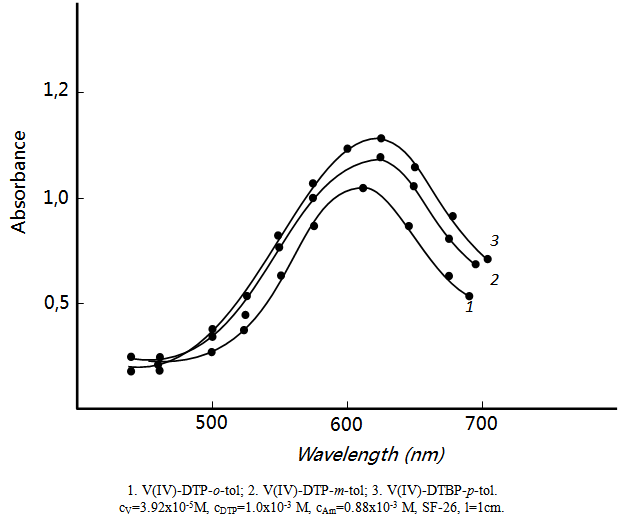 | Figure 2. Absorption of mixed-ligand complexes |
3.5. Stoichiometry of the Complexes and the Mechanism of Complexation
- It was found using the Nazarenko method that V(IV) in the complexes was present in the form of VO2+. The number of protons replaced by vanadium in one DTBP molecule appeared to be one [24, 25].It was found that the spectrophotometric characteristics of the MLC of V (IV) and V (V) were identica, i.e., in the interaction with DTP, V(V) was reduced to V(IV) and VO2+ was the complex –producing form. This fact was also confirmed by ESR spectrometry [26]. V(V) does not have unpaired electrons and is diamagnetic, while V(IV) has one d electron and exhibits electron paramagnetic absorption. According to the value of the nuclear spin j=7/2, the ESR spectra of V (IV) consisted of eight lines with the hyperfine structure associated with the interaction of the magnetic moment of an unpaired electron with the magnetic moment of the 51V nucleus. Hyperfine structure consisting of 8 lines was observed in the ESR spectra of choloroform extracts of MLC from aqueous solutions of V(IV) and V(V) salts. Consequently, the interaction of V(IV) and V(V) salts. Consequently, the interaction of V(V) with DTP involved its reduction to V(IV). The results of the studies are presented in fig.3.
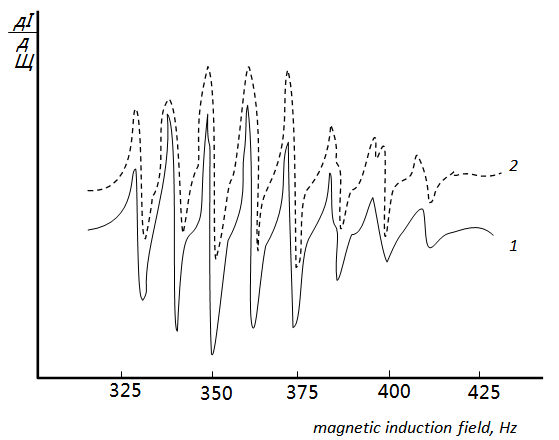 | Figure 3. Hyperfine splitting of the paramagnetic resonance line in solutions: (1) V(IV)-DTP-o-tol and (2) V(V)-DTP-o-tol |
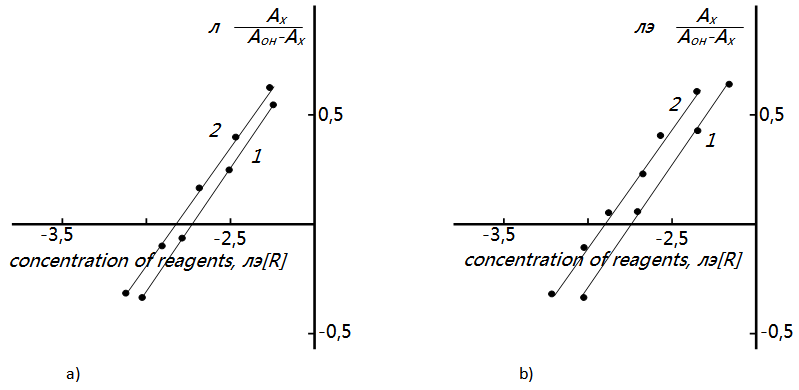 | Figure 4. Determination of the ratio of components by the equilibrium shift method for (a) V(II)-DTP-o-tol and (b) V(IV)-DTP-m-tol. 1- V:DTP; 2- V : Am.  M. SF-26, l=590nm, l=1cm M. SF-26, l=590nm, l=1cm |
 . The disappearance of a distinct strip at 2580 sm-1, observed in ranges DTP and emergence spectrum of complexes of two strips of absorption one of which is displaced towards smaller frequencies, says that one of the sulfhydryl groups participates in formation of a complex. Observed reduction of intensity of a strip of absorption in area 3200-3600sm-1 with a maximum at 3450sm-1, emergence of a wide strip in area 3000-3100sm-1 shows that the hydroxyl group takes part in formation of coordination communication in the ionized state. Detection of strips of absorption at 1380 cm-1 indicates availability of the protonated tolidine [28, 29].Structure extractable complexes can be represented as in Figure 5.
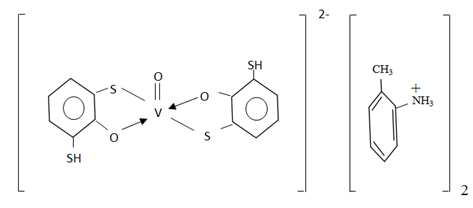 | Figure 5. Structure of complex |
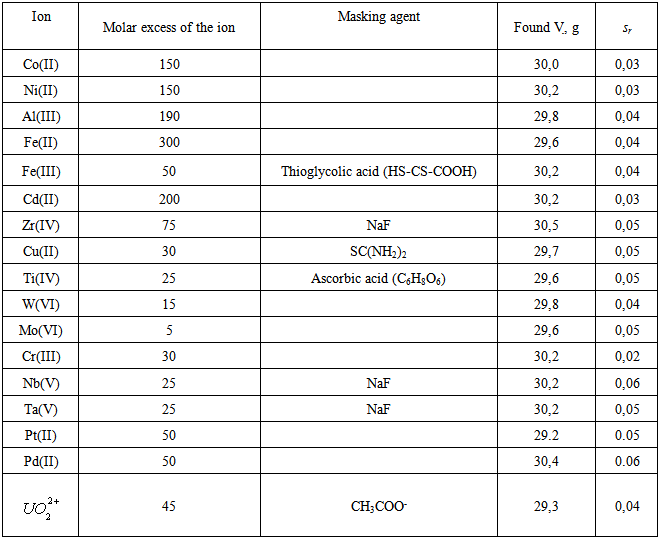
3.6. Influence of Interfering Ions
- Large amounts of alkali and alkaline-earth metals and REE do not interfere with the determination of vanadium. The interference of Fe(III) was eliminated by thiogycolic acid or 20% solution of SnCl2; Cu(II), Cr(VI), and Mn(VII) were masked by thiourea; Ti(IV), ascorbic acid; and Zr(IV), Nb(V), and Ta(V), by fluoride ions. Ions of Mo(VI), W(VI), Ti(IV), Nb(V), and Ta(V) form with DTP and AP colored compounds and interfere with the determination of vanadium. However, these elements form complexes in more acidic medium. Since Mo(VI) an W(VI) complexes with DTP are soluble in chloroform, while complexes of V(IV) are insoluble, the latter ones are completely transferred into the aqueous phase as V-DTP. After the separation of the aqueous phase from the organic phase, vanadium was determined in the aqueous phase under optimal conditions with the addition of Am. The selectivity of the photometric determination of V(IV) with DTBP is demonstrated in Table 1. In conclusion the analytical parameters pertaining to the proposed method are given in the Table 2.
|
|
|
3.7. Effect of Vanadium (IV) Concentration
- The adherence to Beer’s law was studied by measuring the absorbance value of the series of solutions containing different concentrations of the metal ion. A linear calibration graph drawn between absorbance and the metal ion concentration indicates that V(V) may be determined in the range 0.05-16
 The pertaining calibration graph is shown in the Fig. 6.
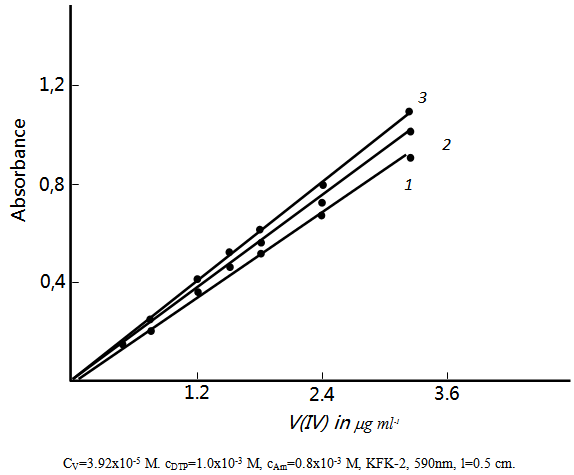 | Figure 6. Analytical determination of V (IV) |
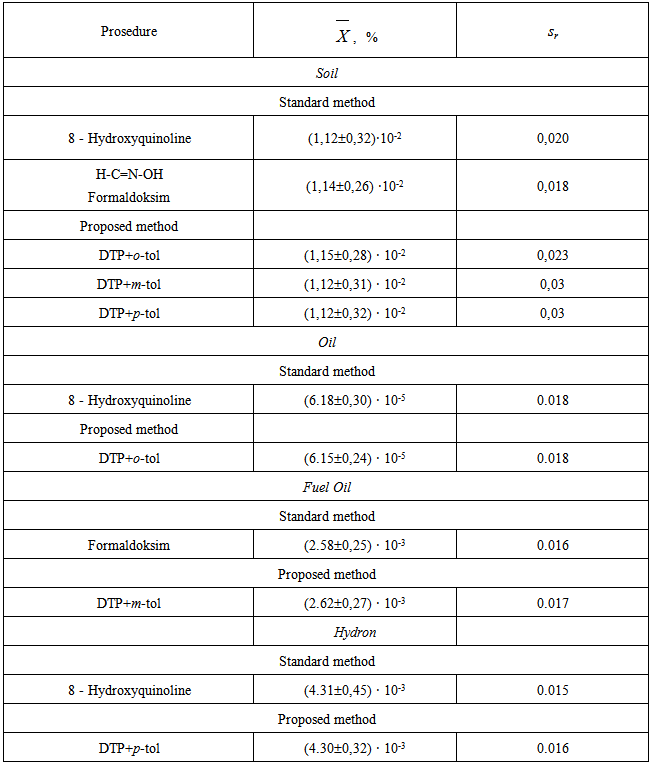
3.8. Analytical Applications
- The proposed method under the already established optimum conditions was applied for the determination of V(V) in soils and in oil and oil-products. The proposed procedures for determining Vanadium in soils were verified by 8-hydroxyquinoline and formaldoxime methods [23]. The results of the analysis are listed in Table 4 indicate the successful applicability of the proposed method to real sample analysis.
|
4. Conclusions
- Mixed-ligand complexes of Vanadium (IV, V) with 2,6-dithiolphenol and hydrofob amins have been studied by spectrophotometry. Extraction of mixed ligand complexes is maximal at pH 3.5-4.9. The optimal conditions for the formation and extraction of mixed-ligand compounds have been found and the ratios of components I the complexes have been determined. A procedure has been developed for extraction –spectrophotometric determination Vanadium in soils and in oil and oil-products.