| [1] | Akintunde N. A. (2012). Fish Species Diversification in Aquaculture for the Success of the Agriculture Transformation Agenda: The Role of Tilapia Production, Fisheries Society of Nigeria, Annual Public Lecture. |
| [2] | FAO (2012). The state of world review of fisheries and aquaculture. Part 1.www.fao.org/docrep/016/i2727e/i2727e01.pdf |
| [3] | International Council for the Exploration of the Sea, ICES (2001). Working group on the assessment of mackerel, horse mackerel, sardine and anchovy. ICES C. M. 2001/ACFM: 6. www.archimer.ifremer.fr/doc/00112/22335/20007.pdf |
| [4] | Uzairu A., Harrison G. F. S., Balarabe M. L. And Nnaji J. C. (2009). Concentration levels of trace metals in fish and sediment from Kubanni River, northern Nigeria. Bull. Chem. Soc. Ethiop. 23, (1): 9 - 17. |
| [5] | Yilmaz Fevzi (2009). The comparison of heavy metal concentrations (Cd, Cu, Mn, Pb, and Zn) in tissues of three economically important fish (Anguilla Anguilla, Mugil Cephalus and Oreochromis Niloticus) inhabiting Koycegiz Lake-Mugla (Turkey). Turkish Journal of Science Technology, 4, (1): 1 – 15. |
| [6] | Oluyemi, E. A. and Olabanji I. O. (2011). Heavy metals determination in some species of frozen fish soldat Ile-Ife main market. Ife Journal of Science, 13, (2): 86 - 93. |
| [7] | Hayat S. and Javed M. (2008). Regression studies of planktonic productivity and fish yield with reference to physico-chemical parameters of the ponds stocked with sub-lethal metal stressed fish. Int. J. Agric. Biol., 10, (2): 561 - 565. |
| [8] | Khare S. and Singh S. (2002). Histopathological lessons induced by copper sulphate and lead nitrate in the gill of freshwater fish nundus, J. Ecotoxicol. Environ. Mar. Pollution. Bulletting, 6, (3), 5760 - 5760. |
| [9] | Aderinola O. J, Clarke E. O., Olarinmoye O. M., Kusemiju V. and Anatekhai M. A. (2009). Heavy metals in surface water, sediments, fish and perwinkles of Lagos lagoon. American-Eurasian J. Agric. and Environ. Sci., 5, (5): 609 - 617. |
| [10] | Canli M., and Atli G., (2003). The relationships between heavy metal (Cd, Cr, Cu, Fe, Pb, Zn) levels and the size of six mediterranean fish species. Environ. Pollut. 1, (21): 129 – 136. |
| [11] | Simon K. D., Bashir F. H., Othman M. S., Mazlan A. G. And Rahim S. M. (2013). Heavy metal concentration in fishes from the coastal waters of Kapar and Mersing, Malaysia. Turkish Journal of Fisheries and Aquatic Sciences 13: 375 - 382. http://dx.doi:10.4194/1303-2712-v13_2_21 |
| [12] | Mieiro C. L., Coelhoaj P., Pachecom. P., Duarte A. C. and Pereira M. E. (2012). Trace elements in two marine fish species during estuarine residency: Non-essential versus essential. Marine Pollution Bulletin.http://dx.doi.org/10.1016/j.marpolbul.2012.08.033 |
| [13] | Brown F. M. J., Balls, P. W., (1997). Trace metals in fish and shellfish from Scottish waters. Scottish Fisheries Research Report Number 60. The Scottish office agriculture, environment and fisheries department, pp. 1 – 37. |
| [14] | Yilmaz A. B. (2003) Levels of heavy metals (Fe, Cu, Ni, Cr, Pb And Zn) in tissue of Mugil Cephalus and Trachurus Mediterraneus from Iskenderun Bay, Turkey. Environ Res 92: 277-281 |
| [15] | Hajeb P., Jinap S., Ismail A., Fatimah A. B., Jamilah B., and Abdul Rahim B. (2009). Assessment of mercury level in commonly consumed marine fishes in malaysia. Food Control, 20, 79 - 84.http://dx.doi:10.1016/J.Foodcont.2008.02.012 |
| [16] | Laila D. L. Wahidu Z. And Tajul A. Y. (2013). Effect of chilled-frozen storage on the physic-chemical, microbial and sensory quality of farmed bighead carp (Hypophthalmichthys Nobilis). Journal of Fisheries and Aquatic Science, 2, (3): 1 – 7. http://dx.doi:10.3923/jfas.2013 |
| [17] | FAO (2003). Heavy metals regulations: part 1. Legal Notice No. 66. www.faolex.fao.org/docs/pdf/eri42405.pdf |
| [18] | Baker R. F., Blanchfield P. J., Paterson M. J., Flett R. J., and Wesson L. (2004). Evaluation of non-lethal methods for the analysis of mercury in fish tissue. Trans. Am. Fish Soc., 1, (33): 568 - 576. |
| [19] | Rosseland B. O., Massabuau J. C., Grimalt J., Hofer R., Lackner R., Raddum G., Rognerud S. and Vives I. (2001). Fish ecotoxicology, The EMERGE fish sampling manual for live fish. The EMERGE Project (European Mountain Lake Ecosystems: Regionalisation, Diagnostic and socio-economic valuation).http://www.mountain-lakes.org/emerge/methods/29.pdfl |
| [20] | Taghipour V. and Aziz S. N. (2010). Determination of trace elements in canned Kilka fish marketed in Islamic Republic of Iran. World Appl. Sci. 9, (6): 704 - 707. |
| [21] | Sajjad Khan, Robina Farooq, Shagufta Shahbaz, Mohammad Aziz Khan and Maria Sadique (2009). Health risk assessment of heavy metals for population via consumption of vegetables. World Applied Sciences Journal, 6, (12): 1602 - 1606. |
| [22] | Okunola O. J., Alhassan Y., Yebpella G. G., Uzairu A., Tsafe A. I. , Abechi E. and Apene S. E. (2011). Risk assessment of using coated mobile recharge cards in Nigeria. J. of Env. Chem. and Ecotoxic., 3, (4): 80 - 85. |
| [23] | USEPA (2009). United States Environmental Protection Agency, Risk-Based concentration Table. Philadelphia: United States Environmental Protection Agency, Washington, D. C. |
| [24] | USEPA (2008). Child-specific exposure factors handbook, Chapter 10 - Intake of fish and shellfish. Washington, D. C: Office of research and development. |
| [25] | Portier K., Tolson J. and Roberts S. (2007). Body weight distributions for risk assessment. Risk Analysis, 27, (1): 11- 26. |
| [26] | USEPA (2011). Exposure factors handbook: 2011 Edition. EPA/600/R-090/052F. Office of research and development, Washington, D.C. |
| [27] | Standard Operating Procedure (SOP) A03-005. (2008). Method validation in chemical analysis, Issue 3, Rev.0. Sungai Buloh: National Public Health Laboratory. |
| [28] | USEPA (2011). Data validation Standard Operating Procedure for contract laboratory programmed in inorganic data by AAS. Region 4, SOP No. QAS – SOP – 12: 1 – 35. |
| [29] | Boominathan Meena, Ramalingam Mani and Karuppiah Valivittan (2014). Metallothionein expression in marine catfish Arius Arius liver on exposure to cadmium using immunohistochemistry and western blot. Int J Pharm Pharm Sci, 6, (2): 818 – 821. |
| [30] | Rauf A., Javed M. and Ubaidullah M. (2009). Heavy metal levels in three major carps (Catla Catla, Labeo Rohita and Cirrhina Mrigala) from the river Ravi, Pakistan. Pakistan Vet. J., 29, (1): 24 - 26. |
| [31] | Canli M., Stagg R. M. and Rodger G. (1997). The induction of metallothionein in tissues of norway Lobster, Nephrops Norvegicus following exposure to cadmium, copper and zinc: the relationship between metallothionein and the metals. Environ. Pollut., 96: 343 - 350. |
| [32] | Asegbeloyin J. N., Onyimonyi A. E., Ujam O. T., Ukwueze N. N. and Ukoha P. O. (2010). Assessment of toxic trace metals in selected fish species and parts of domestic animals. Pak. J. Nutr. 9 (3): 213 – 215. |
| [33] | Muniyan M. and Ambedkar M. (2012). Analysis of heavy metals in water, sediments and selected freshwater fish collected from Gadilam River, Tamilnadu, India. International Journal of Toxicology and Applied Pharmacology, 2, (2): 25 – 30. |
| [34] | Shahat M. A., Amer O.S.O., Abdallah A.T., Abdelsater N. and Moustafa M.A. (2011). The distribution of certain heavy metals between intestinal parasites and their fish hosts in the River Nile at Assuit province, Egypt. The Egyptian Journal of Hospital Medicine, (43): 241 – 257. |
| [35] | Lopa Ghosh and Adhikari S. (2006). Accumulation of heavy metals in freshwater fish-an assessment of toxic interactions with calcium. American Journal of Food Technology, 1, (2): 139 - 148. http://dx.doi:10.3923/ajft.2006.139.148 |
| [36] | Ahmed M. S. and Bibi S. (2010). Uptake and bioaccumulation of water borne lead (Pb) in the fingerlings of a freshwater Cyprinid, Catla Catla L. The Journal of Animal and Plant Sciences, 20, (3): 201 - 207. |
| [37] | Jayakumar P. and Paul V. I. (2006). Patterns of cadmium accumulation of the catfish Clarias Batrachus (Linn.) exposed to sublethal concentration of cadmium chloride. Veterinarshki Archiv. (76): 167 – 177. |
| [38] | Fathi Alhashmi Bashir, Mohammad Shuhaimi-Othman, and Mazlan A. G. (2012). Evaluation of trace metal levels in tissues of two commercial fish species in Kapar and Mersing coastal waters, Peninsular Malaysia. Journal of Environmental and Public Health. (20): 1 - 10. http://dx.doi.org/10.1155/2012/352309 |
| [39] | Wim Verbeke, Isabelle Sioen, Karen Brunso, Stefaan De Henauw and John Van Camp (2007). Consumer perception versus scientific evidence of farmed and wild fish: exploratory insights from Belgium. Aquaculture International, 15, (2): 121 – 136. |
| [40] | Amtul Bari Tabinda, Sidra Bashir, Abdullah Yasar and Saleha Munir (2013). Heavy metals concentrations in water, sediment and fish in river sutlej at Sulemanki Headworks. Pakistan J. Zool., 45, (6): 1663 - 1668. |
| [41] | Nadeem A. Kizilbash, Nermin El-Morshedi, Ibrahim Alzahrani, Ahmed Abdeen, Abd-Allah El-Shebbly and Ahmed El-Berri (2014). Effect of heavy metal pollutants on fish population in two Egyptian lakes. International Journal of Advanced Research, 2, (1): 408 – 417. |
| [42] | Shariati F., Esmaili A. S., Mashinchian M. A. and Pourkazemi M. (2012). Metal bioaccumulation in Persian sturgeon after sublethal exposure. Int. J. Mar. Sci. Eng., 2 (1): 81 - 90. |
| [43] | Bervoets L., Knapen D., De-Jonge M., Van-Campenhout K., Blust R. (2013) Differential hepatic metal and metallothionein levels in three feral fish species along a metal pollution gradient. Plos One, 8, (3): e60805 - 6.http://dxdoi:10.1371/journal.pone.0060805 |
| [44] | Gregory G. P., James W. R. And Patrice C. (2005). Effects of- industrial metals on wild fish populations along a metal contamination gradient. Ecotoxicol Environ Safety, 61(3):287-312. |
| [45] | CCFAC (Codex Committee on Contaminants in Foods) (2011). Food Standards Programed: Joint FAO/WHO. Fifth Session, The Hague, The Netherlands; 21 – 25th March. |
| [46] | WHO (2005). Background document for development of WHO guidelines for nickel in drinking-water quality and fish. WHO/Sde/Wsh/05.08/55 English Only. |
| [47] | Yousafzai Ali Muhammad, A.R. Khan and A.R. Shakoori (2009). Trace metal accumulation in the liver of an endangered south Asian fresh water fish dwelling in sub-lethal pollution. Pakistan J. Zool., Vol. 41(1), 35 - 41. |
| [48] | Jalal K.C.A., Akbar J. B. And Habab M., Mohd A.Y. And B.Y. Kamaruzzaman B. Y. (2013). Bioaccumulation Of Selected Metals In Fresh Water Haruan Fish (Channa Striatus) Collected From Pahang River Basin, Malaysia. Orient. J. Chem., 29, (4), 1553 - 1558.http://dx.doi.org/10.13005/ojc/290436. |
| [49] | Erhan Unlu, Hulya Karadedea and Seyit Ahmet Oymakb (2004). Heavy metals in mullet, Liza Abu, and catfish, silurus triostegus, from the Ataturk dam lake (Euphrates), Turkey. Environment International, (30): 183 – 188. http://dx.doi:10.1016/s0160-4120(03)00169-7 |
| [50] | Saima Naz and Muhammad Javed (2013). Evaluation of acute toxicity of metals mixture and bioaccumulation in freshwater fish. Bioscience Methods, 4, (3): 11 - 18. http://dx.doi:10.5376/bm.2013.04.0003 |
| [51] | Vesna Poleksic, Mirjana Lenhardt, Ivan Jaric, Dragana Djordjevic, Zoran Gacic, Gorcin Cvijanovic and Bozidar Raskovic (2010). Liver, gills, and skin histopathology and heavy metal content of the Danube Sterlet (Acipenser Ruthenus Linnaeus, 1758). Environmental Toxicology and Chemistry, (29): 515 – 521. http://dx.doi:10.1002/etc.82 |
| [52] | Ezekiel Olatunji Ayotunde, Benedict Obeten Offem and Fidelis Bekeh Ada (2012). Heavy metal profile of water, sediment and freshwater cat fish, Chrysichthys Nigrodigitatus (Siluriformes: Bagridae), of Cross River, Nigeria. Rev. Biol. Trop., 60, (3): 1289 - 1301. |
| [53] | Ikem A., Egiebor, N. O. and Nyavor K. (2003). Trace elements in water, fish and sediment from Tuskegee Lake, Southeastern USA. Water, Air and Soil Pollution, 149, (4): 51 - 74. |
| [54] | Ogundiran M. A., Adewoye S. O., Ayandiran T. A. and Dahunsi, S. O. (2014). Heavy metal, proximate and microbial profile of some selected commercial marine fish collected from two markets in south western Nigeria. Afr. J. Biotechnol., 13, (10): 1147 - 1153.http://dx.doi:10.5897/ajb2013.13240. |
| [55] | Marcela Havelkova, Ladislav Dusek, Danka Nemethova, Gorzyslaw Poleszczuk and Zdenka Svobodova (2008). Comparison of mercury distribution between liver and muscle – A bio-monitoring of fish from lightly and heavily contaminated localities. Sensors, 8, 4095 - 4109. http://dx.doi:10.3390/s8074095 |
| [56] | Naoko Watanabe, Misato Tayama, Minoru Inouye and Akira Yasutake (2012). Distribution and chemical form of mercury in commercial fish tissues. The Journal of Toxicological Sciences, 37, (2): 853 - 861.http://dx.doi.org/10.2131/jts.37.853 |
| [57] | Daniele Kasper, Elisabete Fernandes Albuquerque Palermo, Ana Carolina Monteiro Iozzi Dias, Gustavo Luiz Ferreira, Rafael Pereira Leitao, Christina Wyss Castelo Branco and Olaf Malm (2009). Mercury distribution in different tissues and trophic levels of fish from a tropical reservoir, Brazil. Neotrop. Ichthyol., 7, (4): 751 - 758.http://dx.doi.org/10.1590/s1679-62252009000400025 |
| [58] | Guilherme S., Pereira M. E., Santos M. A. and Pacheco M. (2010). Mercury distribution in key tissues of caged fish (Liza Aurata) along an environmental mercury contamination Gradient. Biological Responses to Contaminants, 1, (1): 165 – 173. |
| [59] | Kannan K, Smith, Jr. R. G., Lee R. F., Windom H. L., Heitmuller P. T., Macauley J. M. and Summers J. K. (1998). Distribution of total mercury and methyl mercury in water, sediment, and fish from south Florida estuaries. Arch. Environ. Contam. Toxicol. 34, 109 – 118. |
| [60] | Etornyo Agbeko, Fredrick Asante, Georgina Addae and Albert K. Quainoo (2014). Bioaccumulation of heavy metals in water, sediments and tissues of some selected fishes from the red Volta, Nangodi in the upper east region of Ghana. British Journal of Applied Science and Technology, 4, (4): 594 – 603. |
| [61] | Tulay Kupeli, Huseyin Altundag, and Mustafa Imamoglu (2014). Assessment of trace element levels in muscle tissues of fish species collected from a river, stream, lake, and sea in Sakarya, Turkey. The Scientific World Journal, 14, 1 - 7. http://dx.doi.org/10.1155/2014/496107. |
| [62] | Haluk Ozparlak1, Gulsin Arslan and Emine Arslan (2012). Determination of some metal levels in muscle tissue of nine fish species from Beysehir Lake, Turkey. Turkish Journal of Fisheries and Aquatic Sciences (12): 761 - 770. http://dx.doi:10.4194/1303-2712-v12_4_04. |
| [63] | Ekeanyanwu C. Raphael, Ogbuinyi C. Augustina and Etienajirhevwe O. Frank (2012).Trace metals distribution in fish tissues, bottom sediments and water from Okumeshi River in Delta State, Nigeria. Environmental Research Journal, 5, (1): 6 - 10. http://dx.doi:10.3923/erj.2011.6.10 |
| [64] | Ozgur Canpolat (2013). The determination of some heavy metals and minerals in the tissues and organs of the Capoeta Umbla fish species in relation to body size, sex, and age. Ekoloji 22, (87): 64 - 72.http://dx.doi:10.5053/ekoloji.2013.879. |
| [65] | Bushra Khan, Hizbullah Khan, Said Muhammad and Tariq Khan (2012). Heavy metals concentration trends in three fish species from shah Alam River (Khyber Pakhtunkhwa Province, Pakistan). Nat Env Sci, 3, (1): 1 - 8. |
| [66] | Sahar Mohammadnabizadeh, Alireza Pourkhabbaz and Reza Afshari (2014). Analysis and determination of trace metals (nickel, cadmium, chromium, and lead) in tissues of Pampus argenteus and Platycephalus indicus in the Hara Reserve, Iran. Journal of Toxicology, 576496 - 6http://dx.doi.org/10.1155/2014/576496. |
| [67] | Shaikh M. J. (2013). Analysis of heavy metals in water and fish Cirrhina Mrigala of River Godavari, at Nathsagar Dam in Maharashtra, India. Bioscan 8, (3): 1025 - 1027. |
| [68] | Erhabor C. U. and Obasohan E. E. (2011). The distribution of heavy metals in water and fish tissues of Chrysichthys Nigrodigitatus and Parachanna Obscura from Ibiekuma stream, Ekpoma, Edo State, Nigeria. African Scientist, 12, 3: 133 - 141. |
| [69] | Taweel Abdulali, Shuhaimi-Othman L. M. and Ahmad A. K. (2012). Heavy metals concentration in tilapia fish (Oreochromis Niloticus) from four selected markets in Selangor, Peninsular Malaysia. J. of Bio. Sci. 10, (55): 1562 - 1566. |
| [70] | Gholam Reza Jahed Khaniki, Inteaz Alli, Ebrahim Nowroozi and Ramin Nabizadeh (2005). Mercury contamination in fish and public health aspects: A Review. Pakistan Journal of Nutrition, 4, (5): 276 - 281. |
| [71] | Mieiro Claudia Leopoldina, Mario Pacheco, Maria Eduarda Pereiraa and Armando Costa Duartea (2009). Mercury distribution in key tissues of fish (Liza Aurata) Inhabiting a contaminated estuary-implications for human and ecosystem health risk assessment. J. Environ. Monit., 11, 1004 – 1012. http://dx.doi:10.1039/b821253h. |
| [72] | Mukesh K. Raikwar, Puneet Kumar, Manoj Singh and Anand Singh (2008). Toxic effect of heavy metals in livestock health. Veterinary World, 1, (1): 28 - 30. |
| [73] | Tom K. Grimsrud, Steinar R. Berge, Tor Haldorsen and Aage Andersen (2002). Exposure to different forms of nickel and risk of lung cancer. Am. J. Epidemiol. 156 (12): 1123 - 1132. http://dx.doi:10.1093/aje/kwf165. |
 Abstract
 Reference
 Full-Text PDF
 Full-text HTML
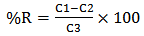


 blank+3Sblank and
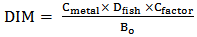
  blank+10Sblank respectively, based on the standard deviation of the blanks. Where
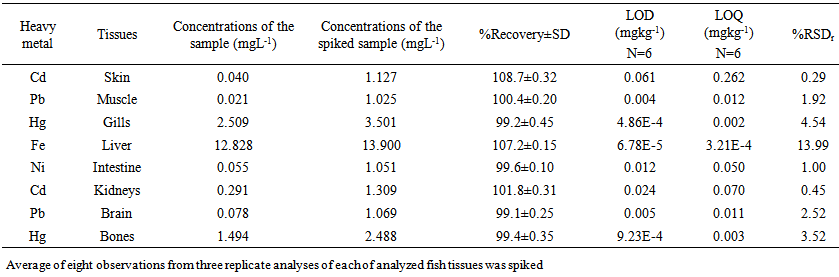
  blank was the mean of the blank aqueous solution and Sblank as the blank standard deviation. The limits presented here were assessed experimentally by standard addition assessment with fish samples, providing more realistic limits for the method. While the precision taken for %RSDr was evaluated as
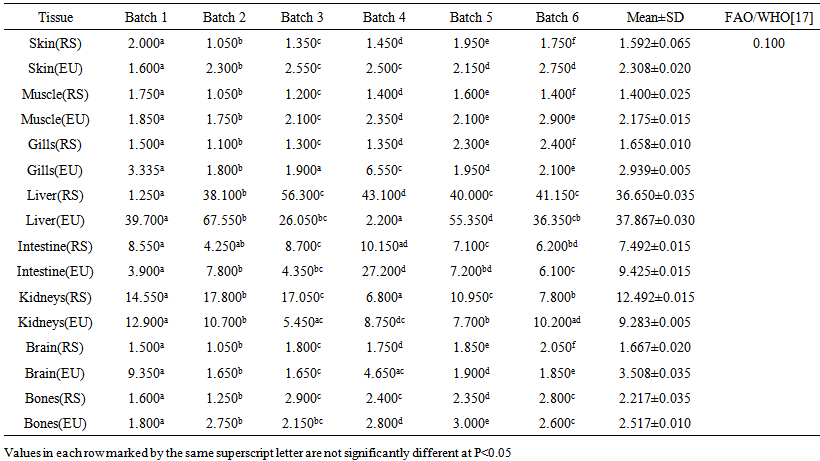
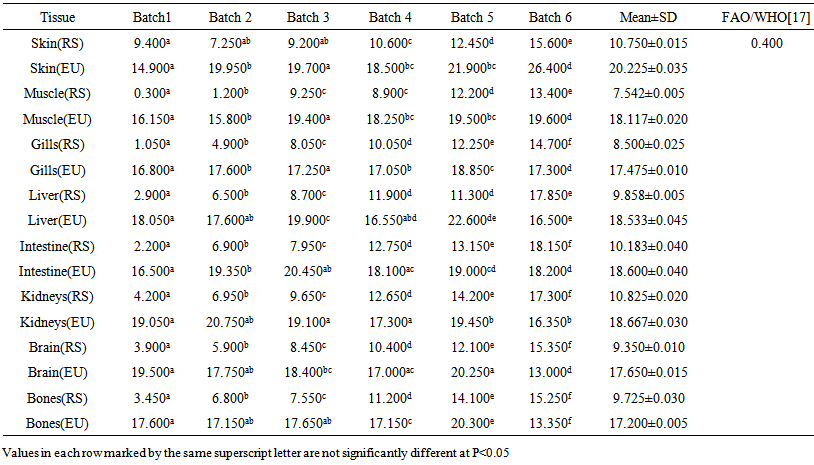
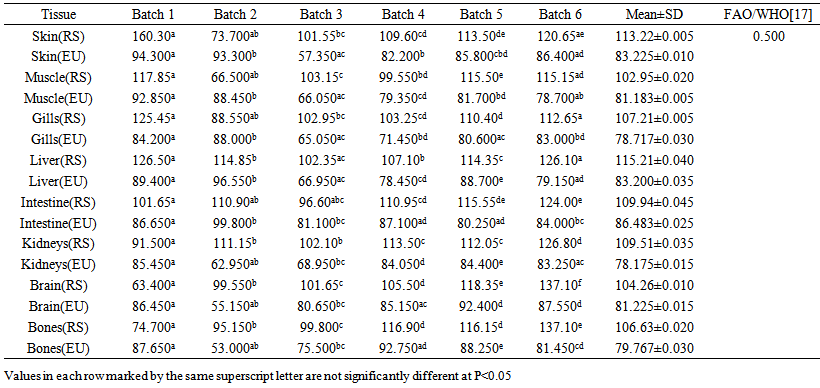
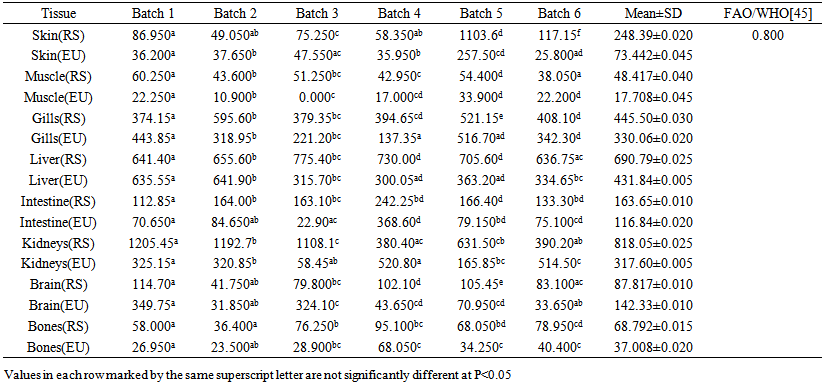
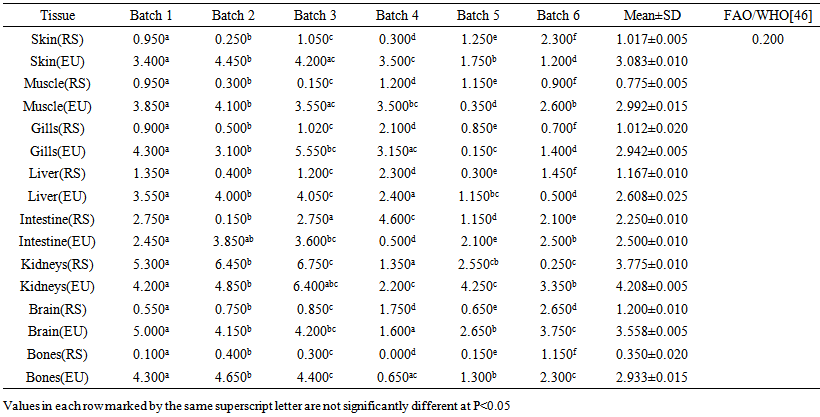
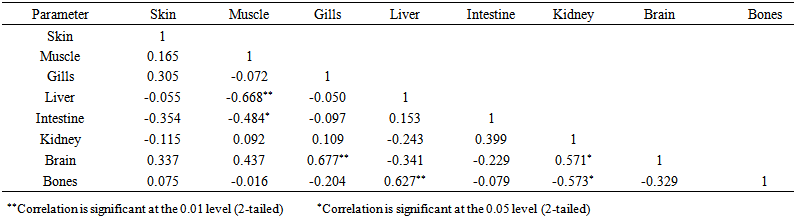
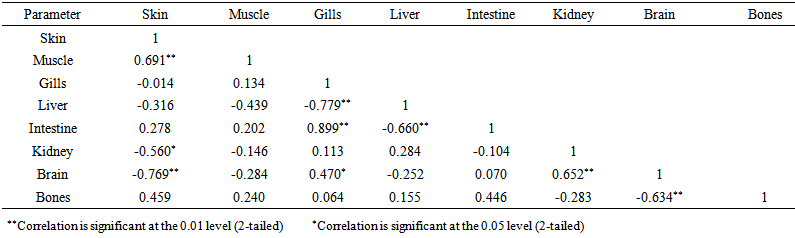
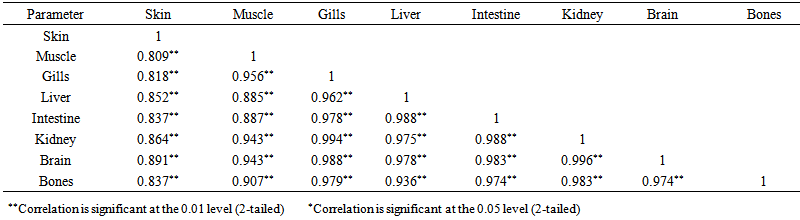
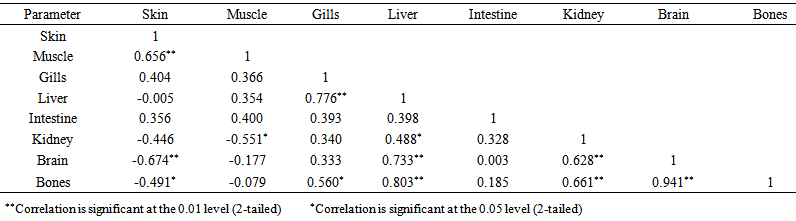
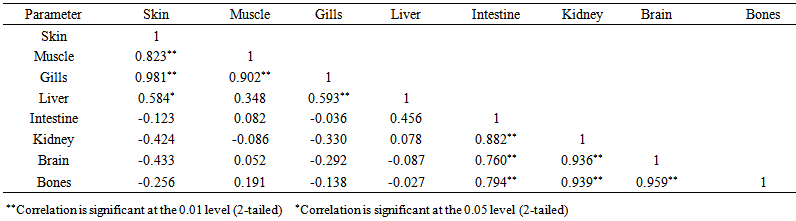
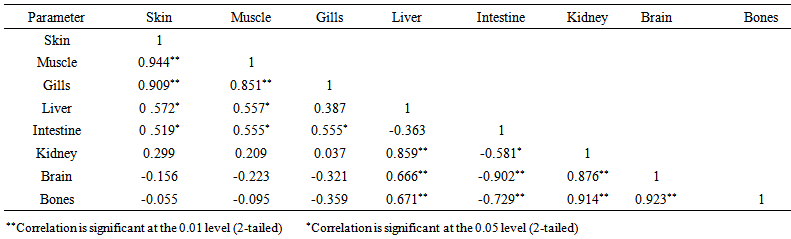
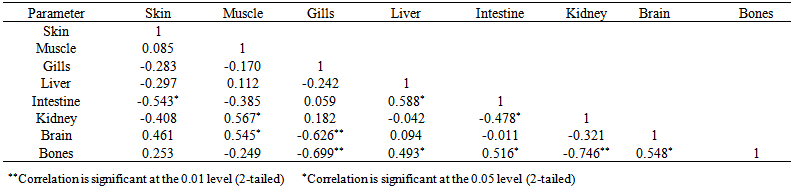
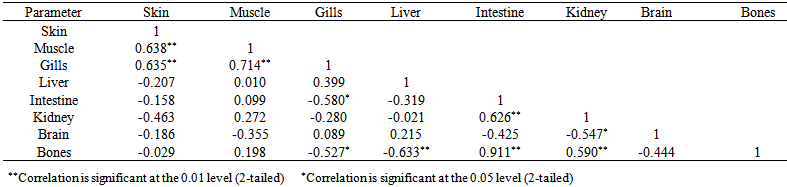
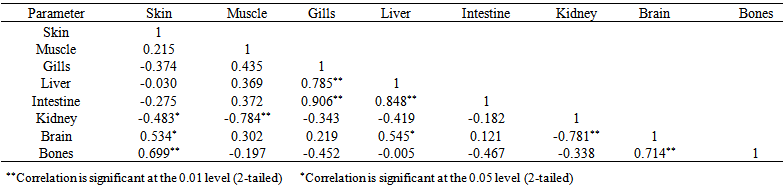
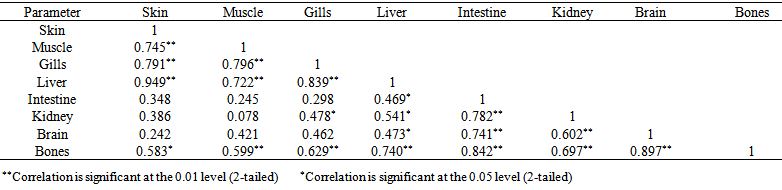
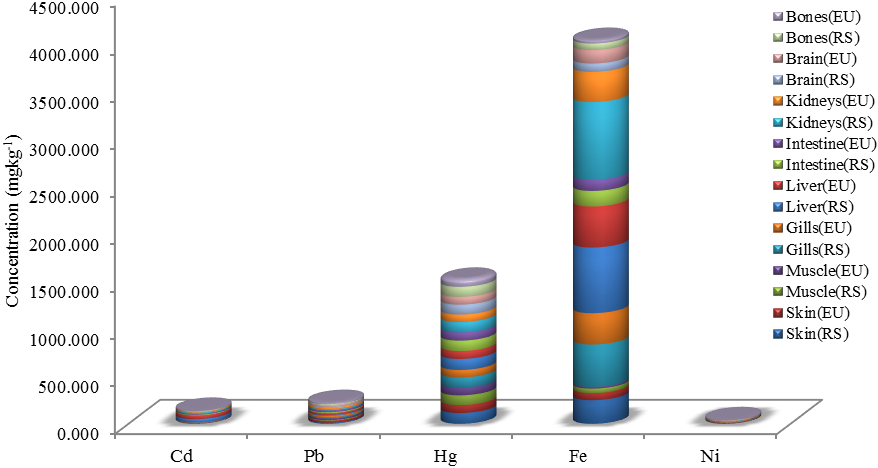
  Metal ConcentrationsThe statistical results of heavy metals; cadmium, lead, mercury, iron and nickel (Cd, Pb, Hg, Fe and Ni) concentrations (mgkg-1) in the tissues/organs (skin, muscle, gills, liver, intestine, kidneys, brain and bones) of Trachurus Murphyi across two fishing origins including the mean, standard deviation and Post-Hoc test analysis are summarized in Tables 3 to 7. Analysis of variation between fish samples collected from the two fishing origins; Russia (RS) and Europe (EU) and the sample batches within the same zone showed significant differences (P<0.05). The results of correlation analysis among the tissues/organs of the fishing zones across the studied metals are shown in Tables 8 to 17.