-
Paper Information
- Paper Submission
-
Journal Information
- About This Journal
- Editorial Board
- Current Issue
- Archive
- Author Guidelines
- Contact Us
American Journal of Chemistry
p-ISSN: 2165-8749 e-ISSN: 2165-8781
2014; 4(3): 89-96
doi:10.5923/j.chemistry.20140403.01
Chemical and Functional Properties and Performance of Blends of Water Yam (Dioscorea Alata) and Soybean (Glycine Max) Flours for Water Yam Ball (Ojojo) Preparation
 Abstract
 Reference
 Full-Text PDF
 Full-text HTML
Olapade A. A., Akinyanju F. T.
Department of Food Technology, University of Ibadan, Ibadan Nigeria
Correspondence to: Olapade A. A., Department of Food Technology, University of Ibadan, Ibadan Nigeria.
| Email: |  |
Copyright © 2014 Scientific & Academic Publishing. All Rights Reserved.
The performance of blends of water yam (Dioscorea alata) and Soybeans (Glycine max) flours for water yam ball preparation was investigated. Water yam and soybeans were processed into flours and 100% water yam flour served as the control sample. However, water yam ball was produced using water yam flour and soybeans flour which were blended at different ratio (ie 100%:0, 90:10, 80:20, 70:30, 60:40 and 50:50). The proximate analysis and functional properties of the water yam-soybean flour were determined. The sensory evaluation showed that samples 90:10, 80:20 and 70:30 were the most acceptable because they contained little quantity of soy bean flour. Experimental studies were conducted using 30 albino rats for 21 days. The rats were fed with each of the samples while those fed with the basal diet served as the control. This study showed that the rats fed with the sample 50:50 increased massively in size more than those fed with the other samples. Conclusively, all the samples had no adverse effects on the rats.
Keywords: Water yam, Soybeans, Water yam soybean blends, Water yam ball (ojojo)
Cite this paper: Olapade A. A., Akinyanju F. T., Chemical and Functional Properties and Performance of Blends of Water Yam (Dioscorea Alata) and Soybean (Glycine Max) Flours for Water Yam Ball (Ojojo) Preparation, American Journal of Chemistry, Vol. 4 No. 3, 2014, pp. 89-96. doi: 10.5923/j.chemistry.20140403.01.
Article Outline
1. Introduction
- As reported by Osagie (1992), water yam contains 28 percent starch and protein of 1.1-2.0 percent. Protein-energy malnutrition (PEM) results from prolonged deprivation of essential amino acids and total nitrogen and energy substrates (Dugler et al., 2002). Dietary energy and protein deficiencies usually occur together, although one sometimes predominates the other and if severe enough, may lead to clinical syndrome of kwarshiokor (Predominant protein deficiency) marasmus (mainly energy deficiency).In most developing countries including Nigeria, the economic situation is such that the low income families cannot afford protein rich foods from animal source to meet recommended dietary allowance. The diet of most people consists predominantly of cereals and roots which do not provide good quality protein in diet. Studies by the food and Agricultural organization have shown that over one billion people are undernourished in the world (Fasoyiro, 2005). One way to curb the global menace of (PEM) is through food enrichment of plant origin (Allan et al., 2006).‘Ojojo’ (water yam) is delicacy most popular among the Ijebu people of South-West Nigeria. These crisp spicy balls are prepared from freshly grated water yam and fried in oil which gives a striking resemblance with akara balls. It is mostly eaten with pap, eko, gari or agidi. It can also be eaten as a snack. Ojojo is mainly carbohydrates. Water yam is highly susceptible to deterioration because of its high moisture content (65-76%) (Opara, 1999). Basically, the purpose of this study is to evaluate acceptability of ojojo prepared from water yam flour enriched with soybeans flour, which contains protein that provides all the essential amino acids available in an amount that is close to those required by animals and humans. This will make it a convenient food to be easily cooked.
2. Materials and Methods
2.1. Materials
- (Water yam) Diosocrea Alata free from physical damage and bruises was purchased from Ijebu Ode in Ogun State. Soybeans were purchased from Bodija market in Ibadan.
2.2. Preparation of Water Yam Flour
- Standard procedure for the preparation of instant yam flour was used for the production of water yam flour as described by Aiyeleye and Eleyinmi, (1997). Water yam tuber was manually peeled with a sharp stainless knife and cut into thin slices so as to ensure efficient heat circulation during blanching and drying. Slices was washed, weighed and heated with 0.75% of sodium metabisulphite in order to prevent browning of the yam slices. Yam slices was drained and rapidly blanched at 100℃ for 5 min. The pre-cooked yam slices was dried at 60℃ for 24hr. The dried yam slices was milled and packaged in polythene bag.
2.3. Preparation of Soy Bean Flour
- Soybean was cleaned to remove extraneous materials and soaked in tap water for 24hr. This was followed by dehulling, washing and drying at 55℃ for 36hr after which it was milled. The sample was packaged in polythene nylon and stored at 5℃. The flour was defatted using n-hexane. The defatted soybean flour was dried at 50℃ in a free air oven to drive off the n-hexane completely from the sample. The defatted flour was properly sieved passing through 60 mesh screen and packaged in polythene bag.
2.4. Preparation of Blends of Water Yam and Soybean
- Different ratios of water yam and soybean flours was formulated ranging from 90:10, 80:20, 70:30, 60:40 and 50:50 respectively. 100 percent water yam flour served as control sample, the samples were represented with the codes XYZ, FVK, TUQ, JMO, PRT and BYG respectively.
2.5. Preparation of Water Yam Ball (Ojojo)
- Firstly, 100g of water yam flour was thoroughly mixed with 200ml water to form a thick paste, finely chopped onions and pepper was added into the water yam, and also a cube of magi. All was thoroughly mixed together and little salt was added. The mixture was fried in balls in deep fat until golden brown and after which it was ready to eat.
2.6. Proximate Analysis of Flours
- Determination of Moisture Content: The method described by AOAC (1990) was used.Determination of Ash content: The method described by AOAC (2000) was used.Determination of Crude Fat: The method described by AOAC (2000) was used.Determination of Protein: The method described by AOAC (2000) was used.Determination of Fibre: The method described by AOAC (2000) was used.Determination of Carbohydrates: The method described by AOAC (1990) was used.
2.7. Functional Properties of Flours
- Water Absorption capacity: The procedure described by Sosulski (1962) was used.Fat Absorption Capacity: The procedure described by Lin et al. (1974) was used.Bulk Density: The procedure described by Fellows 2000 was used.Swelling Power Solubility: The procedure described by AOAC (2000) was used.Pasting characteristics was determined using Rapid Visco Analyser.
2.8. Sensory Evaluation of Water Yam Soybean Ball
- Nine point Hedonic Scale was used and the sensory evaluation was carried out by thirty five (35) panelists.
2.9. Animal Studies
- Thirty (30) albino rats (male and female) weighing 60-100g were obtained from the breeding center of the Department of Veterinary Physiology and Pharmacology, Faculty of Veterinary Medicine, University of Ibadan, Oyo State, Nigeria. The rats were distributed randomly into 7 groups inside metallic cages and fed with basal diet for 10 days. The experimental diets was mixed with water and rolled into smooth dough to form pellets for easy consumption by the animals. Protein Efficiency Ratio (PER) and the Protein Retention Ratio (NPR) as described by Pellet and Young (1980) was determined. Some biochemical parameters (total protein, albumin, urea, cholesterol and triglycerides) were determined using Roche Diagnostic Test Kits.
2.10. Statistical Analysis
- All data obtained were subjected to statistical analysis of variance (ANOVA) using SPSS version statistical pages. Means were separated using DUNCAN Multiple Range Tests (DMRT).
3. Results and Discussion
3.1. Proximate Composition of Water Yam Soybean Flour
- In Table 1, the proximate composition results showed that BYG had the lowest moisture content and highest carbohydrates of 5.21% and 87.81% respectively while TUQ and JMO had the same range of moisture content of 6.79% and 6.88% respectively as shown in Table 1. Increase was noticed in the protein and fat content of PRT as compared to XYZ and FVK, while there were decreases in the ash and fibre content of BYG compared to PRT which had the highest ash and fibre contents of 4.04% and 2.18% respectively. The PRT had the lowest carbohydrates of 74.4% due to the quantity of protein content it contained followed by JMO and TUQ at 76.9% and 82.2% respectively with BYG taking the lead. The low moisture contents observed in all samples including those substituted with soybean flour indicate shelf stable products, which may be attributed to low content of water yam flour.
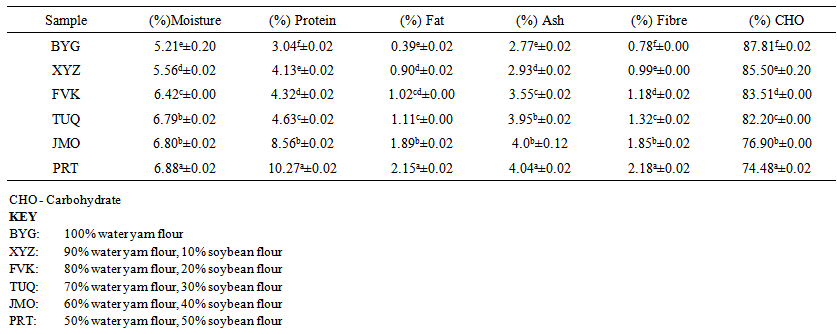 | Table 1. Proximate Composition (%) of Water Yam Soybean Flour |
3.2. Functional Properties of Water Yam Soybean Flour
- Table 2 shows the result of the functional properties of the water yam soybean flour. Bulk density of flour was reported to increase with increase in starch content (Bhattackaya and Prakash, (1994). The packed and loose bulk densities tended to increase with increase in water yam content and the water yam flour contained mainly starch (Coursey, 1968). The bulk density ranged between 0.42 g/cm 3 to 0.45g/cm3 in which sample PRT had the lowest value of loose bulk density. The sample TUQ has the lowest amount of packed density of 0.66g/cm3 while sample FVK has the highest quantity of packed bulk density of 0.71g/cm3.The Water Absorption Capacity of the water yam-soybeans flour blend ranged from 126.% to 1.64% in which sample PRT had the highest valued while sample BYG had the lowest valued of 1.26%.The oil Absorption Capacity of the water yam soybean flour blends ranged from 1.21% to 1.54% in which sample PRT has the highest value of 1.54% while sample BYG had the lowest value of 1.21%. The Swelling Power of the water yam soybeans flour blend range from 2.85% to 4.54% in which sample XYZ had the highest amount of swelling power while sample FVK had the lowest value of 2.85%.
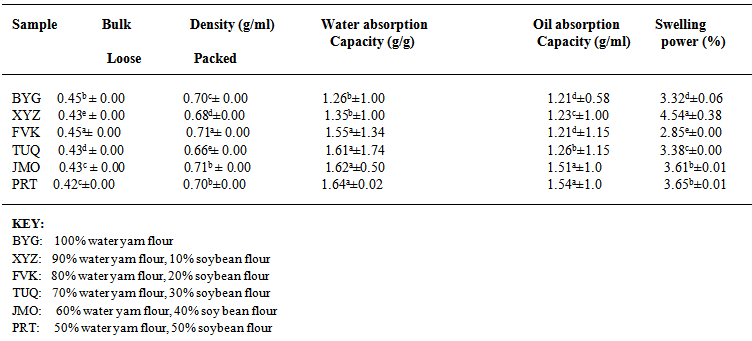 | Table 2. Functional Properties of Water Yam Soybean Flour |
3.3. Pasting Characteristics of Water Yam Soybeans Flour
- Table 3 shows the pasting characteristics of water yam soybean flours. The values of the Peak Viscosity of the sample significantly differ from one another (P<0.05). The peak viscosity values decreased from 2295.0 RVU to 134.12 RVU BYG to PRT. This decreasing in peak viscosity values on increasing enrichment was due to the interactions of fats and protein components in the flours. Sample PRT had the lowest value of 134.12 RVU while BYG had the highest value. The peak viscosity is an indicator of the water binding capacity of the starch in the sample and the product quality. It helps to predict the viscous load on a mixing cooker (Ingbian and Adegoke, 2007). It is also an indicator of paste strength and hence, the thickening power of the starch (Niba et al., 2001). The difference in the peak viscosities may be due to the difference in the rates of water absorption and swelling of the starch granules of the fours during heating (Ragaee et al., 2006). The viscosity of a cooked starch paste is a reflection of the resistance of the swollen mass gel particles to stirring. High starch damage results into high peak viscosity values (Sanni et al., 2001).The final viscosity ranged from2911 RVU to 731 RVU for formulation containing 100% water yam flour to sample containing 50% water yam flour and 50% soybean flour. The final viscosity value for 100% water yam flour had the highest value of 2911RVU while the sample containing 50% water yam and 50% soy bean had the lowest final viscosity of 731 RVU. The aggregation of the amylose molecules in a paste have been known to result in higher final viscosity values (Oguntunde, 1987). Final viscosity is a good measure of the stability of cooked dough. Cross linkages in starch granules on gelatinization and consequently contributes to the stability and rigidity of the swollen granules structure. The pasting temperature of the samples increased from 83.200C – 85.550℃ in which sample containing PRT has the highest pasting temperature value of 88.55℃ while BYG had the lowest pasting temperature of 83.73℃.The value obtained on increasing supplementation in the flours especially in the PRT sample may have resulted from the buffering effect of fat and other components present in the crayfish (Egunlety et al., 2002). The pasting temperature is the temperature above the gelatinization temperature at which the viscosity begins to rise, and it is an indication of the minute temperature required to cook a sample. It likewise determines the stability of the other components in a formulation, and also predicts the energy requirement for the preparation (Crosbie, 1991).The peak time in sample containing FVK had the lowest value of 4.93min while the sample JMO had the highest peak time value of 6.05min.The trough values also decreased on increasing supplementation in the flours with samples containing PRT having the lowest trough values of 464 RVU and sample BYG having the highest value of 1948.3 RVU. The setback values in BYG had the highest value of 954 RVU while TUQ had the lowest set back values of 268 RVU. The increase observed in the setback values of the flour is probably due to increase in the hydrogen bonding on cooling. The stability of flour from food products can be predicted using the setback viscosity (Zaodul et al., 2007).The breakdown viscosity was observed to decrease on increased supplementation in the samples in which samples containing BYG was the highest breakdown viscosity values of 345.67 RVU sample PRT had the lowest value of 69RVU. The breakdown viscosity is the measure of the degree of disintegration of starch granules, or the degree of disintegration of paste granules on heating.
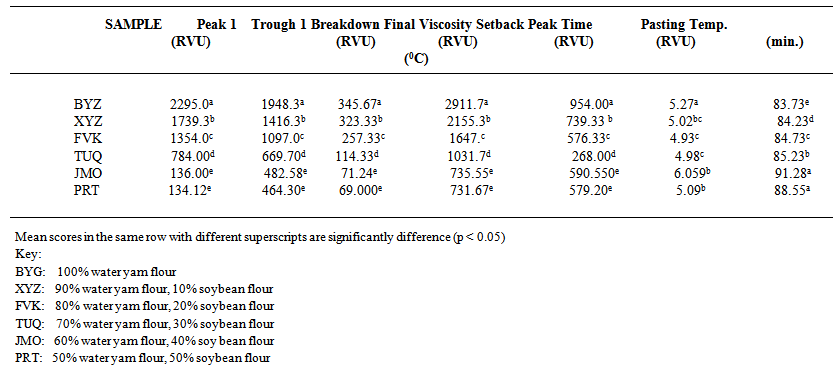 | Table 3. Pasting Characteristics result of water yam soybeans flour |
3.4. Sensory Evaluation
- The sensory evaluation showed no significant differences in the colour of samples BYG, XYZ, FVK and TUQ but there was significant difference in samples JMO and PRT ranging from golden brown to light brown. The details of these are shown in Table 4. The colour became lighter with substitution with higher ratio of soybeans compared to samples XYZ, FVK and TUQ which had lower ratios of soybeans flour. The texture of samples BYG and FVK was not significantly different, while samples XYZ and TUQ had the same texture compared to samples JMO and PRT which had different textures form all other samples. The flavors of samples BYG, XYZ, FVK and TUQ were not significantly different from each other but samples JMO and PRT are significantly different from each other. This is due to the different high ratios of soybeans flour that each of them contained. The taste of BYG, XYZ, FVK and TUQ were not significantly different from each other. They contained lesser quantity of soybean flour but with the exception of BYG which had no soybean flour. Conclusively, samples XYZ, FVK, TUQ were the most acceptable samples. This is due to the fact that they contain little ratio of soybean flour, having the highest mean in flavor, taste, texture and colour.
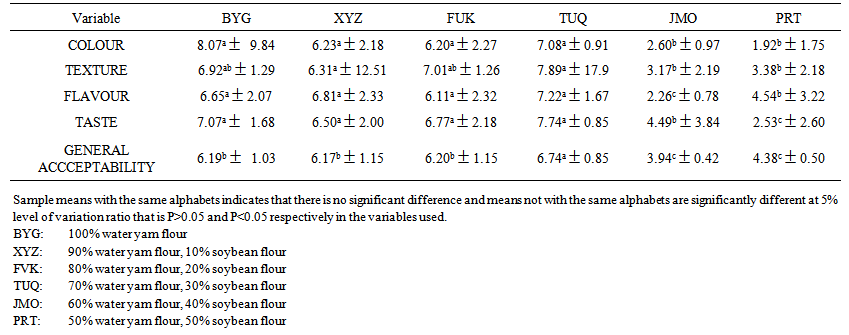 | Table 4. Sensory Evaluation of Water Yam and Soybean Flour |
3.5. Analysis of Variance in Feed Treatment Outcome on Some Mean Values of Some Biochemical Parameters of Rats
- Table 5 shows that the parameters of protein level, urea level, triglyceride level, albumin level and albumin globulin ratio levels are not significantly different from that of the rats feed with the control sample (basal diet), but there was significant difference in the cholesterol levels of the rats fed with the control sample and the rats fed with the composite flour. The globulin level of FVK, TUQ and PRT was significantly different from the rats fed with the control sample (basal diet) while there was no significantly difference in the globulin level of BYG, XYZ and JMO when compared with the globulin level of the rats that were fed with the control sample (basal diet).
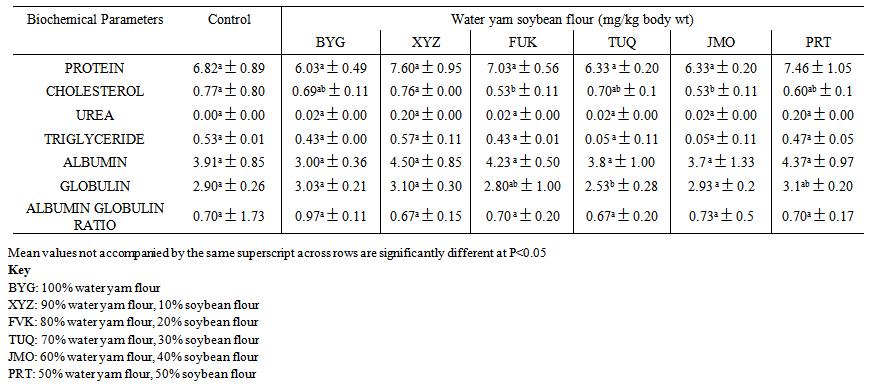 | Table 5. Analysis of Variance in Feed Treatment Outcome on Some Mean Values of Some Biochemical Parameters of Rats |
3.6. Biological Response of Rats Fed With Water Yam Soybean Composite Flour
- The result of biological evaluation of the protein quality of composite flour are as presented in the Table 6 showing the average initial weight, final weight, weight gain, protein intake and Protein Efficiency Ratio (PER). Average final live weight of the animals fed with PRT was the highest (138.10g) and significantly different (P<0.05) from those fed with the basal diet, BYG, XYZ, FUK and TUQ respectively. Gain or reduction of weight could be as a result of their food intake which also varied from 31.9g for control group to 11.8g for animals on PRT experimental diet. The low values recorded could be as a result of the protein quality of the diet not being enough to support their growth, hence the reduction in weight. The difference is as a result of differences in protein quality between (control), water yam and soybean. Water yam is low in protein compared to soybeans while soybean is high in protein, such that when added to water yam increases the protein content of the mixture since the protein of soybeans contains all the essential amino acids. There was significant difference (p<0.5) in Protein Efficiency Ratio and Feed Efficiency Ratio, between group of rats that were fed on the control diet and composite flours respectively. The control group fed normal rat food had the highest Protein Efficiency Ratio (PER) (29.5) followed by the group that was fed with PRT (16.1) and XYZ (10.8). The Net Efficiency Ratio (NER) of the rats fed with BYG was significantly lower at (-3.84) than those that were fed with experimental diet of JMO and PRT. This could be as a result of inefficient nutrient utilization which might have made it impossible for the animals to totally utilize the nutrients in the food completely. The value of protein intake is the lowest in FVK (-0.38) while PRT had the highest value of 0.73.
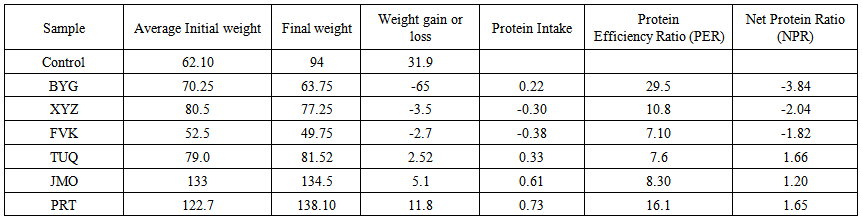 | Table 6. Biological Response of Rats Fed with Water Yam Soybean Flour |
3.7. Percentage Organ to Body Weight of Rats Fed on Experimental Diet over a Period of 21Days
- Organ weight of rats fed with water yam soy bean composite flour and control sample are shown in the Table 7. Kidney weight of rats that were fed with BYG and XYZ diets were significantly lower, (0.34, and 0.35) (p<0.05) than those fed with control diet while those that were with JMO was significantly higher (0.55). Lower liver weights have been reported by Egounlety et. al. (2002) in rats that was fed lima and winged beans, which is presumably due to necrosis arising from the potent toxic components in legumes. The results of organ weight suggest development of muscularized liver organ in order to handle some extraneous components of the diets (Ijarotimiro and Kehinro, 2012). The liver has been considered to be the nutritional indicator of the body of which dietary and toxic factors in the food consumed may interfere with this function. There was no significant difference in the weight of the hearts of all the animals. With these variation in organ weights, diets that are of poor protein quality could be said to cause growth failure and the more pronounced effect due to lack of essential amino acids being made available to the liver which could in turn lead to serious metabolic and physiologic alterations.
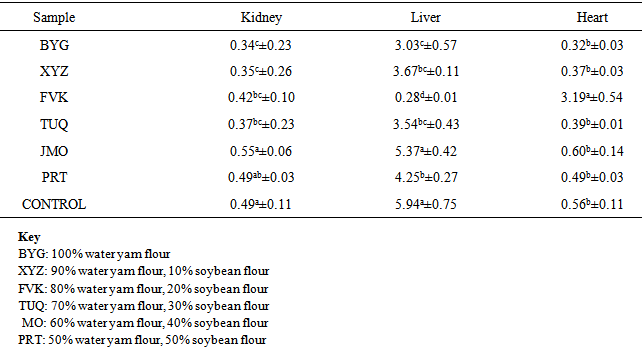 | Table 7. Percentage Organ to Body Weight of Rats Fed on Experimental Diet over a Period of 21 Days |
3.8. Haematological Indices of Rats Fed on the Experimental Diets over a Period of 21days
- Table 8 shows the haematological indices of rats fed on the experimental diets and control. It was observed that the PCV, haemoglobin and WBC values of the rats fed with control diet and composite flour were not significantly different (p>0.05). Low PCV has been associated with protein deficiency (Pkesatcha et.al., 2012). Blood is of high physiological significances in the animal body and inadequate intake of dietary protein could affect blood synthesis of which any abnormal variation would affect its primary function. The primary red cell measurement which gives a basic assessment of the size of the circulating erythron is the packed cell volume (PCV) or haemaocrit. This is simply a measurement of the fraction of the blood volume occupied by erythrocyte and is expressed either as a percentage or as a fraction. There were no significant difference (p<0.05) in mean corpuscular volume (MCV) mean corpuscular haemoglobin concentration (MCHC), and various differential counts namely lymphocytes, between rats, control diet and the water yam soybean composite flours. The MCV of the group ranged between 58.33 and 63.33 while MCHC ranged from 31.67 in control diet to 33.33 in the samples of the composite flours. White blood cell (WBC) was highest (6.67) in animals fed with XYZ while the least value (4.00) was recorded for rats fed PRT. The value of lymphocytes varied from 71.00 in control group to 77.67 in the group fed with PRT. Rats that were fed with JMO had the least number of lymphocytes while those fed with PRT.
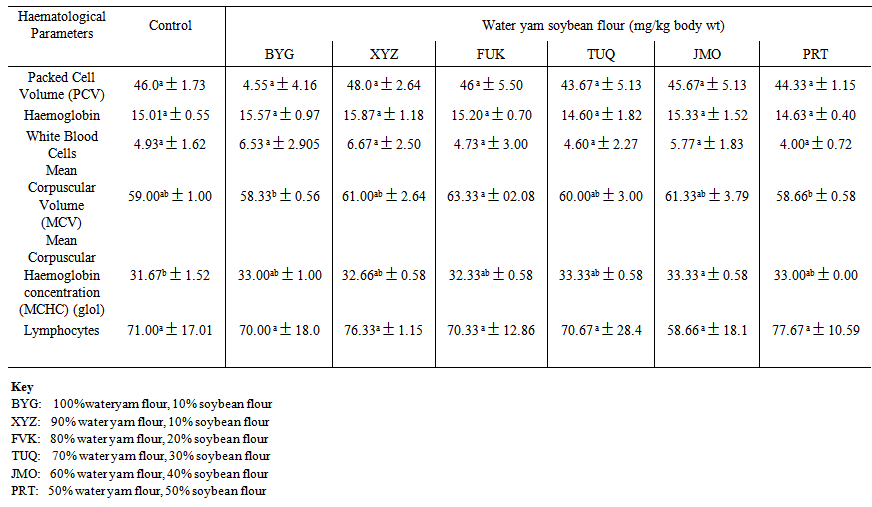 | Table 8. Analysis of Variance in Feed Treatment Effects on Mean Values of Some Haematological Parameters Between Groups of Rats |
3.9. Changes in Weight of Rats throughout the Experimental Period
- From Figure 4.1, there was increase in weight of the animals fed with basal diet from the first day to the last day of the experimental period. There was decrease in weight of rats fed with BYG, XYZ and FUK. This is because they contain low amount of protein. It was observed that the rats fed with these samples became lean till the end of the experimental period. There was slight increase in rats fed with TUQ and their weight became constant from the 15th day of the experimental period till the last day.Rats fed with JMO also increased throughout the period and rats fed with PRT experienced a massive increase in weight than all the animals than all other animals because of the quantity of protein contained in the sample. This is because soybeans contain all the essential amino acid needed for growth, hence Protein – Energy Malnutrition (PEM) results in kwashiorkor or marasmus as reported by Dulger et al., 2002.
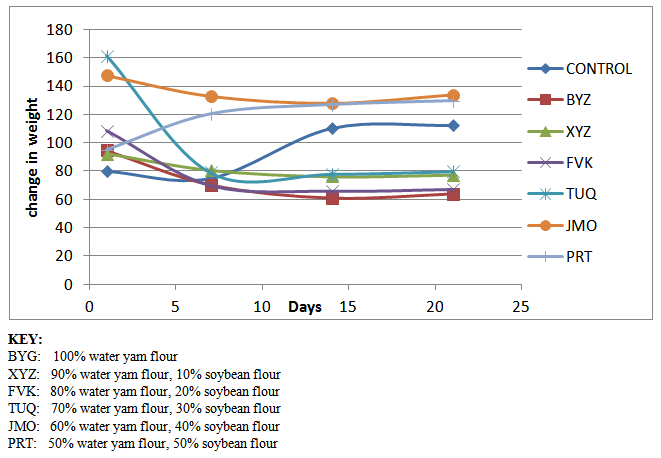 | Figure 4.1. Change in weight of rats throughout the experimental Period |
4. Conclusions
- It can be inferred from this study that TUQ had the highest overall acceptability as indicated by 35 judges that carried out the sensory evaluation followed by BYG, XYZ and FUK which encourages the variation in water yam soybean composite flour.The colour of the samples became lighter with substitution as compared to BYG and XYZ which had golden brown colours. Sample PRT had the lightest colour due to the quantity of soybean flour it contained. The colours of the flours were different due to the quantity of soybean flour that was added to each sample. The substitution of water yam flour with soy beans should be encouraged as protein food since it has been established that it is safe for human consumption.