Mushtaq Hussain1, Tvd Prasad Rao2
1Head of chemistry section, Deccan college of Engg& Technology, Hyderabad India
2Principal P.G. College Osmania University, Hyderabad India
Correspondence to: Mushtaq Hussain, Head of chemistry section, Deccan college of Engg& Technology, Hyderabad India.
| Email: |  |
Copyright © 2012 Scientific & Academic Publishing. All Rights Reserved.
Abstract
The studies were carried out to find out the toxic trace element contamination in ground water of Bollaram and Patancheru areas of Medak district, Andra Pradesh, India. Forty ground water samples were collected in pre and post monsoon seasons of 2008 from the villages near to industrial areas and analyzed for trace elements such as Cr, Mn, Fe, Ni, Co, Cu, Zn, As, Cd, B, Pb by ICP-MS using the standard reference material NIST 1640 for calibration. The ground water in both the areas is contaminated with respect to these elements. Iron and Arsenic exceeds the permissible limit of BIS in all the ground water samples. Therefore in order to restore the ground water quality there is need to stop the indiscriminate discharge of effluents.
Keywords:
Trace elements, Contamination,Ground water, Effluents
Cite this paper: Mushtaq Hussain, Tvd Prasad Rao, Toxic Trace Element Contamination in Ground Water of Bollaram and Patancheru, Andhra Pradesh, India, American Journal of Chemistry, Vol. 4 No. 1, 2014, pp. 1-9. doi: 10.5923/j.chemistry.20140401.01.
1. Introduction
Trace elements in groundwater are defined as chemical elements dissolved in water in minute quantities, always or almost always, in concentration less than one mg/l[1]. Although present in small concentration but their desirable intake is necessary for proper functioning of human body. The excess or deficiency or both may pose health hazard. The trace element of ground water though occasionally studied, is becoming one of the increased concern due to its adverse effect on human physiology. Some of them are linked for causing cancer and renal failure among those who are exposed to high dose of trace metals especially in industrial areas. The source of trace metals into the ground water could be geogenic, but occurrence of them in higher concentration above the permissible limit of drinking water standards raises the suspicious of industrial contamination sources. The higher concentration of their presence in industrial effluents percolates down to sub-surface water bodies and gets absorbed in the course as a result of various geochemical processes. Higher concentration of trace metals can also be found in ground water near contaminated sources posing serious health threats.The occurrence and mobility of trace metals in groundwater environments is strongly influenced by adsorption process this occurs because of the presence of clay minerals, organic matters and the other crystalline and amorphous substances in ground water. Geochemical processes can control and perhaps limit contaminant concentrations in the various phases, thereby, directly impacting exposure level. The equilibrium/disequilibrium exists between the dissolved metal in groundwater and adsorption site may also enhance the metal mobility[2]. Some metals present in trace concentrations are important for physiological functions of living tissue and regulate many biochemical processes. The same metals, however, at increased concentration may have severe toxicological effects on human being[3]. At the same time the deficiency of trace elements are also harmful. Domestic and industrial waste-water and agricultural activities are also responsible for the higher concentration of heavy metals in the groundwater. Trace metals can be toxic and even lethal to humans even at relatively low concentrations because of their tendency to accumulate in the body[4]. Present study was conducted in residential areas near to Balaram and Patancheru industries. The study focused on determination of trace elements in ground water.
2. The Study Area
The Patancheru and Bolaram Industrial Development Areas (IDAs) (78°08′–78°23′ east longitude and 17°30′–17°42′ north latitude) of the Medak district are located about 35 km from Hyderabad, Andhra Pradesh (AP), India; the location is shown in Fig. 1
3. Material and Methods
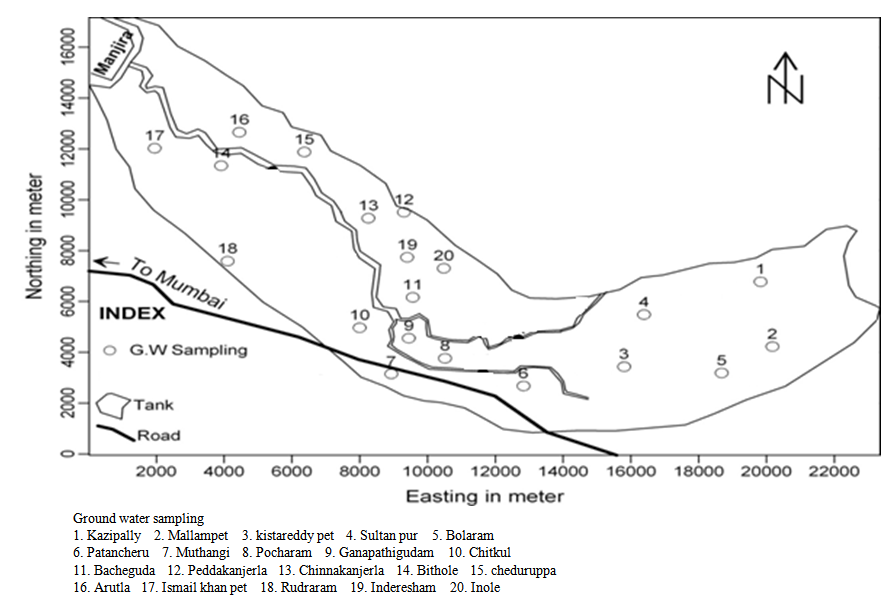 | Figure 1. |
The water samples were collected and stored in 1 liter capacity clean plastic bottles. Before collection of samples, the bottles were washed with double distilled water. Prior to collecting the samples, the containers were rinsed by the water to be sampled. The wells were duly pumped before collecting their sample so that the stagnant water, if any, is completely removed from storage within the well assembly. The trace element samples were treated with 0.6N HNO3.The trace elements like Cu, Zn, Ni, Fe, Mn, Co, Cr, Cd, B, As and Pb were analyzed by Inductive Coupled Plasma-Mass Spectrophotometer (ICP-MS). A Perkin Elmer SCIEX®, Model ELAN DRC II inductively coupled plasma-mass spectrometer (ICP-MS) (Concord, Ontario, Canada) was used throughout. Acidified water samples were directly fed into the instrument nebulizer after proper dilution and filtration. Calibration was performed using the certified reference material NIST 1640a (National Institute of Standards and Technology, USA) to minimize matrix and other associated interference effects and accuracy was better than 6% RSD. Relative standard deviation (RSD) was found to be better than 6% in the majority of the cases, which indicates that the precision of the analysis is reasonably good[5]. Trace elements analyses were carried out at National Geophysical Research Institute (NGRI), Hyderabad. A.P. India.
4. Results and Discussion
The trace metals such as Cr, Mn, Fe, Ni, Co, Cu, Zn, As, Cd, B and Pb were collected from 40 groundwater samples of the study area in both pre-and post-monsoon 2008 are given in table 1. A brief description on concentration levels and chemical behavior of above 11 trace metals are given below: | Table 1. Trace element data in mg/l in selected water samples in the study area for pre and post monsoon 2008 |
Chromium (Cr): Hexavalent chromium (Cr 6+) is highly toxic and in higher concentration is found to be carcinogenic[6, 7]. Trivalent chromium rarely occurs in drinking water. Chromium concentrations in the ground water study area range from 0.0185 to 0.0945 mg/l and 0.0104 to .0654 mg/l in both the seasons. One out of 20 samples analyzed in both period, record Cr concentration higher than the permissible limit of 0.05 mg/l[8]. The higher concentration of chromium is found in Sultanpur. The variation of concentration of chromium in ground water of pre and post monsoon 2008 is graphically express in figure 1.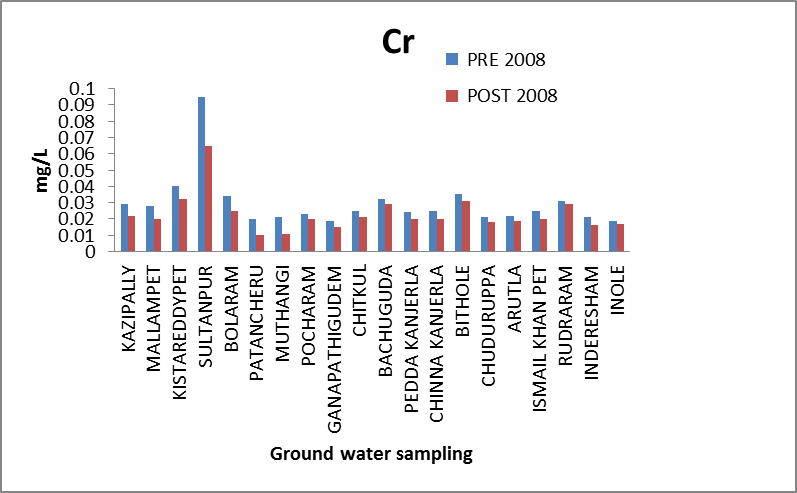 | Figure 1. Variation of concentration of Cr in mg/L for pre and post monsoon 2008 |
Manganese (Mn): Manganese is one of the more abundant metals in the earth’s crust and usually occurs together with Fe. On exposure to oxygen, Mn can form insoluble oxides that may result in undesirable deposits and color problems in distribution systems[9]. The concentration of Mn in ground water of both seasons ranges from 0.0209 to 0.7243 mg/l and .0148 to .6893 mg/l as against the maximum permissible limit of 0.5 mg/l[8]. Two out of 20 samples, have Mn concentration marginally higher than the permissible limit. The high concentration of Mn is found in Sultanpur, Inderesham, Inole. The variation of concentration of Mn in ground water of pre and post monsoon 2008 is graphically express in figure 2.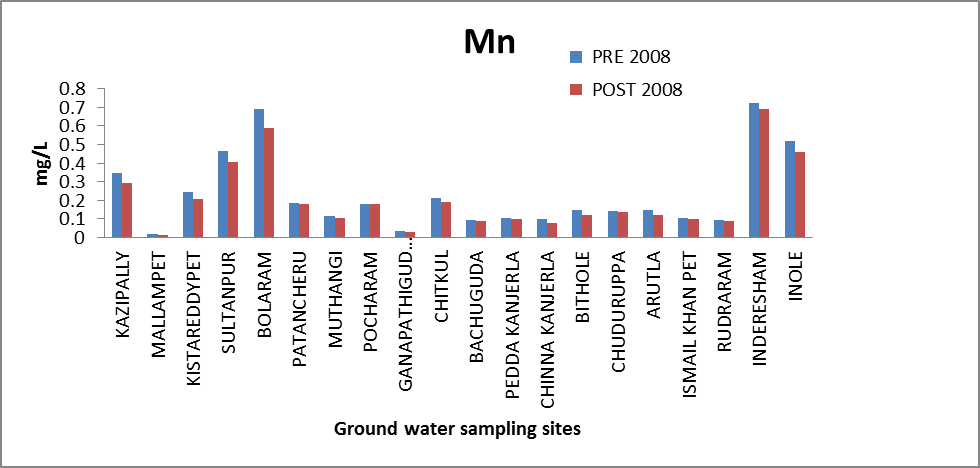 | Figure 2. Variation of concentration of Mn in mg/L for pre and post monsoon 2008 |
Iron (Fe): Iron is one of the most abundant metals in the earth's crust. It is found in natural fresh waters at levels ranging from 0.5 to 50 mg/l[10]. Iron may also be present in drinking water as a result of the use of iron coagulants or the corrosion of steel and cast iron pipes during water distribution. Iron is an essential element in human nutrition. Iron in potable water should not exceed the range 0.3-1.0 mg/l [8]. Iron concentration in the ground water of the study area ranges from 2.09 to 5.312 and 1.9 to 4.988 mg/l. All samples in both seasons have Fe concentration of >1.0 mg/l. The variation of concentration of iron in ground water of pre and post monsoon 2008 is graphically express as in figure 3.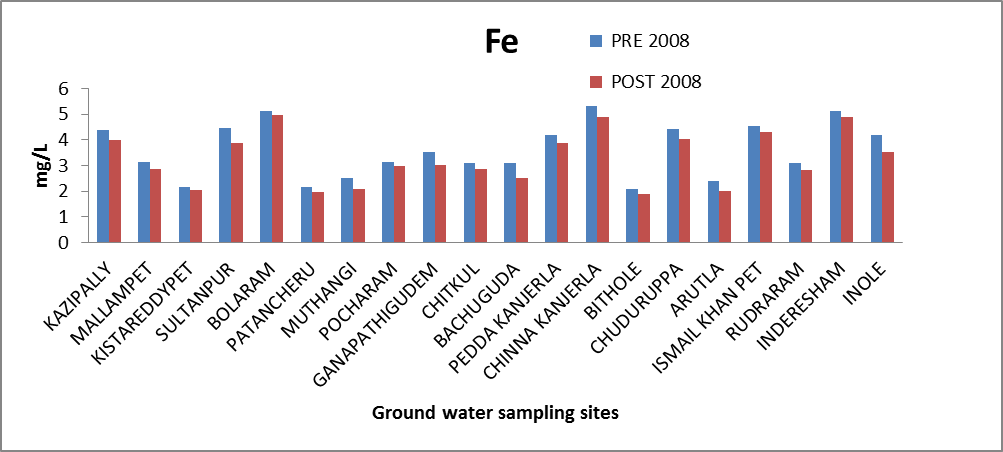 | Figure 3. Variation of concentration of Fe in mg/L for pre and post monsoon 2008 |
Nickel (Ni): The high concentration of Ni in both soluble and sparingly soluble compounds is considered to be a human carcinogenic. The recommended limit of nickel in the drinking water standard is 0.1 to 0.3 mg/l[8]. The concentration of Ni in the ground water study area for both the seasons’ ranges from 0.01 to 0.042 mg/l and .0056 to .0358 mg/l therefore, within maximum limit. The variation of concentration of Ni in ground water of pre and post monsoon 2008 is graphically express in figure 4.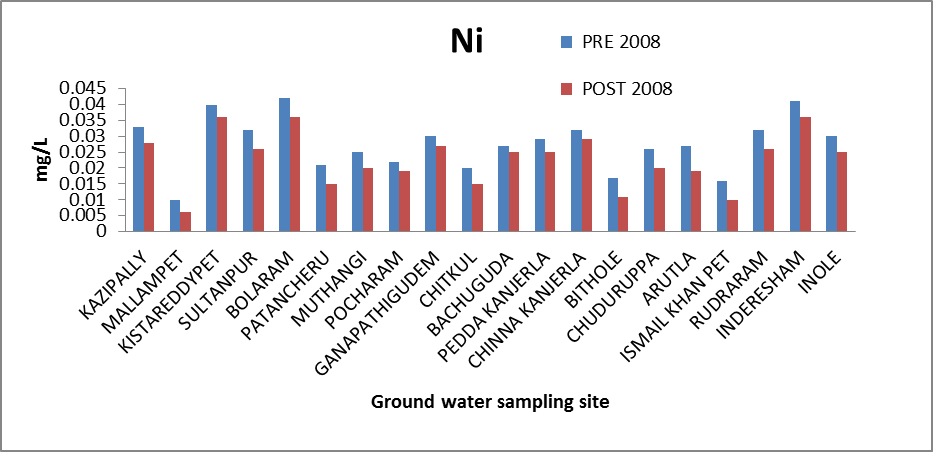 | Figure 4. Variation of concentration of Ni in mg/L for pre and post monsoon 2008 |
Cobalt (Co): Cobalt is required for the manufacture of red blood cells and in preventing anemia. An excessive intake of cobalt may damage the heart muscles, and may cause an over-production of red blood cells or damage to the thyroid gland (www. anyvitamins.com).The concentration of cobalt in the ground water of the study area ranges from 0.0003 to 0.0045 mg/l and .0001 to .0043 mg/l. The variation of concentration of Co in ground water of pre and post monsoon 2008 is graphically express in figure 5.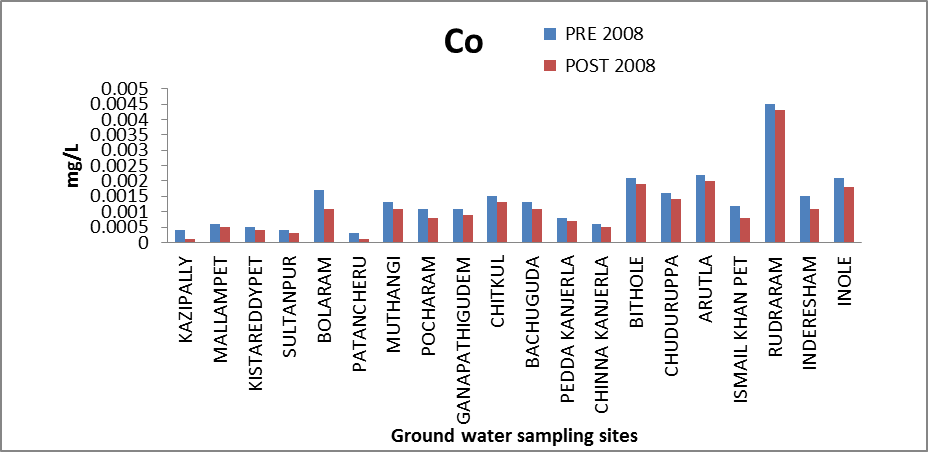 | Figure 5. Variation of concentration of Co in mg/L for pre and post monsoon 2008 |
Copper (Cu): Copper is an essential element in human metabolism and is considered to be non-toxic up to 0.05 mg/l concentration level[8]. Acute gastric irritation may be, observed in some individuals if drinking water contains cupper above 3 mg/l. The greatest danger of toxicity arises when children consume acidic beverages that have been in contact with copper container. In the ground water of the study area Cu values range between 0.0226 to 0.952 mg/l and 0.0205 to 0.887 mg/l thus all samples are well within the maximum permissible limit of 1.5 mg/l. The variation of concentration of Cu in ground water of pre and post monsoon 2008 is graphically express in figure 6.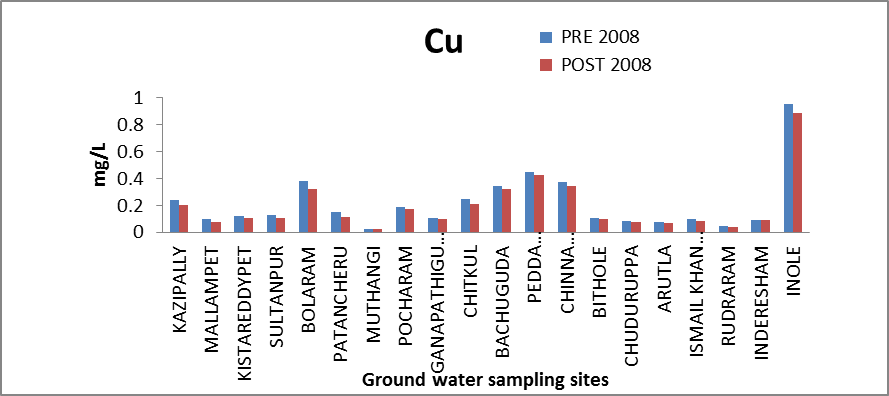 | Figure 6. Variation of concentration of Cu in mg/L for pre and post monsoon 2008 |
Zinc (Zn): Zinc is an essential and beneficial element in human as well as plant metabolism[11]. Zinc deficiency leads to dwarfism, dermatitis and loss in taste. Zinc concentration in groundwater samples ranges from 0.039 to 1.852 mg/l and 0.036 to 1.78 mg/l which is within the maximum permissible limit. Some samples with values of 1.5 mg/l may be considered to have safe but somewhat higher values. The variation of concentration of Zinc in ground water of pre and post monsoon 2008 is graphically express in figure 7.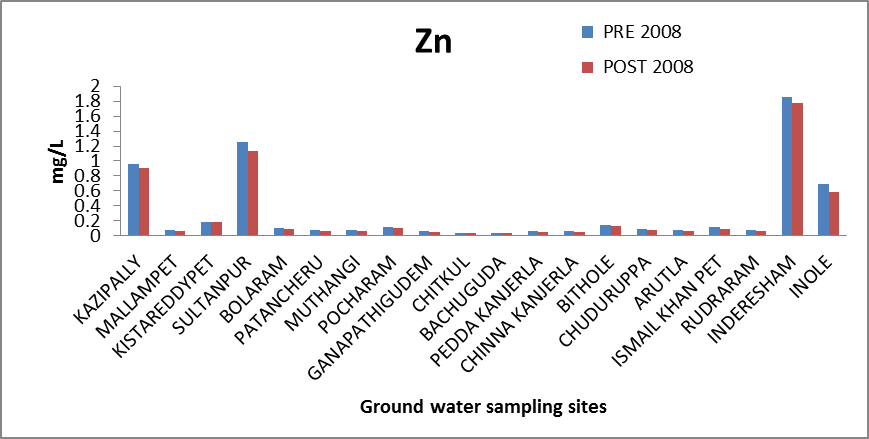 | Figure 7. Variation of concentration of Zn in mg/L for pre and post monsoon 2008 |
Arsenic (As): Arsenic is widely distributed throughout the earth's crust and it is toxic in nature. It is introduced into groundwater from industrial effluents, atmospheric deposition, and geological sources and also from pesticides which are widely used in the study area. The excess arsenic damages the skin, causes circulatory system problems and results in an increased risk of cancer. The desirable level of As is 0.05 mg/l[8]. The concentration of As in the ground water of the study area ranges from 0.057 to 0.551 mg/l and 0.046 to .455 mg/l. All the samples are having concentration of As higher than permissible limit. The variation of concentration of As in ground water of pre and post monsoon 2008 is graphically express in figure 8. The arsenic is discharge in larger quantities from industries; arsenic combine with organic effluents discharged by the industries to form non-degradable complexes which in turn may enters into ground water. Arsenic is highly concentrated in villages like Kazipally, Sultan pur, Ismail khan pet,Inderesham. In addition to industrial sources arsenic is also obtained from the weathering of rocks in which it is present as a sulfide. Arsenic contamination mainly from the paint pharmaceutical and tanning industries.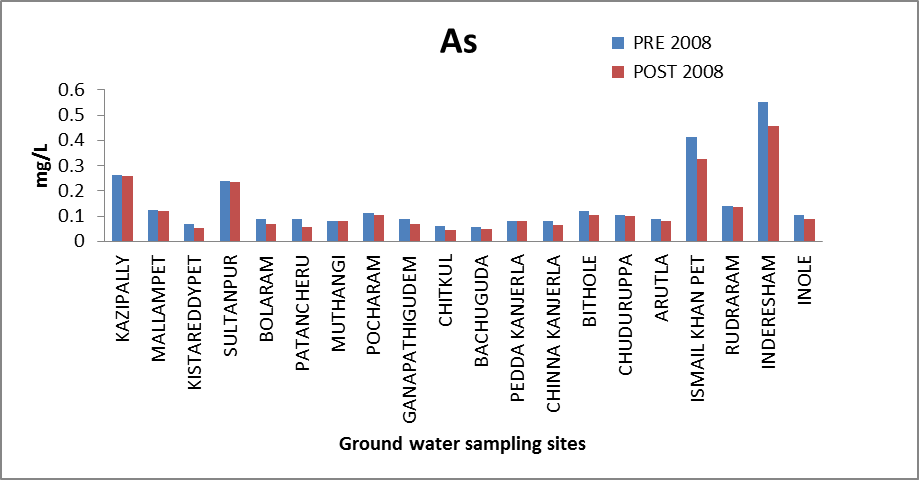 | Figure 8. Variation of concentration of As in mg/L for pre and post monsoon 2008 |
Cadmium (Cd): Cadmium is one of the most toxic metals to human being and animal[12]. Its sources may be fertilizers and local air pollution. Cadmium is known to cause kidney diseases[13,14], “itai-itai” disease[15] and is probably carcinogenic too. It effects cardio vascular system and may cause gastro intestinal upset, renal dysfunction, hypertension, growth inhibition, genetic defects and testicular tumors. Cadmium in the ground water of the study area ranges between 0.00001 to 0.0012 mg/l and 0.00001 to 0.0008 mg/l, in both seasons below permissible limit of 0.01 mg/l. The variation of concentration of Cadmium in ground water of pre and post monsoon 2008 is graphically express in figure 9.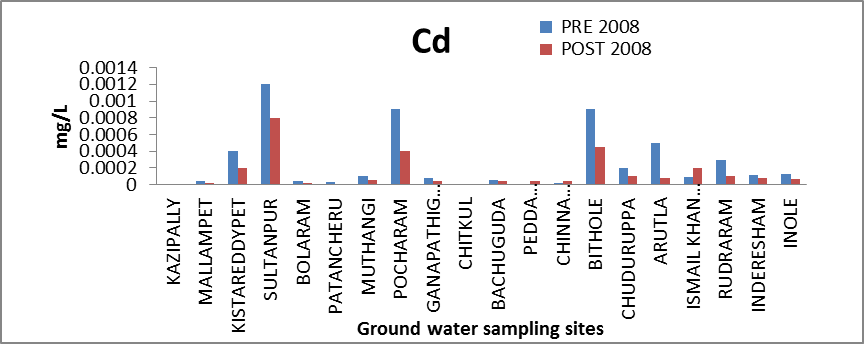 | Figure 9. Variation of concentration of Cd in mg/L for pre and post monsoon 2008 |
Boron (B): Boron compounds are released into water from industrial and domestic effluents. It is usually present in drinking water in concentrations of <1 mg/l, but some higher levels have been found as a result of naturally occurring boron[10]. Long-term exposure of humans to boron compounds leads to mild gastrointestinal irritation. In the ground water of the study area its concentration ranges from 0.156 to 2.513 mg/l and 0.125 to 2.114 mg/l in both seasons are within the maximum permissible value of 5 mg/l[8]. The variation of concentration of Boron in ground water of pre and post monsoon 2008 is graphically express in figure 10.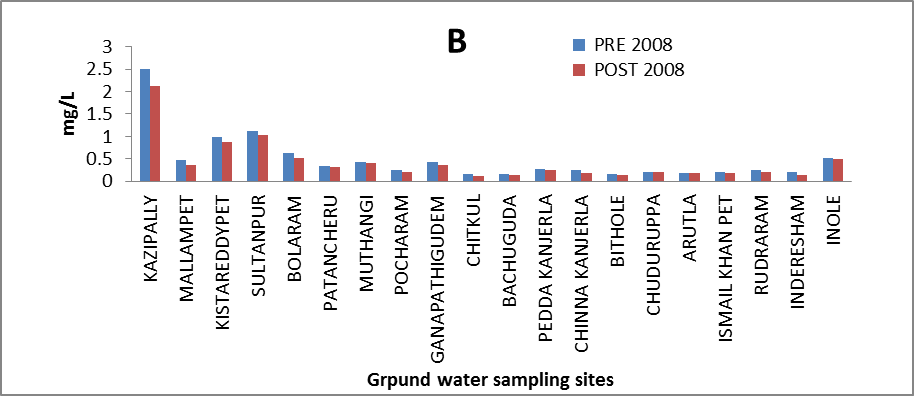 | Figure 10. Variation of concentration of Cd in mg/L for pre and post monsoon 2008 |
Lead (Pb): Lead concentration in natural waters increases mainly through anthropogenic activities . The possible sources of lead in groundwater are mainly diesel fuel consumed extensively in farming lands, discarded batteries, paint and leaded gasoline. Lead is also used in some pesticides such as lead arsenate. Lead concentration in drinking water is permissible up to 0.05 mg/l[8]. The Pb concentration in the ground water of the study area ranges from 0.0095 to .087 mg/l and 0.0078 to 0.078 mg/l in both the seasons. and out of 20 samples analyzed, two sample of pre-monsoon and one sample of post-monsoon have recorded concentration levels higher than the permissible limit. The variation of concentration of Lead in ground water of pre and post monsoon 2008 is graphically express in figure 11.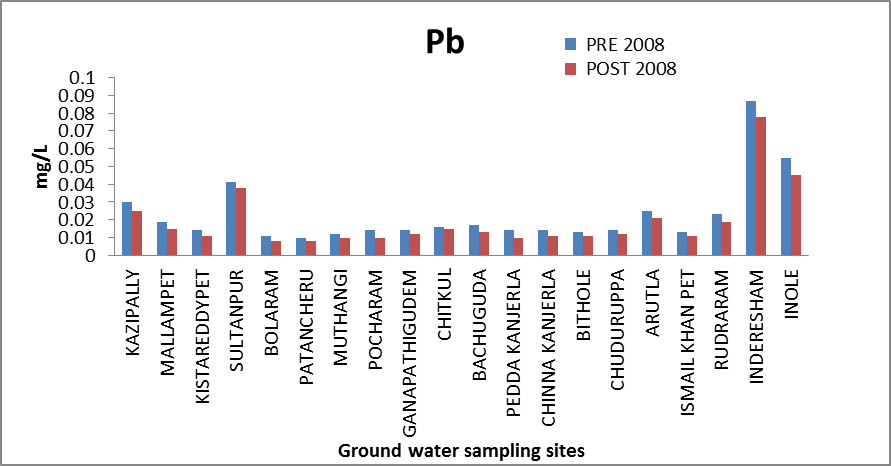 | Figure 11. Variation of concentration of Cd in mg/L for pre and post monsoon 2008 |
5. Conclusions
The data reveals that the ground water samples were highly contaminated with respect to Arsenic and iron as all the samples exceeds the permissible limits which can be attributed to indiscriminate waste disposal and adaptation of ineffective remedial techniques. Some trace constituents that are associated with industrial pollution such as arsenic and iron occurs in ground water at concentration that are higher enough to make that water unsuitable as drinking water. The trace element levels are very high, suggesting as origin from anthropogenic contamination in the study area. The villages that are worst affected are Sultan pur, Inderesham and Inole. The elements which are within permissible limit are Ni, Co, Zn, Cd, B. Therefore in order to restore the ground water quality there is need to stop the indiscriminate discharge of effluents. The study also shows the need for bioaccumulators that is capable of removing toxic metals from the study area.
ACKNOWLEDGEMENTS
The author thanks DrV.Balaram, Head Geochemistry Division, National Geo-physical Research Institute (NGRI), Hyderabad for his support.
References
| [1] | U.S.G.S. (1993): National water Summary-1990-1991: Stream Water Quality U.S.Geol. Surv. Water Supply paper No. 2400, 590p. |
| [2] | Deutch, W.J. (1997):Groundwater Geochemistry;Funadamentals and applications to Contamination, Lewis Publishers, New-York, 221pp |
| [3] | Chapman,D.(1992): Water Quality Assessments, Published on behalf of UNESCO/WHO/UNEP, Chapmen & Hall Ltd., London, 585p. |
| [4] | Domenico, P.A. and Schwartz, F.W. (1998): Physical and Chemical Hydrogeology, IIndEdtn. John Wiley and Sons, INC, 495p. |
| [5] | Satyanarayanan et al (2007): Assessment of ground water quality in a structurally deformed granitic terrain in Hyderabad India, Environ. Monit. Asst. v 131 pp117-127. |
| [6] | Goel, P.K. (1997): Water Pollution causes effect and control, New Age International Publishers, 269p |
| [7] | Sawyer, C.N. and Mccarty, P.L. (1978): Chemistry of environmental engineering, 3rdedn. Series in Water Resources and Environmental Engineering. McGraw-Hill, New York. |
| [8] | B.I.S. (1991): Indian standard specifications for drinking water, B.S. 10500 |
| [9] | APHA, (1992): Standard Methods for Analysis of Water and Waste Water,18th Edition, American Public Health Association, Inc, Washington DC. |
| [10] | W.H.O. (1994): Guidelines for drinking water quality, v.1.WHO, Geneva |
| [11] | Pawar, N.J. and Nikhumbh, J.D. (1999): Trace Element Geochemistry of Groundwater from Behedi Basin, Nasik District, Maharashtra. Jour. Geol. Soc. India., v. 54, pp.501- 514. |
| [12] | Friborget, L., Piscastor, M., Nordberg, G.F. and Kjellstrom T.T. (1974): Cadmium in the Environment, 2nd, Ed. CRC Press, Cleveland, Ohio. 248p. |
| [13] | Colucci AV, Winge D, Krasco J (1975): Cadmium accumulation in the rat liver, Arch. Environ. Health. V.30:153-157 |
| [14] | Itokawa et al (1974): Renal and Skeletal lesions in experimental cadmium poisoning, Arch. Environ. Health. v.28, pp.149-154 |
| [15] | Kobayashi, J. (1970): Relation between the Itai- Itai disease and the pollution of water by cadmium from a mine. 5th International Water Pollution Research Conference., I-15, pp.1-7. |


 Abstract
 Reference
 Full-Text PDF
 Full-text HTML