-
Paper Information
- Previous Paper
- Paper Submission
-
Journal Information
- About This Journal
- Editorial Board
- Current Issue
- Archive
- Author Guidelines
- Contact Us
American Journal of Chemistry
p-ISSN: 2165-8749 e-ISSN: 2165-8781
2013; 3(4): 105-113
doi:10.5923/j.chemistry.20130304.03
NQS Assisted Spectrophotometric Determination for Aliskiren in Pharmaceutical Dosage Form
 Abstract
 Reference
 Full-Text PDF
 Full-text HTML
Mohamed B. Abuiriban, Mai A. Ramadan
Department of Pharmaceutical Chemistry, Al-Azhar University-Gaza, Gaza, 00972, Palestine
Correspondence to: Mohamed B. Abuiriban, Department of Pharmaceutical Chemistry, Al-Azhar University-Gaza, Gaza, 00972, Palestine.
| Email: |  |
Copyright © 2012 Scientific & Academic Publishing. All Rights Reserved.
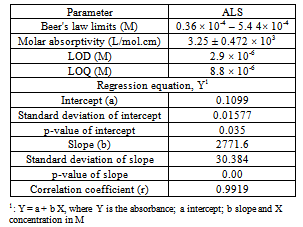
A new method has been developed for the determination of Aliskiren (ALS) via derivatization with 1,2-naphthoquinone-4-sulfonate (NQS). This method was based on the formation of an orange-red colored product from the reaction between ALS and NQS in NaOH solution exhibiting maximum absorption at 500 nm. Different experimental parameters, as well as stoichiometry of reaction were investigated and reaction mechanism was postulated. Under the optimized reaction conditions, Beer's law was obeyed in the range of 0.36 × 10⁻⁴ – 5.44 × 10⁻⁴ M with a correlation coefficient (r = 0.9919). The limits of detection (LOD) and quantification (LOQ) were 2.9 × 10⁻⁶ and 8.8 × 10⁻⁶ M, respectively. Recovery values were in the range of 99.17-100.65 with relative standard deviation (RSD) not higher than 1.7%. The RSD for intra- and inter-assay precisions did not exceed 2%. The developed method was applied successfully for determination of ALS in its pharmaceutical tablets and compared statistically with a reference method. This method is easy to use, accurate and highly cost-effective for routine analysis of ALS in quality control laboratories.
Keywords: Aliskiren, 1,2-Naphthoquinone-4-Sulfonate, Derivatization, Spectrophotometry, Validation
Cite this paper: Mohamed B. Abuiriban, Mai A. Ramadan, NQS Assisted Spectrophotometric Determination for Aliskiren in Pharmaceutical Dosage Form, American Journal of Chemistry, Vol. 3 No. 4, 2013, pp. 105-113. doi: 10.5923/j.chemistry.20130304.03.
Article Outline
1. Introduction
- In the last thirty years ago, an intensive effort with several in vitro and in vivo studies has been focused on the development of effective and long-acting orally renin inhibitors[1]. ALS (Scheme 1) is the first oral direct renin inhibitor approved recently in 2007 for the treatment of essential hypertension as mono or in combination therapy[2].ALS is a new drug, which until now has not compendia monographs in European, British and US pharmacopoeial. Literature survey revealed that some analytical methods for determination of ALS in pharmaceutical dosage forms have been reported. The major reported analytical methods were by chromatographic techniques[3-8], which were more complex, sophisticated, generate large amount of waste and were considered as more time-consuming. Some reported HPLC[3], direct spectrophotometric[9] and MEKC[10] methods were not sensitive enough with the initial determined concentration of ALS (0.45 × 10⁻⁴, 0.73 × 10⁻⁴ and 1.08 × 10⁻⁴ M, respectively). For these reasons and novelty of the drug, the development of new sensitive, selective and simple technique is very essential. The UV-VIS spectrophotometer is widely used in quality control of pharmaceutical products due to its low cost, robust instrumentation and procedures are generally simple, fast, accessible and well-performed. However, to enhance the sensitivity and selectivity of this method derivatization reaction is necessary. The choice of a robust, simple and efficient derivatization reaction is the first and most critical step for a successful and reproducibly applicable spectrophotometric method. The reported derivatization spectrofluorometry of ALS[11] need several steps, which include extraction by organic solvent before measurements.
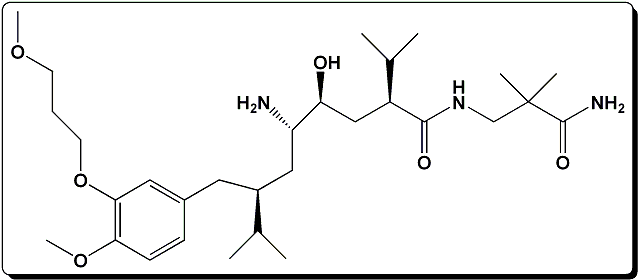 | Scheme 1. Chemical structure of aliskiren (free base) |
2. Experimental
2.1. Materials and Reagents
- All reagents and solvents were of analytical reagent grade. ALS was kindly supplied by Novartis Pharmaceutical (Egypt) and its film-coated Tekturna® tablets containing 300 mg of ALS were obtained from local pharmacy in Gaza-Palestine. NQS was purchased from Searle company (England).
2.2. Apparatus
- A Shimadzu UV-VIS spectrophotometer model 1601 (Tokyo, Japan) with 1 cm path length quartz cell was used for the absorbance measurements. Measurements of pH were made with WTWpH 526 digital pH Meter. Water was purified by aquaMAXTM-ultra, Young-lin instrument (Korea) ultra water purification system. Systonics electronic balance was used for weighing the samples.
2.3. Preparation of Standard and Sample Solutions
2.3.1. Stock Standard Solution of ALS (1.81 × 10⁻³ M)
- ALS stock solution was prepared by dissolving 100 mg ALS base powder in distilled water and diluted to 100 ml (stock solution was freshly prepared during the use). Working solutions were prepared by diluting the stock solution.
2.3.2. NQS Reagent (1.9 × 10⁻² M)
- 250 mg NQS powder was accurately weighed, dissolved in 10 ml distilled water and diluted to 50 ml. The solution was freshly prepared and protected from light.
2.3.3. NaOH Solution (0.01 M)
- 200 mg NaOH flacks was accurately weighed, dissolved in distilled water and diluted to 500 ml.
2.3.4. Tablets Sample Solution
- Ten tablets were weighed accurately and pulverized. Then an accurately weighed amount equivalent to 100 mg of ALS was transferred into a 100 ml calibrated flask, and dissolved in about 70 ml distilled water for 5-10 minutes. The content was filtered and diluted to 100 ml, to obtain a solution with concentration of 1.81 × 10⁻³ M. The prepared solution was diluted quantitatively to obtain a suitable concentration for analysis. The procedure was followed as described below.
2.4. General Procedure
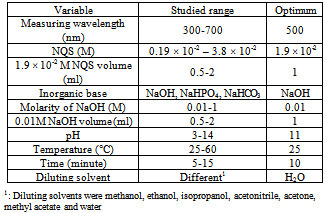
- A 1 ml of 1.81 × 10⁻³ M ALS was transferred into a 10 ml standard flask. 1 ml 0.01 M NaOH and 1 ml 1.9 × 10⁻² M NQS were added sequentially and mixed well. The content was allowed to stand at room temperature for 10 minutes after that diluted to the mark with distilled water. The absorbance of the solution was measured at 500 nm against blank reagent prepared similarly without the drug.
2.5. Stoichiometric Ratio of the Reaction
- Job's[13] and Limiting logarithmic methods[14] were employed to determine the composition of the reaction product between ALS and NQS.
2.5.1. Job's Method
- Equimolar (5 × 10⁻³) aqueous solutions of NQS and ALS were prepared. Series of 1 ml portions of the master solutions of NQS and ALS were made up comprising different complementary proportions (0:1, 0.1:0.9, 0.2:0.8, 0.3:0.7, 0.4:0.6, 0.5:0.5, 0.6:0.4, 0.7:0.3, 0.8:0.2, 0.9:0.1 and 1:0) in 10 ml volumetric flasks, respectively. 1 ml 0.01 M NaOH was added to every solution. The solutions were allowed to stand for 10 minutes at room temperature and completed with distilled water. The mole fraction of NQS were calculated and plotted versus absorbances obtained. The mole ratio of NQS and ALS was determined.
2.5.2. Limiting Logarithmic Method
- Two sets of experiments were carried out employing the general procedure. The first set of experiment was carried out using varying concentrations of NQS (1.9 × 10⁻³ – 19.2 × 10⁻³ M) at a fixed ALS concentration (1.8 × 10⁻⁴ M). The second set of experiment was carried out using varying concentrations of ALS (0.4 × 10⁻⁴ – 5 × 10⁻⁴ M) at a fixed concentration of NQS (1.9 × 10⁻² M). The logarithms of the obtained absorbances for the reaction of ALS with NQS were plotted as a function of the logarithms of the concentrations of NQS and ALS in the first and second sets of experiments, respectively. The slopes of the fitting lines in both sets of experiments were calculated.
3. Results and Discussion
3.1. Absorption Spectra
- It was found that ALS exhibits λmax at 279 nm. Because of the blue-shifted λmax of ALS, its determination in pharmaceutical formulations based on the direct measurements of its absorption for UV light is susceptible to potential interferences from co-extracted excipients. Therefore, derivatization of ALS to a more red-shifted derivative was necessary. ALS contains a primary amino group for which many chromogenic reagents are available for color-producing reactions. The derivatization reaction between ALS and NQS was performed and the absorption spectra of the reaction product was recorded against reagent blank (Figure 1). Obviously, the λmax of product was red-shifted from the underivatized ALS by 221 nm.
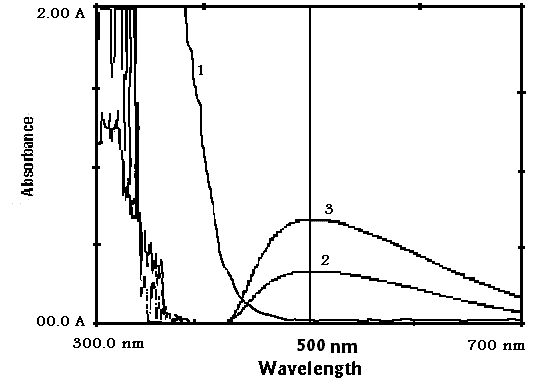 | Figure 1. Absorption spectra: (1) blank spectrum against water; (2) and (3) the reaction product of ALS 0.91 × 10⁻⁴ and 1.81 × 10⁻⁴ M with NQS against blank, respectively |
3.2. Optimization of Reaction Conditions
- Derivatization using NQS has attracted considerable attention for quantitative analysis of many pharmaceutically active compounds[15-17]. The developed method was based on the nucleophilic substitution reaction between ALS and NQS in alkaline media. Optimization of the reaction conditions were investigated to achieve maximum absorption and determined via a number of preliminary experiments.
3.2.1. Effect of NQS Concentration and Volume
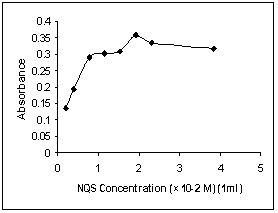 | Figure 2. Effect of NQS concentration on the reaction |
3.2.2. Effect of Alkalinity and PH
- To activate the nucleophilic substitution reaction and to generate the nucleophiles from ALS, alkaline medium was necessary. Different inorganic bases were investigated (NaOH, NaHPO4 and NaHCO3). Best results were obtained in case of NaOH in the concentration of 0.01 M (1 ml) solution. The reaction did not proceed without alkaline medium. The influence of pH on the reaction was investigated by carrying out the reaction in 0.1 M phosphate buffer of different pH values[18] (Figure 3). The results revealed that ALS has difficulty to react with NQS in pH < 6 (acidic media). This was possibly due to the existence of the amino group of ALS in the form of hydrochloride salt, thus it loses its nucleophilic substitution affinity. As the pH increased, the absorbances increased rapidly, as the amino group of ALS turns into the free amino group, thus facilitating the nucleophilic substitution. The maximum absorbance was attained at pH 11. At higher pH, the absorbance was decreased. This was attributed probably to the increase in the amount of hydroxide ion that holds back the reaction of ALS with NQS. Moreover, the high basic media may lead to a hydrolysis of ALS, as well as the reaction product. Other reason for decreasing the absorbance of reaction product may be the instability of NQS in high basic media[19].
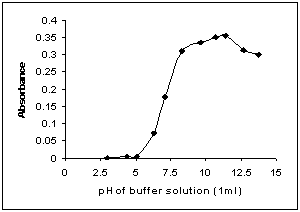 | Figure 3. Effect of pH on the reaction |
3.2.3. Effect of Temperature and Time
- There were negligible differences between absorbances that have been obtained at room temperature and those at elevated temperatures up to 50°C, beyond which the absorbances decreased. Moreover, it was found that the reaction goes to almost completion within 5 minutes. In order to establish simple analytical procedure and for higher precision; all subsequent experiments were carried out at room temperature for 10 minutes.
3.2.4. Effect of Diluting Solvent
- Upon diluting the reaction solution with water, transparent solution was obtained indicating the solubility of the product and possibility of using water as diluting solvent. However, several organic solvents (methanol, ethanol, isopropanol, acetonitrile, acetone and methyl acetate) were tested and compared with water (Figure 4).
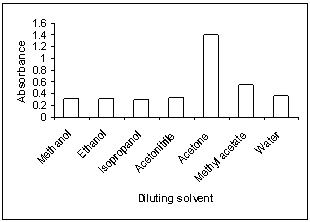 | Figure 4. Effect of diluting solvent on the reaction |
3.2.5. Stability of Product Chromogen
- It was found that the absorbance of the product remains stable for at least 2 hours (Figure 5). This allowed the processing of large batches of samples with comfortable measurements. This gives the high throughput property to the developed method when applied for analysis of large number of samples in quality control laboratories.
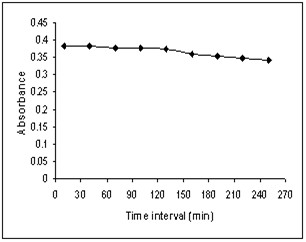 | Figure 5. Stability of product chromogen |
3.3. Stoichiometric Ratio of the Reaction
- The result of Job's method (Figure 6) indicates a molar ratio 2:1 of NQS to ALS. In Limiting logarithmic method, two straight lines were obtained (Figure 7). The values of the slopes of these lines were 1.979 and 1.0324, confirming the 2:1 ratio.
3.4. Reaction Mechanism
- It has been reported that NQS could react with amino group of primary and secondary amine derivative[25], as well as amino group of primary and secondary amide derivative[26, 27]. Similarly, amino group of ALS at carbon atom no. 5, taking on nucleophilicity due to the lone pair of nitrogen atom, trends to attack on the electron-deficient center on NQS, namely carbon atom no. 4 (3,4 carbon double bond can conjugate with carbon no. 2 and oxygen atom become electron rich, as a result carbon no. 4 becomes electron deficient center). Moreover, terminal amino group of primary amide on ALS reacted also with other NQS molecule. According to the results obtained, two molecules of NQS could react with two amino groups on ALS. The postulated reaction mechanism is shown in scheme 2.
3.5. Validation of the Method
- The validation parameters of the method were carried out according to ICH guidelines by determining of the following parameters: linearity, range, specificity, accuracy, and precision, as well as LOD, LOQ, robustness and ruggedness[12].
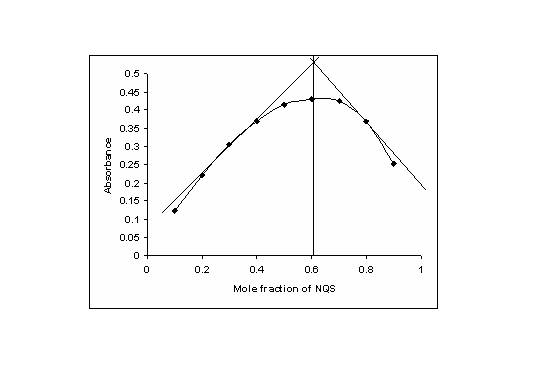 | Figure 6. Stoichiometry of the reaction between ALS and NQS adop ing Job's method |
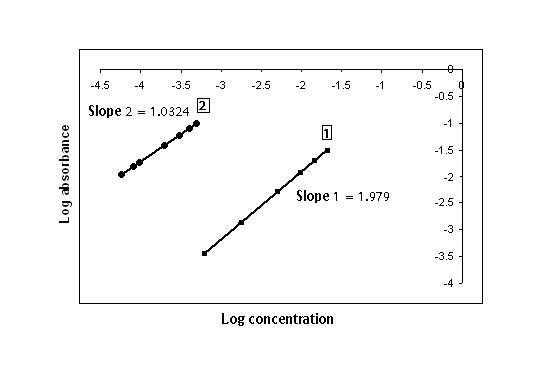 | Figure 7. Limiting logarithmic plot for molar reactivity of NQS and ALS: (1) first set of experiments, NQS concentrations (1.9 × 10⁻³ – 19.2 × 10⁻³ M) at ALS concentration (1.8 × 10⁻⁴ M); (2) second set of experiments, ALS concentrations (0.4 × 10⁻⁴ – 5 × 10⁻⁴ M) at NQS concentration (1.9 × 10⁻² M) |
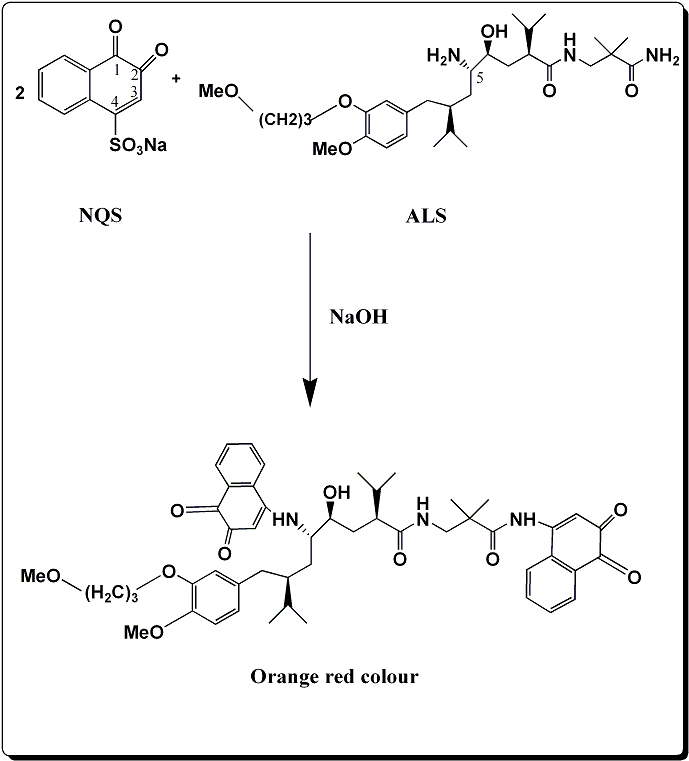 | Scheme 2. Suggested reaction mechanism of ALS with NQS |
3.5.1. Linearity and Range
|
|
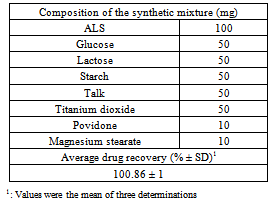
3.5.2. Specificity
- Specificity was investigated by adding appropriate levels of excipients to the drug and analysis by the developed method as described under 2.4. The average recovery value of three determinations was 100.86 ± 1% (Table 3). The results confirmed the absence of interferences from common excipients with ALS analysis by the method.
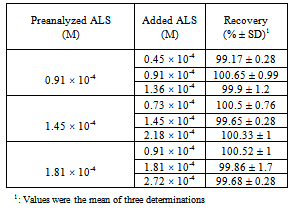
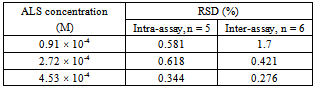
3.5.3. Accuracy and Precision
- Accuracy was determined by adding known quantities of ALS standard (50%, 100% and 150%) to a preanalyzed drug product of 3 different concentrations (0.91 × 10⁻⁴, 1.45 × 10⁻⁴ and 1.81 × 10⁻⁴ M) and calculates the percent of drug recovery (Table 4).
|
|
|
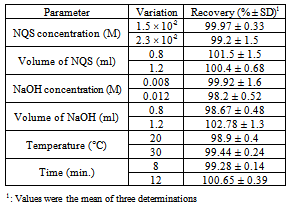
3.5.4. Robustness and Ruggedness
- Robustness was examined by evaluating the influence of small variation in the method variables on its analytical performance. One parameter was changed while the others were kept unchanged and recovery percentage was calculated each time. It was found that small variation in the method variables did not significantly affect the procedures; recovery value was 98.2 - 102.78 ± 0.14 – 1.6% (Table 6).
|
|
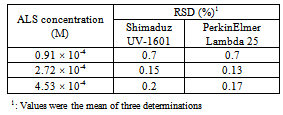
3.6. Application of the Method
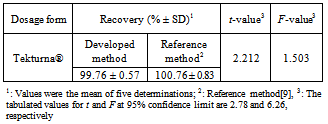
- The pharmaceutical dosage form was subjected to the analysis of their ALS content by the developed method and compared with a reference one[9]. The label claim percentage was 99.76 ± 0.57. This result was compared with that obtained from reference method by statistical analysis with respect to the accuracy by t-test and precision by F-test (Table 8). No significant difference was found at 95% confidence level providing similar accuracy and precision in the determination of ALS by both methods.
|
4. Conclusions
- Spectrophotometric analysis continues to be one of the most widely used analytical techniques available. The present study described, for the first time, the successful evaluation of NQS as a derivatization reagent in the development of simple, sensitive, cheap and rapidspectrophotometric method for the accurate determination of ALS in pharmaceutical dosage form. Moreover, present method was less environmentally toxic, employing mainly distilled water as solvent.
ACKNOWLEDGMENTS
- I would like to thank Novartis Pharmaceutical (Egypt) for supplying ALS standard.