-
Paper Information
- Next Paper
- Previous Paper
- Paper Submission
-
Journal Information
- About This Journal
- Editorial Board
- Current Issue
- Archive
- Author Guidelines
- Contact Us
American Journal of Chemistry
p-ISSN: 2165-8749 e-ISSN: 2165-8781
2012; 2(6): 312-321
doi: 10.5923/j.chemistry.20120206.04
Two-Dimension Study of Methanol Internal-Overall Rotation in Argon Matrix
 Abstract
 Reference
 Full-Text PDF
 Full-Text HTML
G. А. Pitsevich, A. E. Malevich
Belarusian State University, Minsk, Belarus
Correspondence to: G. А. Pitsevich, Belarusian State University, Minsk, Belarus.
| Email: |  |
Copyright © 2012 Scientific & Academic Publishing. All Rights Reserved.
In the approximation B3LYP/cc-pVTZ, the geometry of a methanol molecule surrounded by eight argon atoms has been optimized. By the independent rotation of the methyl and the hydroxyl groups at the fixed position of the C-O bond relative to the argon atoms there was obtained the two-dimensional grid of values of the internal-overall rotation energy. Despite the fact that, initially the energy was calculated for 65 points in the square  , the presence of
  period for methyl group rotation has allowed to increase the number of points up to 195. The analytical approximation for internal rotation energy was found. Two dimensional Schrödinger equation for internal rotation – overall rotation of rotator with fixed axis was solved, energy levels, wave functions and transition probabilities were found. According to the results of these computations, degeneracy of the Е-type states is relieved with increase in splitting of the ground torsional state.
Keywords: Methanol, Internal-Overall Rotation, Large Amplitude Motion, Argon Matrix
Cite this paper: G. А. Pitsevich, A. E. Malevich, "Two-Dimension Study of Methanol Internal-Overall Rotation in Argon Matrix", American Journal of Chemistry, Vol. 2 No. 6, 2012, pp. 312-321. doi: 10.5923/j.chemistry.20120206.04.
Article Outline
1. Introduction
- It is known that low-temperature IR spectra of molecules in the matrix isolation characterized by narrow absorption bands due to the absence of intermolecular interactions and the rotational structure. However, matrix effects do exist[1- 3] and they are often able to significantly complicate the interpretation of the spectra. These effects are mainly determined by stacking order of the matrix atoms around the trapped molecule. Therefore, modelling of the matrix structure and its influence on the vibrational spectra of the trapped molecules is an interesting and important task. Theoretical study of the matrix influence on the trapped molecules began only two decades after the first experimental works. Effective interaction potentials were studied first using semi-empirical and ab initio calculations[4,5]. Later the supermolecule approach was applied to examine the effects on the structure and spectra of the ammonia-hydrogen halide complexes of adding 3 Ne or 3 Ar atoms[6,7]. Significant effects were calculated, particularly for the HBr complex. Latajka[8] examined the effects of adding up to 4 N2 molecules to the ammonia-hydrogen chloride complex and found that 3 N2 molecules gave similar results to a cavity model in a medium with a relative permittivity of 1.5. Matrix effects on proton transfer in hydrogen – bonded molecular complexes were studied by Barnes[9]. As demonstrated by the recent studies [10-12], the matrix affects to the values of the internal rotation barriers in a methanol molecule, that is reflected by changes in splitting of the torsional states if compare with gas phase. Previously[13], in FTIR spectra of methanol recorded at a temperature of 10 K in the argon matrix such an effect has been considered as one of the possible mechanisms responsible for the appearance of a multiplet structure of some absorption bands, in particular a doublet of the bands at 1033.25 and 1036.5 cm-1 caused by the valence vibration of С–О bond. As far as we know, at the moment there are no theoretical works that investigate the influence of the matrix environment on the torsional motion in methanol molecule. In[14] a geometric model of a methanol molecule in the environment of eight argon atoms was proposed and approximately, using a one-dimensional approach, the problem of finding the torsional energy levels was solved. According to the computational results obtained, splitting of the ground torsional state is somewhat increased. Besides, splitting of the Е-type degenerate states occurs due to the relieved degeneracy. However, the more accurate two-dimensional solution is possible and is presented in this paper.
2. Computation Method
- In approximation B3LYP/cc-pVTZ a configuration of the complex including a molecule of methanol and eight argon atoms was optimized using the package GAMESS[15]. The gradient convergence tolerance parameter OPTTOL was set to 10–5. No imaginary frequencies were found for optimized configuration. Positions of Ar, C and O atoms were fixed and independent rotation of O-H and CH3 groups with respect to the argon atoms was performed. Zero values for
 and
and  were taken for optimized configuration. As it was found that the internal forces in a methanol molecule were greater than the interacting forces with the matrix, on optimization for all the parameters characterizing a position of СН3ОН molecule in the matrix, the methyl group rotation relative to the argon atoms was accompanied by the hydroxyl group rotation, and vice versa. Because of this, in the case of a methyl group rotation by steps of 50º the hydroxyl group position was additionally fixed relative to the matrix, and vice versa – for rotation of a hydroxyl group the position of a methyl group was fixed. Besides, all other internal parameters of СН3ОН were optimized. Then for every value of φOH = 0º, 50º, 100º, 150º, 200º, 250º, 300º, 350º relative argon atoms the value of
  = 0º, 50º, 100º, 150º, 200º, 250º, 300º, 350º relative argon atoms too were taken.As an approximation in the process of the subsequent computations, the geometric parameters of methyl and hydroxyl tops were considered to be constant. According to[14], the moments of inertia are as follows:IOH =1.38866 10-47 kg·m2 ;
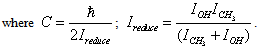
  =5.26205 10-47 kg·m2Because of 120º period for rotation of a methyl group, cloning of the points was performed using the following relation for the internal rotation energy:
 here m=1,2.As a result, the total number of points on the potential surface, where the energy values have been computed, amounted to 195. A change in the internal energy due to changing of the coordinates
  and
and  is defined as
  .Using the package Mathematica[16], an analytical expression for the potential energy of internal rotation was derived in the following form:
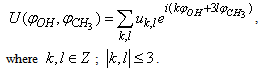 | (1) |
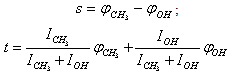 | (2) |
 | (3) |
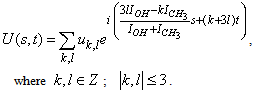
 and U(s,t) are shown in Fig. 1
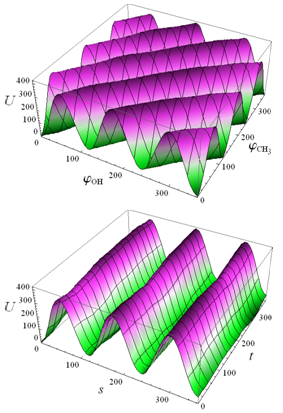 | Figure 1. Potential energy of internal-overall rotation of an methanol molecule in the argon matrix when setting the coordinates  (on the left) and s, t (on the right) (on the left) and s, t (on the right) |
 , but in expression (3) the coefficient of s is not a rational number and internal rotation of a methanol molecule in the argon matrix is aperiodic. At the same time, as seen from Fig. 1, the principal change in the internal energy of the molecule is caused by changing of an internal rotation angle for s.
3. No Rotation of Methanol Molecule as a Whole with Respect to ArgonMatrix
- Experimental spectra for methanol in the argon matrix demonstrate the absence of the rotational structure of vibrational absorption bands as actually there is no rotation of the molecule as a whole, yet exhibiting the bands due to torsional motion in СН3ОН. Because of this, it is desirable to consider the case of pure internal rotation in this molecule. According to the computational results, a minimum on the potential surface
 is attained at the point with the coordinates
  and, with regard to (2), on the surface
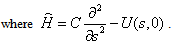
  it is also attained at the point with the coordinates s = t = 0. When there is no rotation of the molecule as a whole, an internal rotation is realized along the axis s. We can derive the form of a curve for the internal rotation potential energy from U(s,t) setting t equal to zero. The curve for U(s,0), its periodic part and perturbation, is given in Fig. 2. A Schrödinger equation for internal rotation takes the form
 | (4) |
 | (5) |
 | Figure 2. Potential energy as a function of internal rotation angle s (green), its periodic component (blue), and matrix perturbation (red) |
 | (6) |
 | (7) |
 | (8) |
 | (9) |
 . Then
 , where p0 is a constant insignificant for further computations. Next we introduce
 . Then from the second equation of (2) for t = 0 we obtain
 . Substituting this expression into the first equation of (2), we get
 . In this way we have
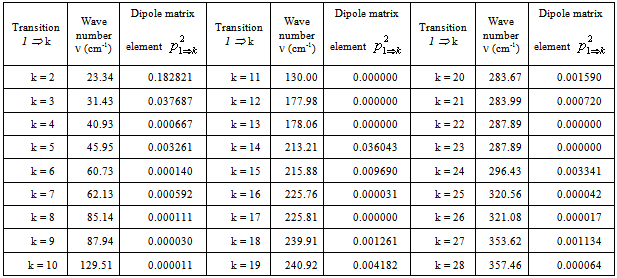
 . Matrix elements of the dipole matrix operators were computed by the formula
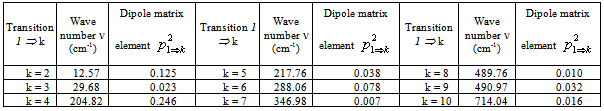
 .The squared matrix elements are listed in Tab. 2. Fig. 4 presents a theoretical IR absorption spectrum computed in the case of internal rotation in the methanol molecule surrounded by 8 argon atoms at a temperature of 0 К, based on the data in Tabs. 1 and 2.
|
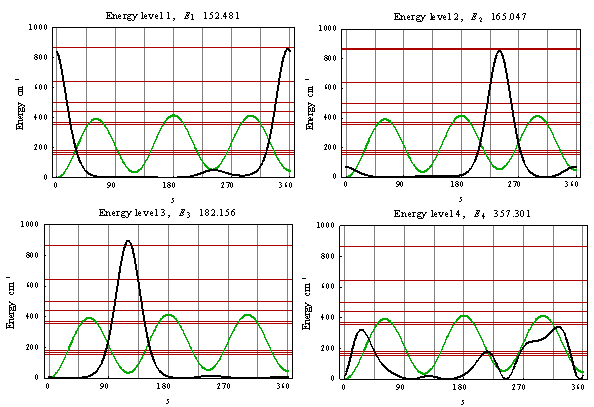 | Figure 3. Torsional wave functions of CH3OH in the argon matrix in the ground state (upper left plot) and in the three excited torsional state |
 | Figure 4. Computed torsional IR spectrum for СН3ОН in the argon matrix |
4. Rotation of Methanol Molecule in Argon Matrix with Respect to С-О Axis
- If we assume that there is no internal rotation in methanol, but there is rotation of the molecule as whole with respect to the axis coincident with С-О bond, then such a rotation is no longer free in the surroundings of argon atoms. A function for the molecular rotation potential energy may be derived from U(s,t) provided s is zero. The curve for U(0,t) is shown in Fig. 5.To find the energy levels, we solve a Schrödinger equation of the following form:
 | (10) |
 .Because U(0,t) is a periodic function, (10) is solved as a linear combination of the eigenfunctions for a free top with the fixed rotation axis
 | (11) |
 | (12) |
 | (13) |
 | Figure 5. Potential energy of interaction between methanol molecule and argon matrix as a function of rotation angle t |
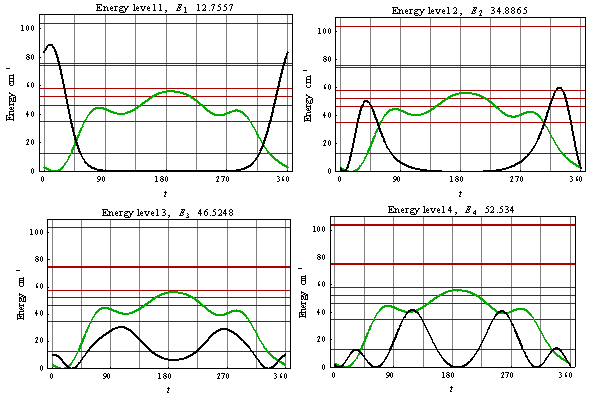 | Figure 6. Rotational wave functions of CH3OH in argon matrix in the ground state (upper left plot), in the three excited rotational states |
|
5. The Case of Motion of Two Types
- The results presented in Sections 3 and 4 show that the potential barriers of internal rotation are considerably higher than those associated with rotation of the methanol molecule as a whole relative to С-О bond, in the surroundings of argon atoms. In principle, there are no factors capable to strictly forbid both types of motion simultaneously. Because of this, we must consider this case as well. As the potential energy is a periodic function for both the coordinates
 and
and 
 , a problem of two-dimensional large-amplitude motion is readily solved with the use of precisely these coordinates. A Schrödinger equation in this case takes the form:
 | (14) |
 ;
;  .Let the potential energy be given in the more general form then (1):
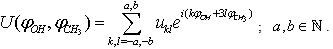 | (15) |
 | (16) |
 | (17) |
 . In the second term the following condition must be fulfilled:
 | (18) |
 | (19) |
 ;
;  . This means that n and m are varying within the limits from –c to c per unity. From (19) we derive:
 | (20) |
 , where
  – column vector that, according to (16), gives the wave function corresponding to the energy Ej. It is clear that a pair of the indices
  numbers rows of the Hamiltonian matrix and a pair of the indices (n,m) – its columns. Next, to derive the Hamiltonian matrix from (20), first we have to fix an order of the coefficients bn,m in the column vector of the wave function defined by equation (16). For example, if c = 1, the transposed column vector may be of the form:
 | (21) |
 numbering rows of the Hamiltonian matrix. Then a matrix element of H is numbered by two index pairs,
  . Considering that usually
  , for the diagonal element
  we can write:
 | (22) |
 | (23) |
 | (24) |
 ;
;  . Specifically, in the case given by (21) for i = 3 we have
  ;
;  ; and for j = 6 we have
  ;
;  . The formation of the matrix H takes the following form:
  | (25) |
 | (26) |
 | (27) |
 As a result of the Hamiltonian matrix diagonalization according to (25–27), the energies and wave functions characterizing torsional-rotational states of a methanol molecule surrounded by argon atoms have been computed. The energy levels are presented in Tab. 4; some wave functions are shown in Fig. 7.Matrix elements of the dipole moment components can be computed with the use of
  . The following expression is used:
 .The squared matrix elements of the dipole moment operator are given in Tab. 5. Fig. 8 shows the computed IR absorption spectrum.
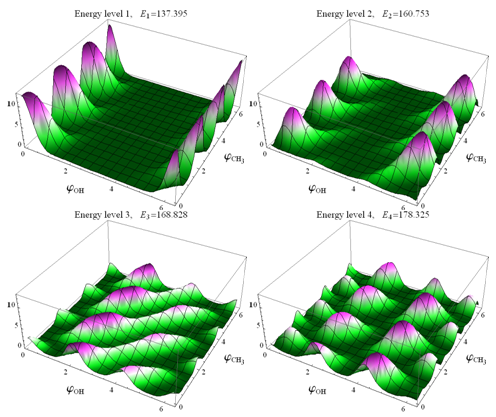 | Figure 7. Torsional-rotational wave functions of CH3OH in argon matrix |
|
|
 | Figure 8. Computed IR torsional-rotational spectrum for СН3ОН in argon matrix |
6. Discussion
- Despite the fact that in the case of torsional-rotational motion there is a greater number of the computed vibrational frequencies over the spectral region 0–500 cm-1 compared to the case of pure torsional motion, with due regard for the dipole moment matrix elements, the spectra shown in Figs. 4 and 8 are found very similar. Inclusion of the rotation leads to a blue shift of the absorption bands doublet in the region 0–50 cm-1 and to a considerable increase of its relative intensity. A similar blue shift is also observed for the doublet of absorption bands in the interval 200–250 cm-1. The presence of a high-intensity absorption band in the spectral region 275–300 cm-1 seems to be the principal feature distinguishing the torsional spectrum as compared to the torsional-rotational IR spectrum. With inclusion of a rotation motion, in this interval a low-intensity doublet of absorption bands is observed. Though the proposed model including the argon matrix effect on a torsional-rotational spectrum for a methanol molecule is far from being perfect, it is interesting to correlate the computational results and experimental data. Unfortunately, in[13] IR spectra for a methanol molecule in the argon matrix have been recorded over the region 400–4000 cm-1. In[17] the spectrum given for methanol in the argon matrix exhibits an absorption band at 271.5 cm-1 and reveals a growth of the intensity in the region of 213 cm-1, where recording of this spectrum comes abruptly to an end. As a result, computations of normal vibrations were performed considering the only band at 271.5 cm-1. In[18] an IR spectrum for a methanol molecule in the argon matrix is given in the region 40–4000 cm-1. Taking into account limitations of the model and the assumptions made in the process of computations, a similarity of the computational results and experimental spectra is remarkable. Some of the absorption bands in the interval 40–120 cm-1 are assigned by the authors as phonon bands. In the spectral region 40–400 cm-1, apart from these bands, two more absorption bands are observed at 223 and 272 cm-1, the first of them having a higher intensity. Besides, a half-width of the band at 223 cm-1 is no less than 10 cm-1, and this is not typical for spectra for the isolated matrix which are recorded at 10 К. The band profile seems to be indicative of a doublet of the overlapping absorption bands. As an intensity of the absorption band at 272 cm-1 is rather high the computed torsional spectrum for a methanol molecule seems to be closer to the experimental one. Thus, the band at 272 cm-1 may be correlated to the computed absorption band at 288.06 cm-1, and a wide high-intensity band at 223 cm-1 – to a doublet of the computed bands at 204.82 and 217.76 cm-1. It is possible to assume that a good agreement between the theoretical and experimental spectra is due to the fact that in all the cases we deal with practically undisturbed torsional motion in a molecule of methanol. But, according to[14,19–22], a pure torsional spectrum of a methanol molecule recorded at a temperature below 10 К and constructed on the basis of the selection rules (
 ,
, ) in the spectral interval 0–400 cm-1 should be represented by two absorption bands with the frequencies 294.5 and 353.2 cm-1. In the case of an insignificant population of the first degenerate torsional state of the E-type there is a possibility for observation of a low-intensity absorption band with the frequency 199.8 cm-1. It is clear that the matrix effect leads both to the frequency shift and to a significant changing of the transition probability, and this is supported by the presence of two high-intensity absorption bands in an IR spectrum of methanol in the argon matrix over the region 200–300 cm-1.
7. Conclusions
- In the case when a molecule of methanol is surrounded by eight argon atoms the authors have considered internal rotation and rotation of the molecule as a whole with respect to the С-О bond, and also their joint motion. Splitting of the deepest double-degenerate torsional state was found to be 29.7 cm-1. Rotation of the methanol molecule as a whole with respect to С-О bond takes place in a small decelerating potential, height of the barrier being no more than 60 cm-1. Because of the elongated form, rotation of a methanol molecule with respect to the axes perpendicular to С-О bond is unlikely. The computations carried out point to the fact that a methanol molecule may be considered as a probe in analysis of the matrix properties. By simulation of the positions of argon atoms surrounding a molecule of methanol we can vary a two-dimensional potential surface and hence a theoretical IR spectrum of the molecule in the matrix. Correlation with the experiment is still required to reveal which of the types of the argon atoms surroundings is most probable.
References
| [1] | A.J. Barnes, in Matrix Isolation Spectroscopy, edited by A.J. Barnes, W.J. Orville-Thomas, A. Muller, R. Gaufres, D. Reidel Publishing Company, Dordrechr: Holland/ Boston: USA/ London: England, (1981), p.18. |
| [2] | B.I. Swanson, I.H. Jones. High Resolution Infrared Studies of Site Structure and Dynamics for Matrix Isolated Molecules, in Vibrational Spectra and Structure v.12, edited by J.R. Durig, Elsevier Science Publishers, (1983), p.1–67. |
| [3] | S. Cradock, A.J. Hinchcliffe. Matrix Isolation, Cambridge University Press, (1975), p.93–102. |
| [4] | Kin-Chue Ng, William J. Meath, A.R. Allnatt A Simple Reliable Approximation for Isotropic Intermolecular Forces, Chem.Phys., 32,(1978), p.175-182. |
| [5] | Kin-Chue Ng, William J. Meath, A.R. Allnatt The Reliable Semi-Empirical Approach for Evaluating the Isotropic Intermolecular Forces Between Closed-Shell Systems, Mol. Phys., 37,(1979), p.237-253. |
| [6] | J.E. Del Bene, M.J.T. Jordan, P.M.W. Gill, A.D. Buckingham An Ab Initio Study of Anharmonicity and Matrix Effects on the Hydrogen-Bonded BrH:NH Complex 3, Mol.Phys., 92,(1997),p.429-439. |
| [7] | Janet E. Del Bene and Meredith J. T. Jordan A Comparative Study of Anharmonicity and Matrix Effects on the Complexes XH:NH3,X=F, Cl, and Br, J.Chem.Phys.,108, (1998), p.3205-3213. |
| [8] | A.Abkowicz-Bienko,M.Biczysko,Z.Latajka Solvent Effect on Hydrogen Bonded Ammonia-Hydrogen Halide Complexes Continuum Medium Versus Cluster Models Comp. Chem.,24,(2000),p.303-309. |
| [9] | A. J. Barnes, Z. Latajka, M. Biczysko Proton Transfer in Strongly Hydrogen-Bonded Molecular Complexes: Matrix Effects. J.Mol.Struct.,614,(2002),p.11-21. |
| [10] | Y.-P. Lee, Y.-J. Wu, R.M. Lees, L.-H. Xu, J.T. Hougen. Internal Rotation and Spin Conversion of CH3OH in Solid Para-Hydrogen. Science, 311, (2006), p.365–368. |
| [11] | J.P. Perchard. The Torsion-Vibration Spectrum of Methanol Trapped in Neon Matrix. J. Chem. Phys., 332, (2007), p.86–94. |
| [12] | J.P. Perchard, F. Romain, Y. Bouteiller. Determination of Vibrational Parameters of Methanol from Matrix-Isolation Infrared Spectroscopy and Ab-Initio Calculations. Part 1 – Spectral Analysis in Domain 11000–200 cm-1. Chem. Phys., 343, (2008), p.35–46. |
| [13] | G.А. Pitsevich, I.Yu. Doroshenko, V.Ye. Pogorelov, D.S. Umrejko. Quantum Chemical Simulation and Low- Temperature FTIR Investigations of the Structure and Spectral Characteristics of Methanol Monomer and Dimer in an Argon Matrix. J. Spectrosc. Dyn., (2011), 1: 9. |
| [14] | G.А. Pitsevich, M. Shundalau. Computer Simulation of the Effect Exerted by Argon Matrix on the Internal Rotation Barriers and Torsional States of Methanol Molecule. J. Spectrosc. Dyn.,( 2012), 2: 15. |
| [15] | http://www.msg.ameslab.gov/GAMESS/GAMESS.html |
| [16] | http://www.wolfram.com/mathematica/ |
| [17] | A. Serrallach, R. Meyer, H.H. Gunthard. Methanol and Deuterated Species Infrared Data, Valence Force Field, Rotamers and Conformation. J.Mol.Spectr., 52, (1974), p.94– 129. |
| [18] | A.J. Barnes, H.E. Hallam. Infra-red Cryogenic Studies: Isotopically Substituted Methanols in Argon Matrices. Trans. Faraday Soc., 66, (1970), p.1920–1931. |
| [19] | D.G. Burkhard, D.M. Dannison. The Molecular Structure of Methyl Alcohol. Phys.Rev., 84, (1951), p.408–417. |
| [20] | K.T. Hecht, D.M. Dannison. Hindered Rotation in Molecules with Relatively High Potentional Barriers. J.Chem.Phys., 26, (1957), p.31–47. |
| [21] | G. Moruzzi, P. Riminucci, F. Strumia, B. Carli, M. Carlotti, R.M. Lees, I. Mukhopadhyay, J.W.C. Johns, B.P. Winnewisser, M. Winnewisser. The Spectrum of CH3OH Between 100 and 200 cm-1: Torsional and “Forbidden” Transitions. J. Mol. Spectr., 144, (1990), p.139–200. |
| [22] | G. Moruzzi, F. Strumia, J. Moraes, R.M. Lees, I. Mukhopadhyay, J.W.C. Johns, B.P. Winnewisser, M. Winnewisser. The Spectrum of CH3OH Between 200 and 350 cm-1: Torsional Transitions and Evidence for State Mixings. J. Mol. Spectr., 153, (1992), p.511–577. |