M. Khairy, M. A. Mousa
Chemistry Department, Faculty of Science, Benha University, Benha, Egypt
Correspondence to: M. Khairy, Chemistry Department, Faculty of Science, Benha University, Benha, Egypt.
| Email: |  |
Copyright © 2012 Scientific & Academic Publishing. All Rights Reserved.
Abstract
Nano zinc manganite (ZnMn2O4) samples have been prepared using hydrothermal method in presence and absence of surfactants. The samples were characterized by XRD, FT-IR, and electron microscopy (SEM) as well as (TEM). Catalytic activity for investigated samples as well as, dc- and ac-electrical conductivity as a function of frequency and temperature were studied. Gamma radiation effect on the studied properties is investigated. All samples showed tetragonal spinel structure with average crystallites sizes lay in the range 19 – 90 nm. The samples showed semiconducting behavior in which the electrical conduction occurred via electron exchange amongst manganese ions situated on octahedral sites in the spinel structure. The particle size, morphology, electrical and catalytic activity were affected by each of preparation conditions and gamma– irradiation process.
Keywords:
Nanomaterials, Zinc Manganate, γ-Irradiation, Electrical Conductivity, Catalytic Activity
Cite this paper:
M. Khairy, M. A. Mousa, "Electrical and Catalytic Properties of Gamma-irradiated and Unirradiated ZnMn2O4 Nanoparticles", American Journal of Chemistry, Vol. 2 No. 6, 2012, pp. 306-311. doi: 10.5923/j.chemistry.20120206.03.
1. Introduction
Nanometer-scale materials with the size of 1–100 nm have attracted considerable attention in recent years due to their interesting properties arising from quantum size effect. In nanophase materials, a majority of atoms, molecules, or ions reside in the grain boundaries or within one or two layers from the boundary[1- 4]. These grain boundaries contain a high density of defects like vacancies, dangling bonds, which can play an important role in the transport properties of these materials. Several synthetic methods and approaches have been applied for preparing nanomaterial with different shapes[5-7]. General approaches for shape control and production of anisotropic nanostructures rely on the availability of surfactants, which preferentially absorbed on specific crystallographic faces. With ever increasing energy costs, the hydrothermal method could be possibly very attractive for fine powder preparation because of the low temperature involved, crystal size and the morphology of the powders may be controlled by reaction conditions and the good sinter ability of the formed powders[8-10]. ZnMn2O4 is one of the promising materials which can be used as negative temperature coefficient (NTC) thermistors[11], as catalytic material[12] and as cathodic material of the secondary batteries[1] due to their excellent electrochemical properties. It is expected that all of these properties to be dependent on the particle size and their morphology. Therefore, this work was designed to prepare nano ZnMn2O4 by hydrothermal method in absence and presence of different surfactants. The materials obtained were characterized by X-ray diffraction (XRD), Fourier transform infrared (FTIR), scanning electron microscopy (SEM) and transmission electron microscopy (TEM). The effect of grain size and γ-irradiation on each of the electrical properties and catalytic activity of the prepared samples has been studied.
2. Experimental
All the chemical reagents used in the experiment were reagent grade and used without further purification and treatment. The surfactants used in the preparation method were divided into three different groups: (a) Cationic surfactants: cetylpyridinium bromide monohydrate (CPB) {CH3(CH2)15NC5H5BrH2O} (98%) provided from Aldrich; (b) Anionic surfactants: dodecylbenzene sulphonic acid (Sulph) {CH3(CH2)11C6H4SO3H} provided from chemicals and dyes company, Kafr El Doar and (c) Nonionic surfactants: triton X-100 (TX) {C14H22O(C2H4O)n} provided from Arsamco.A mixed solution of 1 ml H2O2 (3%), 3 ml of 5x10⁻³ M surfactant and 6 ml NaOH (0.6 M) was poured slowly into a Teflon-lined stainless-steel autoclave filled with 3 ml Mn(NO3)2 (0.3 M) while stirring vigorously, and the reaction solution was continually stirred and kept for 20 min at room temperature. Suitable amount of Zn(NO3)26H2O (Carlo Erba RPE reagent grades) dissolved in 100 ml of distilled water was added into the reaction solution and then hydrothermally heated at 500 K for four days. After that the samples were cooled to room temperature. The formed precipitates were filtered and washed with distilled water several times until pH=7, and finally dried in an oven for about 24 h at 363 K. Half of the prepared samples was irradiated by γ-ray source using a 60Co gamma cell ( 60Co gamma cell 2000 Ci with a dose rate of 1.5 Gy/s (150 rad/s) at a temperature of 30 oC. Each sample was subjected to a total final dose of 1x10⁵ Gy (10 Mrad).The prepared samples are denoted as S, SCPB , STX, and Ssulph for the samples prepared without surfactant and by using CPB, TX, and Sulph surfactants, respectively. The irradiated sample is denoted by *.X-ray diffraction was performed on the investigated samples using a Philips X’Pert Pro Super diffractometer with CuKα radiation (λ = 1.54 Å) in the range of 2θ= 10-800. The density was determined by both the immersion Archimedes method (using toluene) and X-ray diffraction. The infrared spectra of the samples were recorded using a Brucker-FTIR. The absorbance was automatically registered against wavenumber (cm-1). Scanning electron microscopy (SEM) and transmission electron micrograph (TEM) analyses were done by using JEOL-JEM-6360 unit and Philips CM-12 unit, respectively. The catalytic decomposition of H2O2 was used as a model reaction for determining the catalytic activity of the gamma irradiated and unirradiated samples at temperatures between 303 and 313 K. The reaction was followed up through a gasometrical measurement of evolved oxygen[13].For electrical measurements, the powder samples were pressed uniaxially into a pellet of thickness 1–2 mm and of diameter 7 mm by applying pressure of ~ 0.3 Gpa for 3 min. Both faces of the pellets were coated with fine quality silver paint for good electrical contacts. DC conductivity was measured in the temperature range 300-400 K by the four terminal techniques. The temperature was limited to 400 K to prevent grain growth and to ensure that the main particle size remained the same in the entire temperature range. AC conductivity was measured by the two-probe method using Fluke PM 6306 programmable automatic (RCL) bridge at frequencies from 102 – 106 Hz in the same temperature range as for dc-conductivity.
3. Results and Discussion
X-ray diffraction patterns of the investigated manganite samples are presented in Fig. 1. For all samples, the same patterns were observed with well developed( h k l ) reflections, which can be well indexed on the basis of the tetragonal spinel structure with the space group of l41/amd JCPDS file (71-2499)[11]. No trace of impurity phases of starting materials is observed in the present patterns, indicating the high purity of the sample. 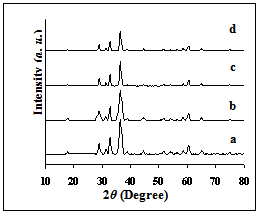 | Figure 1. X-ray diffraction patterns of (a) Ssulph, (b) S, (c) STX, (d) SCPB. |
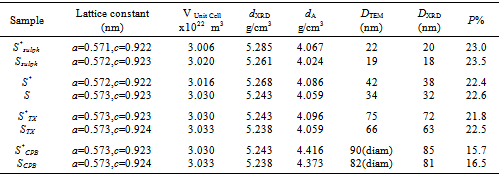
The crystallites sizes Ds, for the investigated samples were estimated by using the Scherrer's equation[14], based on (311) peak: | (1) |
Where λ is the X-ray wave length, θ the Bragg’s angle and β is the pure full width of the diffraction line at half of the maximum intensity. Correction for the line broadening by the instrument was applied using a large particle size silicon standard and the relationship β 2 = β 2M - β 2S where BM and BS are the measured widths at half-maximum intensity of the lines from the sample and the standard, respectively.The results showed DXRD in the range of 18 - 85 nm, Table 1. The irradiated samples showed larger particle size than that of unirradiated ones. This may be due to creation some lattice defects as a result of ionizing radiation.The X-ray density was calculated using the formula: | (2) |
Where Z is the number of molecules per unit cell (Z = 4); M is the molecular weight; N is the Avogadro’s constant and V is the volume of unit cell. Table 1. Lattice parameters, density and porosity of investigated ZnMn2O4 samples
 |
| |
|
The bulk density (dA) was also measured by the Archimedes principle. The percentage porosity (P) of the samples was then calculated using the relation[15]: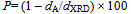 | (3) |
Each of the bulk density and porosity values are given in Table 1, which shows an increase in the porosity with decreasing the particle size of the grains. Figs. 2(a) and (b) show the SEM and TEM of some γ-irradiated and unirradiated powdered samples, respectively. The images analysis reveals the role of surfactants as capping agents. The morphology of the samples prepared in absence of surfactant showed a range of shapes including finely dispersed spherical particles with high homogeneity and cotton like structure. And the morphology of the samples prepared using each of the anionic (sulph) and non ionic surfactant (TX) showed nanoparticles with different shapes. Whereas, the samples prepared using CPB surfactant showed the formation of dispersed nanorod particles. Cationic surfactant such as CPB has been successfully used as the morphology-directing agent for the synthesis of one-dimensional nanostructures, such as CuO, PbO2, Pb3O4 and Co3O4 nanorods[16, 17]. In their synthesis, due to electrostatic interactions, inorganic precursor and cationic surfactant CPB can form different conformational inorganic–surfactant composite templates or used as capping agent. | Figure 2a. SEM: (a) S, (b) Ssulph, (c) STX , ( d) SCPB, (e) S*, (f) STX *, (g) Ssulph*, ( h) SCPB* |
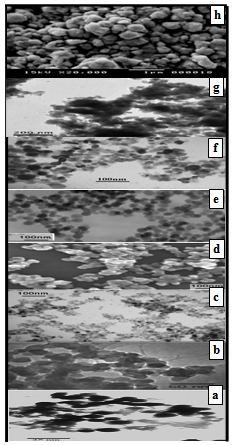 | Figure 2b. TEM of: (a) Ssulph, (b) S, (c) STX , (d) SCPB, ( e) SCPB*, (f) S*, (g) STX*, (h) Ssulph* |
The image analysis for some irradiated samples showed surface morphologies and voids between the particles grains differ to some extent than that of unirradiated ones. Moreover, the pores sizes became larger after irradiation process. This indicates that the high ionization radiation produced an effect on the surfaces of the samples. This may be attributed to the creation of some lattice defects by the ionizing radiation.Generally, the different morphologies and sizes of crystallites formed during the hydrothermal crystallization in presence of surfactants can be explained on the basis of the balance between nucleation and growth rates. With increase in each of the supersaturation and adsorption of surfactant on the crystal faces, both growth and nucleation rates increase. Consequently, when the growth rate dominates over the nucleation rate, crystallite sizes increase, while in the case of nucleation rate domination, crystallite size decreases[18].The mean grain sizes DTEM of investigated samples are slightly larger than DXRD and lie between 19 - 90 nm, Table 1. This may be attributed to either the presence of non-crystalline materials at the lattice surface or to the different approach of two techniques. In XRD, we determine the mean particle diameters and the shape factor used is not definite determined (value used in our calculations is 0.9) any change in the shape factor will cause a change in the calculated size. Table 2. FTIR data of investigated samples
 |
| |
|
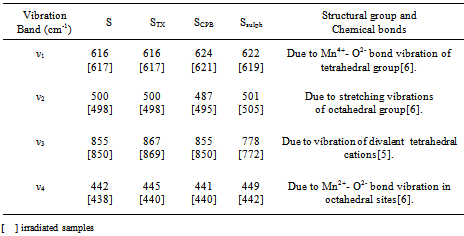
Infrared spectroscopy for the γ-irradiated and non-irradiated samples showed vibrations bands in the range 400 to 1000 cm-1, which is usually assigned to the vibration of ions in the crystal lattice. The main bands appeared are listed in Table 2. The main features found in the spectra are: (i) All samples showed vibration bands of the manganese ions on both the tetrahedral (ν1) and octahedral (ν2) sites. (ii) The positions of the bands are slightly dependent on the type of surfactant used. But some broadens in the peaks are observed with decreasing the particle size. The other strong peak broadens and even cleaves. This may be due to the existence of more imperfections in nanometer particles, leading to the wide distribution of vibration frequency of the chemical bond and the dramatically decreased symmetry.(iii) The band positions of irradiated samples are seemed to be not affected by irradiation process. The temperature dependence of dc-conductivity σdc for γ-irradiated and unirradiated samples has been studied. All the samples showed a thermally activated process. Typical plot is shown in Fig. 3. This can be explained according to the relation: 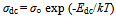 | (4) |
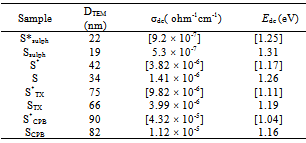
Where σ○ is the pre-exponential factor, Edc the activation energy and k the Boltzmann constant. Edc was calculated from the slope of ln σdc against T-1 using least squares method. The conductivity data are summarized and given in Table 3. It may be noted that, σdc is conspicuously size dependent; it increases as the particle size increasesSCPB > STX > S > SSulphThis is due to the fact that samples with small grain consist of more number of grain boundaries than grains. The grain boundaries are the regions of mismatch between the energy states of adjacent grains and hence act as barriers to the flow of electrons.It is well known that the electrical conduction in oxides containing transition metal ions in different oxidation states takes place by means of hopping electrons between these different oxidation states[19 - 21]. Thus, it is expected that the conduction mechanism in our samples with spinel structure is attributed to the hopping of electrons between the manganese ions with different valence states at octahedral sites[22]. This is due to their smaller separating distance than that present in tetrahedral sites. This hopping conductivity is possible only if some Zn2+ cations are located on the octahedral sites of the spinel structure. Then an equivalent proportion of Mn4+ is created on the same sites, in order to maintain the electrical neutrality as it is described in the following formula[11]:Zn2+1-x[Zn2+xMn3+2-x Mn4+x]O42-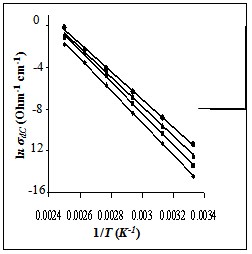 | Figure 3. The temperature dependence of DC-conductivity for: (●), SCPB; (▲), STX ; (■), S; (♦), SSulph. |
The conductivity results of γ-irradiated samples showed an increase in the electrical conductivity values comparable with that found for unirradiated ones, whereas the activation energy (Edc) is not changed. This non–change in Edc–values means that the electrical conduction mechanism is the same in all irradiated and unirradiated samples. But the increase in conductivity values by irradiation refers to a change in the rate of hopping process due to a change occurring in the ratio of Mn valence states present in octahedral sites. Thus, the γ-irradiation effect on the electrical conductivity may be explained according to the following interaction 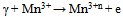 | (5) |
This interaction leads to increase the amount of Mn3+n ions (oxidation states higher than 3+ i.e. Mn4+ or Mn5+…etc.) causing an increase in the redox ratio Mn3+n /Mn3+ present in the octahedral sites. This leads to increasing the hopping rate and hence increasing the electrical conductivity values. Table 3. Conductivity data of γ -irrradiated and unirradiated ZnMn2O4 samples at 300 K
 |
| |
|
In order to give information on the type of polarization present in the samples, the ac-electrical conductivity (σac), at temperatures between 300- 400 K and at frequency range of 102 – 106 Hz was studied for irradiated and unirradiated samples. Fig. 4 shows the frequency dependence of σac at 373 K. The same variation is observed for all samples with different particle sizes. All the samples show an increasing trend in the ac–conductivity as the frequency increases, especially at higher frequencies. The origin of frequency dependence of conductivity in the relaxation phenomenon arises due to mobile charge carriers. However, in a hopping model, it is possible to distinguish different characteristic regions of frequency at low frequencies where the conductivity is almost constant; the mechanism of transport of charge takes place via many paths. The hopping mechanism becomes the sole contribution to the conductivity process in the frequency regions where the conductivity is strongly dependent on frequencies. 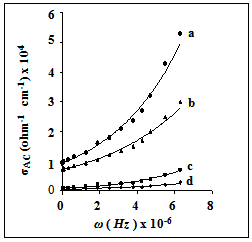 | Figure 4. The frequency dependence of AC-conductivity for: (a) SCPB, (b) STX , (c) S, (d) SSulph. |
The relation between ac -electrical conductivity, real dielectric constant ε′, angular frequency, and dielectric loss ε′′ can be expressed as[23]: | (6) |
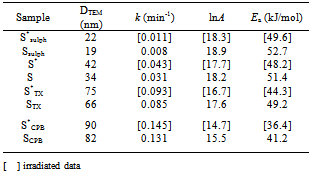
This equation is derived considering the double layer model in which the inhomogeneous natures of two different layers are involved[24]. According to this model, the dielectric spinel material consists of two layers. The first layer consists of large grains of fairly conducting material, which is separated by the second layer, which is a thin layer of grain boundaries of relatively poor conducting material[25]. The grain boundaries of nanomaterials have a vital role to play in their transport properties since a greater number of atoms are present in the grain boundary or within a few atomic layers from the boundary[26, 27]. Electrical conductivity in nano zinc manganite is due to the electron hopping, which involves exchange of electrons between Mn3+ and Mn4+ ions in the octahedral sites. According to Eq. (6) the ac-electrical conductivity increases with frequency in nano ZnMn2O4. The contributions from grain boundaries on σac are effective at lower frequencies, while grains of the inner layer play a major role in conduction mechanism at higher frequencies.The catalytic activity of γ -irradiated and unirradiated ZnMn2O4 was tested in the decomposition of hydrogen peroxide in aqueous solution at 303 K. The decomposition kinetics of hydrogen peroxide in the presence of the samples was found to follow first order mechanism with respect to H2O2. Thus, plots of ln (a/a − x) versus t were linear over about 80% of the total reaction time, Fig. 5. The rate constant (k, min−1) of the catalyzed reaction was calculated and listed in Table 4. The unirradiated samples were found to have catalytic activity less than those of irradiated ones. This effect of irradiation process on the catalytic activity can be understood on the basis of the change occurring in the valence states of the Mn-ions due to irradiation process, as mentioned above. Thus, the catalytic activity in our samples may be attributed to the presence of Mn3+n/Mn3+ and Mn3+/Zn2+ ion pairs, which were also suggested by Selim et al.[28].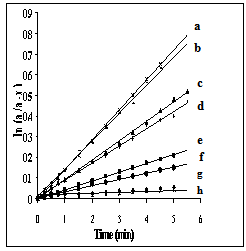 | Figure 5. First order relation ln (a/a-x) = kt at 303 K of: (a) Ssulph*, ( b) Ssulph, (c) S*, (d) S, (e) STX*, (f) STX , (g) SCPB*, ( h) SCPB. |
This means that the change in the oxidation states of the active contents in the catalytic samples play to some extent a role in the catalytic activity besides that obtained from decreasing the particle size of the sample, Table 4.
4.Conclusions
Nanocrystalline ZnMn2O4 were prepared in the range of 19-90 nm using hydrothermal method in presence and absence of surfactants. XRD showed a tetragonal spinel structure for the γ- irradiated and unirradiated samples. The size of the prepared particles has been confirmed through X-ray diffraction and TEM techniques. SEM and TEM images showed surface and particle morphology depends on the surfactant used and irradiation process. The pores sizes on the samples surfaces became larger after irradiation. Both ac and dc conductivity follows Arrhenius-type thermally activated conduction over temperature range investigated and referring to a semiconducting behavior for the γ- irradiated and unirradiated nano ZnMn2O4 samples. The irradiation causes a change in each of the catalytic activity and the conductivity values of the investigated material. Hopping mechanism between Mn3+ and Mn3+n in Zn2+1-x[Zn2+xMn3+2-xMn4+x]O42- samples is used to explain the conducting behavior. The catalytic activity of investigated samples increases by increasing the particle size as well as the gamma irradiation process.Table 4. Reaction rate constant (k) at 303 K, and activation energy (Ea) for H2O2 decomposition over irradiated and unirradiated samples
 |
| |
|
References
| [1] | Liu F Kirchheim R J Crys Growth 264, (1-3), 385-391, 2004. |
| [2] | Liu F Yang G Wang H Chen Z, Zhou Y Thermochim Acta 443, (2), 212-216, 2006 |
| [3] | Junjie L Wang J Yang G Scr Mater 60, (11), 945-948, 2009. |
| [4] | Bobylev S V Yu Gutkin M Ovid'ko I A Acta Mater 52 (13) 3793-3805, 2004. |
| [5] | Rao C N R Müller A Cheetham A K Nanomaterials chemistry ;Recent developments and new directions Wiley-VCH Verlag GmbH& Co. KGaA, 2007. |
| [6] | Hosseini E Kazeminezhad M (2009) Comput Mater Sci 44, (3), 962- 967, 2009. |
| [7] | Jun Y Seo J Oh S Cheon J Coord Chem Rev 249 (17-18) 1766-1775, 2005. |
| [8] | Hanzhong K Xike T Jianhua Z, Zhenbang P ( 2007) J China Uni Geosci 18, (2), 167-171,2007. |
| [9] | Ding B Shi M M Chen F Zhou R J Deng M Wang M J Crys Growth 311, 1533-1538, 2009. |
| [10] | Zhang J Xiao X Nan J J Hazard Mater 176, (1-3), 617-22, 2010. |
| [11] | Guillemet-Fritsch S Chanel C Sarrias J Bayonne S Rousset A Alcobe X Martinez Sarriòn ML ,Solid State Ionics 128, (1-4), 233-242, 2000. |
| [12] | Ferraris G Fierro G Jacono M L Inversi M Dragone R Appl Catal B 36, ( 4), 251-260, 2002. |
| [13] | Shaheen W M Selim M M Thermochim Acta 322,(2), 117-128, 1998. |
| [14] | Klug H P Alexander L E (1970) X-ray diffraction procedures for polycrystalline and amorphous materials Wiley, New York |
| [15] | Kosaki M Ohshima H Ieda M J Phys Soc Jpn 29, 1012-1917, 1979. |
| [16] | Lian S Wang E Lei G, Lin X Mater Lett 61, (18), 3893-3896, 2007. |
| [17] | M. Cao, C. Hu, Y. Wang, Y. Guo, C. Guo and E.B. Wang, Chem. Commun. 1884 (2003). |
| [18] | Carbone L Cozzoli PD Rev art Nano Today 5(5), 449-493, 2010. |
| [19] | Ma N Yue Y Hua W Gao Z Appl Catal A 251, 39-47, 2003. |
| [20] | El-Shaarawv MG J Appl Phys 87(2), 668-671, 2000. |
| [21] | Wandekar R V Wani B N Bharadwaj S R Solid State Sci 11(1), 240-250, 2009. |
| [22] | Battault T Legros R Rousset J Eur Ceram Soc 15(11) , 1141-1147, 1995. |
| [23] | Manjurul Haque M Huq M Hakim Mater Chem Phys 112 (2), 580- 586, 2008. |
| [24] | Koops C Phys Rev 83, 121 -124, 1951. |
| [25] | Kurien S Mathew J Sebastian S Potty S N George K C Mater Chem Phys 98 ( 2-3), 470-476 , 2006. |
| [26] | Jose J Abdul Khadar M Nanocomp Nanostru Mater 11(8), 1091-1099, 1999. |
| [27] | Hendi A A Aust J Basic Appl Sci 5(7), 380-386, 2011. |
| [28] | Selim M M Deraz N M Elshafey O I El-Asmy A A J Alloys Compd 506 (2), 541-547, 2010. |
 Abstract
 Reference
 Full-Text PDF
 Full-Text HTML