-
Paper Information
- Next Paper
- Previous Paper
- Paper Submission
-
Journal Information
- About This Journal
- Editorial Board
- Current Issue
- Archive
- Author Guidelines
- Contact Us
American Journal of Chemistry
2012; 2(4): 228-233
doi: 10.5923/j.chemistry.20120204.07
Appraisal of Heavy Metal Contents in Commercial Inorganic Fertilizers Blended and Marketed in Nigeria
 Abstract
 Reference
 Full-Text PDF
 Full-Text HTML
Ukpabi Chibueze F. 1, Akubugwo E. 1. 2, Agbafor Kingsley N 3, Lebe Nnanna A. 4, Nwaulari Nwokocha J. 5, Nneka Ekekwe D 6
1Department of Biochemistry, Abia State Polytechnic Aba
2Department of Biochemistry, Abia State University Uturu
3Department of Biochemistry, Ebonyi State University Abakaliki
4Department of Physics, Abia State Polytechnic Aba
5Department of Biology, Abia State Polytechnic Aba
6Department of Chemistry, Abia State Polytechnic Aba
Correspondence to: Ukpabi Chibueze F. , Department of Biochemistry, Abia State Polytechnic Aba.
| Email: |  |
Copyright © 2012 Scientific & Academic Publishing. All Rights Reserved.
Human food chain toxicity has been shown to be influenced by application of inorganic fertilizers. Three samples of commercial inorganic fertilizers marketed in Nigeria were analysed for their heavy metal contents. The fertilizer samples used were N15P15K15 (CF1), N20P10K10 (CF2) and N27P13K13 (CF3). Molybdenum (Mo) levels were the highest and Vanadium (V), Arsenic (As), Mercury (Hg) and Silver (Ag) were not detected by our analytical method. The concentrations of Mo in the CF1 (2, 570.0 mg/kg), CF2 (2,3000.0 mg/kg) and CF3 (1,340.0 mg/kg), were above the maximum acceptable concentration (20mg/kg) while CF1 (0.129 mg/ha/yr) and CF2 (0.115 mg/ha/yr) were above the maximum annual metal addition to soil (0.079 mg/ha/yr), as established by Canadian standard for fertilizers. Only CF1 (5.805 kg/ha) was above long-term cumulative assessment of metal addition to soil (3.57 kg/ha). Other heavy metals detected were Magnesium(Mg), Iron(Fe), Nickel(Ni), Zinc(Zn), Cadmium(Cd), Manganese(Mn), Cupper(Cu), Cobalt(Co), Lead(Pb), Chromium(Cr) and Boron(B). Cd and Pb mean concentrations of the fertilizer samples examined ranged from 2.84 to 11.32 mg/kg and 7.43 to 9.02 mg/kg respectively. Cd followed significantly (p<0.05) with phosphate percentage by weight of the inorganic fertilizers. Though the concentrations of these non-nutrient/toxic metals were below the recommended levels, it is important to encourage manufacturers to indicate their concentrations on the fertilizer labels in view of their health implications.
Keywords: Inorganic Fertilizers, Heavy Metals, Nigeria
Article Outline
1. Introduction
- Human food chain toxicity has been shown to be influenced by application of inorganic fertilizers. Historical cases of catastrophic and endemic exposures of heavy metals abound in Literature. Minamata disease[1], the Pink disease[2], the Bradford sweet poisoning[3], the Itai-itai disease[4], Iraq mercury poisoning[5] and Alexander Litvinenko Poisoning[2] are all associated with heavy metal poisoning. Heavy metals become toxic when they are not metabolized by the body and accumulate in the soft tissues. Some people cannot excrete them efficiently enough and a build up occurs[6]. Recent research also reveals that those who cannot excrete heavy metals efficiently appear to be genetically predisposed to this condition[6].Schroeder and Balassa[7] were the first to identify that fertilizers were implicated in raising some heavy metal concentrations in food crops and since then researchers have been urged to investigate the impact of impurities in fertilizers on crop uptake of potentially toxic elements. Several studies have shown that the main source of fertilizer - derived heavy metals in soils is phosphatic fertilizers, manufactured from phosphate rocks that contain various metals as minor constituents in the ores[8]. Analysis of fertilizers commercially marketed in India, Italy, Australia, New Zealand, England and USA indicated that all phosphatic fertilizers contained significant and varying amounts of heavy metals[9],[10],[11]. Charter et al.,[12]. showed that triple superphosphate, monoammonium phosphate and diammonium phosphate marketed in Iowa in the USA contained variable concentrations of many trace and heavy metals. Several studies have shown that these heavy metals in phosphatic fertilizers can subsequently accumulate in soil and become readily available to plants[13],[14]. The use of these fertilizers has increased significantly over the last few decades and is projected to increase even more. Bumb and Baanaunte[15], estimated an average of 100 million nutrient tons of fertilizer use from 1991 to 2020 and deduced that, the use of inorganic fertilizers is increasing rapidly and the growth in use will be most rapid in the developing countries. In Nigeria, NPK fertilizers are main inorganic fertilizers used in the agriculture sector. It is believed that most farmers use excess rates of inorganic fertilizers due to lack of propermeasurement[16]. The current fertilizer application in Nigeria recommends 3-6 bags of NPK fertilizer application of nutrients (Kg/Ha), follows by 1-2 days of urea for low fertility soil[17]. For many years commercial fertilizers have been regulated to ensure that the product label provides accurate information on essential plant nutrient contents. In recent years, concerns about quality in some fertilizer products have extended beyond nutrient content to the potential presence of non-nutrient toxic substances such as heavy metals. While the presence of toxic elements in fertilizers is an environmental and health concern, there is no indication on fertilizer labels as to inform consumers about the presence and quantity of toxic metals. This is because fertilizer labeling laws only require beneficial nutrients like potassium and phosphate to be enlisted.Informal surveys indicated that in Nigeria, commercial fertilizer products are not tested for heavy metals and posted on the labels or to the website, hence formers and gardeners do not found helpful information for selecting fertilizer products with the lowest level of heavy metal concentrations. The present study assesses the heavy metal levels of three inorganic fertilizers (N15P15K15, N20P10K10 and N27P13K13) blended and marketed in Nigeria and also compares them with international standards established for fertilizers.
2. Materials and Methods
2.1. Chemicals and Equipment
- All chemicals and reagents used were from reliable sources and of high analytical grade. Heavy metal analyses were carried out using atomic absorption spectrophotometer (UNICAM 969), Japan. Optical densities were measured using digital flame photometer (ESIPO, model 1381) and digital spectrophotometer (Model 390, Tuner® USA).
2.2. Sampling
- Three inorganic fertilizers (Federal and Chemical Company Limited, Kaduna, Diamond fertilizer Company Limited, Abakaliki and Golden Fertilizer Company Limited, Kaduna) were purchased in full bags from various markets in Aba metropolis. The mineral NPK percentages by weight of these fertilizers were N15P15K15, N20P10K10 and N27P13K13 and denoted as CF1, CF2 and CF3 respectively.
2.3. Fertilizer Analysis
2.3.1. pH Value
- pH value of each fertilizer was determined electrometrically using glass-electrode pH meter, at the ratio of 1:2 fertilizer/water suspensions, according to Nwinuka et al[20]. Each fertilizer sample (10g) was weighed and put into a 50ml beaker. 20ml of deionized water was added and allowed to stand for 30 minutes. The mixture was stirred occasionally with a glass rod and the pH measured by inserting the electrode of the pH meter into the suspension after standing for 15 minutes. The pH meter was checked and adjusted before the measurement of the suspension using two buffer solutions. The pH was measured in triplicates and the average result recorded.
2.3.2. Total Nitrogen
- The total nitrogen in the each fertilizer sample was determined using a regular macro- Kjeldahl method[18]. The fertilizer sample (2g) was weighed and transferred into a Kjehdahl digestion flask. Few bumping chips, 4 tablets of the digestion catalyst (each contains 1g sodium tetraoxosulphate (VI) (Na2S04)) and 0.5g selenium and 25ml of the conc. tetraoxosulphate (VI) acid (H2SO4) were added. The flask was placed on an electrothermal heater and held on a slanting position with the clamp on the retort-stand. The flask was gently heated until frothing ceased. The digestion temperature was intensified until the digest cleared. The flask was cooled and 100ml of distilled water added slowly. Boric acid (2%, 50ml) was measured into a 250ml conical flask and 4 drops of 1% double indicator (methyl red-methylene blue combination) was added into the boric acid solution. Diluted digest (20ml) was measured into 250ml round-bottomed distillation flask. The steel head carrying the Liebig condenser was connected to the flask and the distillation flask was held in position with a retort stand. The conical flask was placed at the tip of the receiver adaptor connected to the Liebig condenser and 40ml of 50% sodium hydroxide (NaOH) was injected into the distillation flask through a syringe. The distillation flask was heated until 150ml of ammonia (NH3) was collected in the receiving flask over boric acid. The content of the receiving flask was allowed to cool and titrated with 0.1M Hydrochloric acid (HCl) until a pink colour appeared. The reading was noted and recorded while the blank underwent the same treatment.
2.3.3. Potassium Content
- Flame emission spectrometry using flame photometer was used for the measurement of potassium[18].Fertilizer sample (20g) was weighed into a beaker and digested with 10ml of conc. trioxonitrate(V) acid (HNO3 ) and 5ml of conc. perchloric acid ( HClO4 ) on a hot plate with gentle boiling. The digested sample was evaporated to dryness and the residue mixed with 5ml of 2.0M hydrochloric acid (HCl) and then, filtered into a 100ml standard flask using Whatman No 44 filter paper. The resultants digest was aspirated into the flame photometer and the intensity of the radiation recorded. A standard solution of potassium chloride (KCl) (0.5mg/l) was prepared and aspirated into the flame photometer. The intensity of the radiation was recorded while the blank underwent the same treatment using distilled water.
2.3.4. Nitrate
- Nitrate was determined by phenol disulphonic acid method, according to the ASTM[18]. Extraction of soluble nitrate in the fertilizer sample was done using 2.5% (v/v) acetic acid solution. Fertilizer sample (10g) was weighed and transferred into a 500ml container. The 2.5% (v/v) acetic acid (250ml) was added and shaked very well for one hour on a rotary shaker. The content was filtered through No 44 filter paper into a polythene bottle and the first 20-30ml was rejected. The filtered sample (25ml) was pipetted into a crucible and evaporated to dryness in water bath and allowed to cool. The residue was dissolved in solution containing 5ml of brucine-sulphanilic acid solution, 5ml of hydrogen tetraoxosulphate (VI) solution and 5ml 12M sodium chloride. The mixture was dipped in boiling water for 20 minutes and the absorbance was measured at 410nm using spectrophotometer. A standard solution was prepared with potassium nitrate (0.2mg/l) and was treated with respect to the test sample. The absorbance was measured at the same wavelength.
2.3.5. Phosphate
- This method was based on the formation of heterophosphomolybdate compound when an acid molybdate was added to a solution containing orthophosphate[19]. Fertilizer sample (20g) was digested using concentrated tetraoxosulphate (VI) acid (H2SO4) and trioxonitrate (V) acid (HNO3), mixed acid solution, in the presence of a pinch of (0.3g) copper sulphate and potassium sulphate. The colourless solution was treated with 2ml ammonium molybdate and stannous chloride solution and was allowed to stand for 5minutes.A blue colour was developed which was measured at a wavelength of 690nm. A standard solution was prepared using a phosphate compound (0.2mg/l) and was treated as the test sample. The absorbance was also measured at 690nm and recorded.
2.3.6. Sulphate
- Sulphate (SO42-) was measured by the turbidimetric method involving the precipitation of barium sulphate[18]. Extraction of soluble sulphate in the fertilizer sample was done using 2.5% (v/v) acetic acid solution. Fertilizer sample (10g) was weighed and transferred into a 500ml container. The extraction solution (250ml) was added and shaked very well for one hour on a rotary shaker. The content was filtered through No 44 filter paper into a polythene bottle and the first 20 – 30ml was rejected. The filtered sample (50ml) was measured into a conical flask. Filtration was repeated where necessary. Barium chloride (0.3g) was added to the sample and stirred conditioning reagent (acidified molybdate, 5ml) was also added and stirred vigorously using magnetic stirrer. Optical density of the samples was measured in a spectrophotometer at 420nm wavelength. The standard solution sodium tetraoxosulphate (VI) (Na2S04) ( 0.5mg/l) was treated in the same manner as the sample and the absorbance was measured at the same wavelength. Blank was determined using acetic acid solution.
2.3.7. Heavy Metal Contents
- Atomic absorption spectrophotometry (AAS) is an analytical method for the determination of elements in small quantities in test samples including fertilizers[18]. Fertilizer sample (2g) was weighed into a beaker and digested with 20ml of conc. HNO3 and 10ml of conc. HClO4 on a hot plate with gentle boiling. The digested sample was evaporated to dryness and the residue mixed with 10ml of 2.0M HCl, filtered into a 100ml standard flask using Whatman No1 filter paper. Several digested samples were analysed for the heavy metals of interest – Mn, B, Cu, Fe, Mo, Ni, Zn, Mg, Ca, V, As, Cd, Hg, Pb, Co, Cr, Ag using an atomic absorption spectrophotometer equipped with a computer printout. The samples were analyzed in triplicates. The effectiveness of the methods used was tested by using spiked samples that were later used as reference samples.
3. Statistical Analysis
- The confidence limits of the data were based on one way analysis of variance by ANOVA (in case of significant interactions) followed Duncan multiple range test using SPSS according to Pallant[21].
4. Results
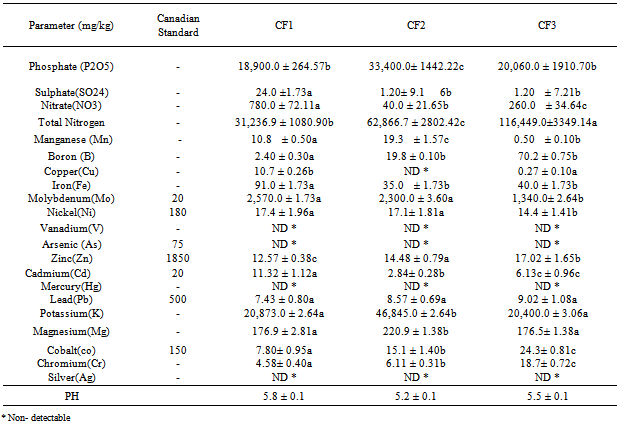
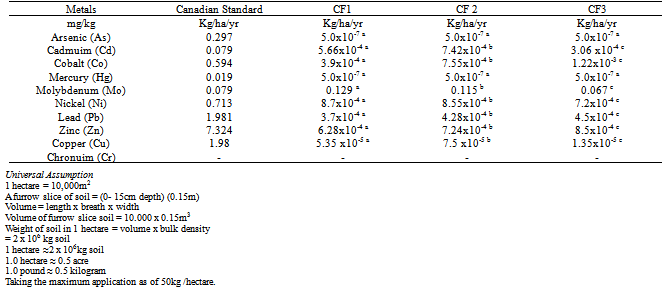
- The chemical composition representing the three inorganic fertilizers and their comparism with International standards, are presented in Tables 1and 2.The result revealed that Mo levels were the highest while V, As, Hg and Ag were not detected. The maximum annual metal addition to soil as established by Canadian Standards for Fertilizers indicated only Mo in CF1(0.129kg/ha/yr) andCF2(0.115kg/ha/yr) were above the Standard (0.079kg/ha/yr).
5. Discussion
- The elemental composition of the three inorganic fertilizers ((N15P15K15, N20P10K10 and N27P13K13) are given in Table 1. The values obtained for the heavy metal concentrations in the fertilizer were compared to the Canadian maximum acceptable concentrations as described by Heekmah[22]. Mo levels were the highest whereas V, As, Hg and Ag were not detected by our analytical method. The concentrations of Mo were 2,570±1.73 mg/kg, 2,300±3.60 mg/kg and 1.340±2.64 mg/kg in CF1, CF2 and CF3 respectively. The highest concentration (mg/kg) of the other detected heavy metals followed the sequence in CF1, CF2 and CF3 as Mg> Fe> Ni> Zn> Mn> Cu> Co> Pb> Cr> Cd> Bo; Mg> Fe> B> Mn> Ni> Co> Zn> Pb> Cr> Cd; Mg> B> Fe> Co> Cr> Zn> Ni> Pb> Cd> Mn> Cu respectively. The result showed that Mo, Mg and Fe concentrations were significantly (p<0.05) higher than the remaining heavy metals. In this vein, Ni, Zn, Co, Mn, Cr, and Cu also showed varying concentrations among the three inorganic fertilizers. This agrees with the earlier works of Kongshang et al.,[23] and Finck[24] that inorganic fertilizer manufactured from phosphate rocks contain various metals as minor constituents in the ores. Mo concentrations in CF1 (2,570.0± 1.73 mg/kg), CF2 (2,300.0± 3.60 mg/kg) and CF3 (1.340.0± 2.64 mg/kg) were significantly (p<0.05) above the Canadian maximum acceptable concentrations (20mg/kg). Ni, Zn, Cd, Pb and Co levels were below the Canadian maximum acceptable concentrations, thus establishing the environmental suitability of the fertilizers. Similarly, Mo levels in CF1 (0.129kg/ha/yr) and CF2 (0.115kg/ha/yr) were significantly (p<0.05) above the maximum annual metal addition to soil as established by Canadian standards for fertilizer which is 0.079 kg/ha/yr. Taking the maximum application rate as 50 kg/ha/yr with multiplication factor of 1.0 million . In the long term cumulative assessment of 45 years, only CF1 (5.783kg/ha) recorded value above the standard 3.57 kg/ha. The toxicity of Mo is usually to grazing animals and not to plant[25]. The toxicity usually an imbalance in the absorption between Cu and Mo.The higher phyto-availability and toxicity of Cd and Pb have urged many investigators to give these elements more attention. In this research, the mean concentrations of Cd and Pb in the CF1, CF2 and CF3 fertilizers are 11.32, 6.13 and 2.84 mg/kg and 7.43, 8.57 and 9.02 mg/kg respectively. The obtained values of these elements were similar to those reported in other parts of the world. For instance, Cd concentrations ranged from 6.8 to 9.4 mg/kg in fertilizer marketed in Iowa, 1.5 – 9.5 mg/kg in Wisconsin [26], 18-91 mg/kg in Australian fertilizers[9] and 0.1 – 30mg/kg in Sweden[27]. Analysis of 97 solid commercial fertilizers in Iowa indicated that the mean values, expressed in mg/kg were 11 and 15 for Pb and Cd respectively in a triple superphosphate samples[12]. The amount of Cd and Pb added to the soil can be estimated by considering the application rates of the fertilizers. The CF2 sample from our research contained 11.32± 1.12 mg/kg Cd, contributed 5.66x10⁻⁴ kg/ha/yr of Cd to soil and in a long term accumulative assessment of metal addition to soil in 45years contributed 0.033 kg/ha. In the same vein CF3 sample which contained 9.02± 1.08 mg/kg Pb, contributed 4.50 x10⁻⁴ kg/ha/yr of Pb to the soil and in a long-term accumulative assessment of metal addition to soil in 45years contributed 0.020 kg/ha. The concentration of Cd and Pb in these fertilizers found in this study clearly demonstrated that these metals from these fertilizers were unlikely to lead to toxic levels in the soil.
|
|
6. Conclusions
- The mean concentrations of heavy metal contents of the three inorganic fertilizers marketed in Nigeria were within the limits of those used worldwide except Mo. The use of these fertilizers in not expected to cause detrimental effects with regards to heavy metal pollution. However, a slight annual increase could be expected. This increase, coupled with other possible inputs of heavy metals to agricultural soil, should raise the need to monitor changes that could occur in soils and to develop pollution control strategies.
7. Recommendation
- The practice of growing crops using fertilizers especially inorganic fertilizers is aimed at increasing the agricultural yields. Although the application is of great socio-economic benefits, there is need to manipulate the phosphate percentage by weight of the inorganic fertilizers to reduce significantly the content of heavy metals especially Cd.
ACKNOWLEDGEMENTS
- The authors wish to acknowledge the technical assistance received from the staff of International Energy Services Limited Port-Harcourt, River State, Nigeria.