-
Paper Information
- Next Paper
- Previous Paper
- Paper Submission
-
Journal Information
- About This Journal
- Editorial Board
- Current Issue
- Archive
- Author Guidelines
- Contact Us
American Journal of Chemistry
2012; 2(4): 218-227
doi: 10.5923/j.chemistry.20120204.06
Nonempiric Anharmonic Computations of IR Spectra of Ethanol Conformers in B3LYP/сс-pVQZ Approximation (Stretch С-Н Vibrations)
 Abstract
 Reference
 Full-Text PDF
 Full-Text HTML
Pitsevich G. А. 1, Doroshenko I. Yu. 2, Pogorelov V. Е. 2, Shablinskas V. 3, Balevichus V. 3, Kozlovskaya Е. N. 1
1Belarusian State University, Minsk, Belarus
2Taras Shevchenko Kiev National University , Kiev, Ukraine
3Vilnius University, Vilnius, Lithuania
Correspondence to: Pitsevich G. А. , Belarusian State University, Minsk, Belarus.
| Email: |  |
Copyright © 2012 Scientific & Academic Publishing. All Rights Reserved.
Low-temperature FTIR spectra of ethanol in the argon matrix have been recorded in the spectral interval 2800-4000 cm-1. The spectra were obtained for several temperatures over the range 20-50 К and for the number ratios 1:1000 and 1:2000 of the molecules studied and atoms in the matrix. A tentative interpretation has been performed on the basis of the temperature and concentration changes in FTIR spectra with the use of the relevant literature data. The computations of harmonic and anharmonic IR spectra for gauche - and trans-rotamers of the ethanol molecule and its two deuterated derivatives (СD3CH2OH and CH3CD2OH) have been carried out in the approximation B3LYP/cc-pVQZ. An interpretation of the bands and lines in the region of stretching С-Н vibrations has been proposed with regard to the anharmonicity effects and Fermi resonances using the literature data on IR and Raman spectra of the molecule under study.
Keywords: Ethanol, FTIR spectra, Anharmonic Vibrational Spectra, Fermi Resonance
Article Outline
1. Introduction
- A molecule of ethanol has very interesting properties due to its ability to be in two conformations: trans-conformation, when the molecule is of СS symmetry, and low symmetry (C1) gauche-conformation. Besides, it has two tops of internal rotation: symmetric (methyl group) and asymmetric (hydroxyl group). Similar to all alcohols, it can form various cluster structures due to the formation of intermolecular hydrogen bonds. Owing to these properties, this molecule has attracted the attention of researchers, especially after the finding[1-4] of ethanol molecules in dense interstellar molecular gas clouds. Numerous works are devoted to the studies of this molecule with the help of vibrational spectroscopy. In[5] the authors have studied the convergence of Raman lines attributed to the stretching vibrations of a hydroxyl group in trans- (3645 сm-1) and gauche-conformers (3635 сm-1) up to their complete coincidence at the temperature 430 К. This effect was related to the increased interconformer transition rate. In IR study of mono- and polycrystalline phases of ethanol presented in[6] it has been found that a crystal cell of
 symmetry includes two chains of four molecules. Durig[7] has analyzed IR spectra of ethanol polycrystals focusing his attention at interpretation of librational and translational modes. In[8] the authors present Raman spectra of ethanol in a gas phase and a qualitative interpretation of the spectra with estimation of the enthalpies difference between trans- and gauche-conformers (110 – 179 cm-1). Durig et al. in their recent work[9] made an attempt to calculate the geometric parameters for trans- and gauche-conformers of ethanol and the internal rotation barriers; they also have considered interpretation of vibrational spectra. The authors have recorded IR spectra (300-4000 cm-1) in a gas phase and IR spectra of ethanol solutions in xenon over the temperature range from -55 to -1000 С. Besides, quantum-chemical computations of the structure, force fields, and harmonic spectra of ethanol have been performed in the approximations MP2/6-31G(d) (57 basis functions) – MP2/acc-pVQZ (516 basis functions) and B3LYP/6-31G(d) – B3LYP/acc-pVQZ. It seems that the first interpretation of IR spectra for ethanol based on recording and processing of spectra for normal ethanol and its 11 isotopic analogues was proposed by Perchard as early as in 1968[10]. Barns and Hallam in their interpretation of a spectrum for ethanol in the argon matrix[11] have proceeded from the prevalence of a trans-conformer. Also, Barns has noted that the temperature dependence of absorption bands for a hydroxyl group of ethanol in the nitrogen matrix[12] may be due to the processes of gauche/trans-interconversions. Reconsidering his previous results, Perchard has obtained IR spectra of ethanol in argon and nitrogen matrices[13]. Based on the calculations of the structure and IR spectra for two conformers in the approximation B3LYP/6-311 ++G(2p,2d) and studying the kinetics of spectral conversions for the sample subjected to laser radiation at the frequencies associated with the vibrations of О-Н and С-О bonds, Perchard has proposed a reliable experimental assignment of the absorption bands to the vibrations of gauche- and trans-conformers of ethanol. He has demonstrated that the argon matrix stabilizes the trans-conformer, whereas in the nitrogen matrix both conformers are found. But it should be noted that the calculations of Perchard have been preformed in the harmonic approximation, and his theoretical description of normal vibrations has only qualitative character.The interpretation of absorption bands for a molecule of ethanol in the region of stretching С-Н vibrations is contradictory. For the description of С-Н stretch vibrations in СН2 and СН3 groups we will use the designations
  ;
; ;
; ;
; ;
; , where the indexes
  and
and  reflect the symmetry of the vibration relative to the symmetry plane in trans-conformer or to the С-С-О plane in gauche-conformer. The symbols in the brackets reflect the type of the vibration of a methyl group relative to the local symmetry С3V. In the earlier works of Perchard[10,14] the bands at 2894, 2928, and 2975 cm-1 have been attributed to
  ,
,  and the overlapping symmetric and antisymmetric stretching vibrations of С-Н bonds in a methyl group:
  +
+ . It was assumed that a gauche-conformer dominates in gas and liquid phases. This assumption was supported by a large coupling of some vibrations. This is impossible in the case of trans-conformer because of the symmetry restrictions. According to[15], the lines at 2891 and 2910 cm-1 are polarized, while the line at 2973 cm-1 is depolarized in a Raman spectrum for the binary mixture of gaseous and liquid ethanol. Assignment of the first two lines is the same as in[10,14] and the third line is attributed to a sum of the
  +
+ (E)-type vibrations. The latter is questionable as, due to the same symmetry type of overlapping vibrations, they should be resonant, mixing, and leading to the appearance of two Raman lines. As it is seen, the assignment was made disregarding the existence of two conformers and without the calculation of normal vibrations. In[11] the bands at 2900.5 and 2953.5 cm-1 are attributed to
  and
and  , respectively. The bands at 2995.6, 2985.4, and 2939.6 cm-1 are attributed to vibrations of the types
 ,
, , and
, and  , respectively. Next, three strong absorption bands at 2917.5, 2913.4, and 2872.0 cm-1 are attributed to overtones and combined bands of the H-C-H bending vibrations, enhanced due to Fermi resonance. All the vibrations in the spectral region under study are associated with a trans-conformer. In[13] the bands at 2899.6 and (2912.9; 2917.4) cm-1 are attributed to the methylene group vibrations of the types
  and
and  in a trans-conformer. The bands at (2992.4; 2995.4); 2984.6, and 2939.2 cm-1 are respectively attributed to the methyl group vibrations of the types
  ,
, , and
, and  in a trans-conformer. The bands at (2886.0; 2888.9); 2929.7; 2951.9; (2983.1; 2984.5), and 2987.2 cm-1 are attributed to the vibrations of the types
 ;
; ;
; ;
; , and
, and of a gauche-conformer, according to[13] revealing an appreciable intensity in the nitrogen matrices only. The authors have related the appearance of doublets to the “site” effect. It is obvious that assignments for the vibrations of С-Н bonds in a trans-conformer are somewhat different in[11,13]. In[9] the presented low-temperature IR spectrum of ethanol recorded in a xenon solution the bands at 2868.0; 2884.0; 2920.0; 2961.0, and 2965.0 cm-1 are assigned as the vibrations of the types
  ;
;  ;
;  ;
;  , and
, and  in a trans-conformer. The bands at 2892.0; 2962.0; 2930.0; 2975.0, and 2994.0 cm-1 are attributed to the corresponding vibrations in a gauche-conformer. Important experimental results devoted to IR and photoacoustic Raman spectra of the molecules СН3СН2ОН, СD3CH2OH, and CH3CD2OH in gas and liquid phases have been obtained in the works[16,17]. Apart from the experimental data, the authors have used the computational results for IR and Raman spectra of ethanol in the approximation B3LYP/6-311 G(d,p), despite the fact that no indications are given which of the two conformers is the case. The authors give alternative assignments for some lines in Raman spectrum.So, one can state that in the literature there is disagreement concerning the interpretation of molecular spectra for ethanol in the region of stretching С-Н vibrations. For adequate interpretation of molecular spectra for ethanol in the region 2800 -3000 cm-1, anharmonic computations of vibrational spectra for gauche- and trans-conformers of the molecules СН3СН2ОН, СD3CH2OH, and CH3CD2OH, taking in to account possible Fermi resonances between stretching and overtone of bending vibrations of С- Н bonds in methyl and methylene groups, may be of great importance.
2. Experimental
- The matrix was prepared with the use of a noble gas – argon (Elme Messer, purity > 99.995). Liquid ethyl alcohol (purity > 99.9) was dried by keeping the sample on molecular sieves (grade 3А) for 48 hours. Degassing of the alcohol was performed just before preparation of the gas mixture for the matrix deposition by multiple repetitions of the freezing, evacuation, and freezing-out cycle for a sample with the use of a standard vacuum assembly. Samples for the matrix isolation were prepared by mixing ethanol vapors with argon in the vacuum. The molecular ratio of alcohol and argon, coming to 1:1000 and 1:2000, was determined by a standard manometer technique. The gas mixture was deposited on the substrate (CsI) cooled down to 20 К in a closed-cycle helium cryostat (Laybold-Hareus RW2). The gas flow in the cryostat was controlled with the help of a needle valve. The deposition rate was about 2 mmol/h to provide the formation of a partially crystallized argon matrix. IR spectra were recorded using Bruker’s vacuum FTIR-spectrometer IFS 113. The spectral data were recoded with the resolution 0.5 cm-1 in the region from 500 to 4000 cm-1. Each spectrum was averaged over 128 scans in order to improve the signal/noise ratio. The spectra were recorded at different temperatures ranging from 20 К to 50 К by steps from 1 to 5 К.
3. Computational Method
- The spectral and structural characteristics for monomers of ethanol have been computed using the program package GAUSSIAN 03[18] in the approximation B3LYP/cc – pVQZ. The geometry of gauche- and trans-conformers in the molecules СН3СН2ОН, СD3CH2OH, and CH3CD2OH was optimized for all the intrinsic coordinates. IR and Raman spectra for every optimized structure have been computed in the anharmonic approximation considering possible frequency shifts of the vibrations due to Fermi and Darling-Dennison resonances. Fig. 1 shows an ethanol molecule in the trans-configuration with an atomic number system. The following natural coordinates were used in description of the stretching vibrations of С-Н bonds in both conformers of ethanol:
 -
- ;
;  -
- ;
;  -
- ;
;  -
- ;
;  -
- .
.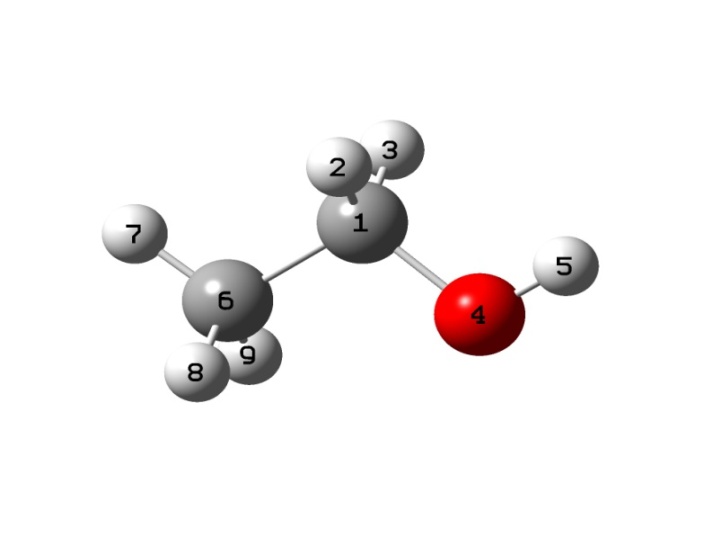 | Figure 1. Trans-conformer of an ethanol molecule with an atomic number system |
 and
and  may lead to the appearance of Fermi resonance. Notable, that for the first case all three normal coordinates
 ,
, , and
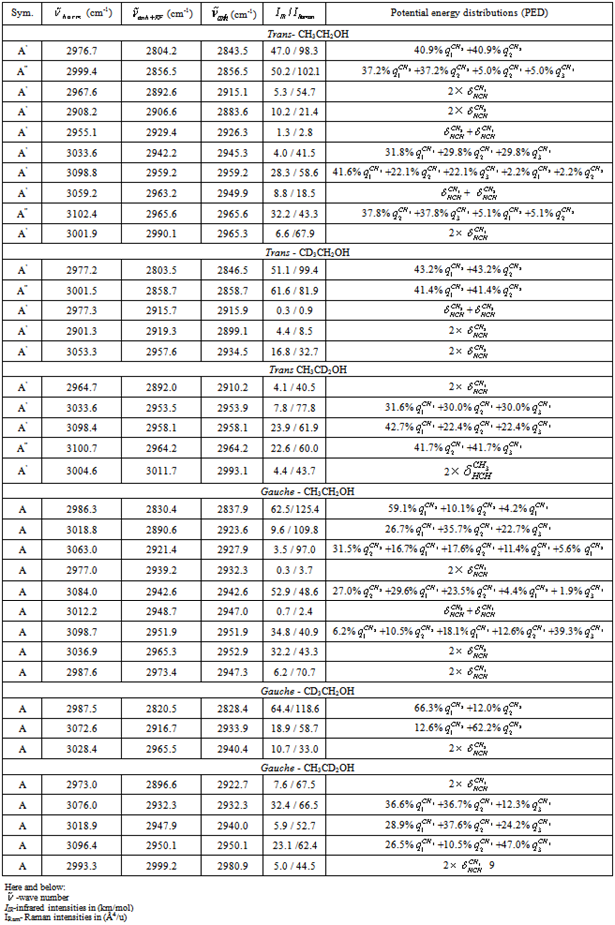
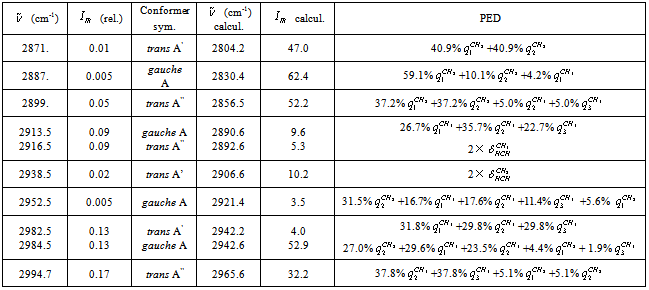
, and  for a trans-conformer should be totally symmetric, and in the second case the total symmetry must be characteristic for the normal coordinate whose index is not repeated. The Fermi-resonance perturbed frequencies were determined by the diagonalization of the matrix. The diagonal of this matrix is associated with the values of the Fermi-resonance unperturbed anharmonic frequencies of fundamental vibrations, overtones, and combined frequencies, whereas the nondiagonal elements represent the corresponding cubic force constants in cm-1[19,20]. Intensities of overtones and combined vibrations as well as fundamental vibrations involved in Fermi resonance were calculated using the eigenvectors of the above mentioned matrices. Table 1 lists the frequency and intensity values computed in harmonic and anharmonic approximations for trans- and gauche-conformers of the molecules СН3СН2ОН, СD3CH2OH, and CH3CD2OH and also the potential energy distributions for the vibrations.According to the calculations (Таble 1) the combined vibrations, formed by the fundamental deformational vibrations of С-Н bonds in СН2 and СН3 groups, are involved in Fermi resonances but has no more than 2% from the intensity of the fundamental vibrations involved in Fermi resonance. Overtones 2939.2 and 2919.3 сm-1 of the deformational vibrations of methyl and methylene groups in gauche-conformer of СН3СН2ОН and trans-conformer of СD3CH2OH, respectively, behave in the same way. That’s why these vibrations were not considered at the assignment of the bands and lines in IR and Raman spectra of ethanol molecule. At the same time other overtones of the investigated molecules may manifest in the vibrational spectra with the intensities comparable with the intensities of fundamental vibrations.
4. Discussion
4.1. FTIR Spectra of Ethyl Alcohol
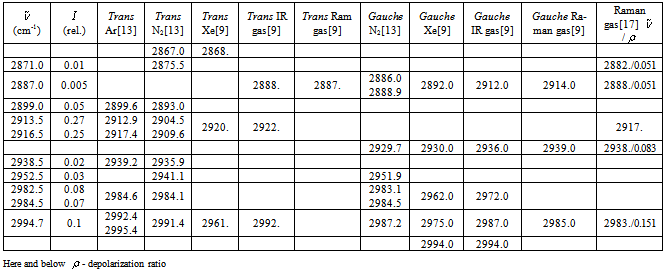
- As noted above, the absorption spectra of ethanol were recorded in argon matrices for the concentration ratios 1:1000 and 1:2000. Based on comparison of these spectra (see Fig. 2), we have revealed the bands resultant from the formation of the associates, the probability of which is higher for the first sample, and the bands caused by the impurity accumulation, the probability of which is higher for the second sample due to a longer condensation time of the sample at the window[21].Comparing spectra for different concentrations of ethanol, we have attributed the absorption bands at 2846 and 2852.5 cm-1 in a spectrum with the concentration ratio 1:2000 to the impurities. Simultaneous analysis of IR and Raman spectra for matrix isolated ethanol and ethanol in a xenon solution, and in a gas phase is very important for the assignment of the bands to the particular molecular vibrations. As it was noted, this makes it possible to reveal the bands caused by the impurities and by the aggregate formation. Notable, that for matrix isolated molecules the multiplet structure of some absorption bands in argon and nitrogen matrices is often due to the “site” effect. At the same time, as a rule, in supercooled solutions (e.g. xenon) no manifestations of this effect are found[21].The absorption band maxima and relative intensities are given together with some literature data for the vibrational spectra of an ethanol molecule in the region 2800 – 3000 cm-1 are presented in Table 2. As the theoretical computations have been performed for an isolated molecule, their results should be better compared to the frequencies derived for a gas phase. The vibrational frequency shifts of the matrix bands with respect to those observed in a gas phase are attributed to the matrix effects[22] of the same nature as molecular frequency shifts in nonpolar solutions. But it should be noted that a sample in a gas phase at room temperature exhibits the presence of both conformers, the gauche-conformer being a share more than 60% of the molecules due to the configuration degeneracy[9].According to[13], some absorption bands of ethanol in Ar and N2 (1:1800) at 9 К demonstrate the multiplet structure caused by the “site” effect. The spectra presented in this work reveal an analogous multiplet structure for both concentrations (1:1000 and 1:2000) at 20 К. For the “site” effect it is characteristic that the intensity of components is independent of the concentration[22]. Besides, this assumption is supported by the absence of the multiplet structure for the corresponding bands in a low-temperature spectrum of an ethanol solution in Xe[9]. The absorption bands components associated with this effect are found in the same cell of Table 2. According to[13], the argon matrix stabilizes the trans-conformer, whereas for N2 the presence of both conformers is possible. Note also that the proposed spectra reveal mostly the trans-conformer vibrations. At the same time, it can be said with confidence that some amount of a gauche-conformer is present in the sample too. This is evidenced by the third band at 3649 cm-1 in the region of stretching О-Н vibrations and by the bands at 1244, 1252 , and 1255 cm-1 which, as indicated in[9,13], are the highest-intensity absorption bands in a spectrum for a gauche-conformer of ethanol caused by stretching vibrations due to О-Н group and С-С-О molecular skeleton of ethanol, respectively.
|
|
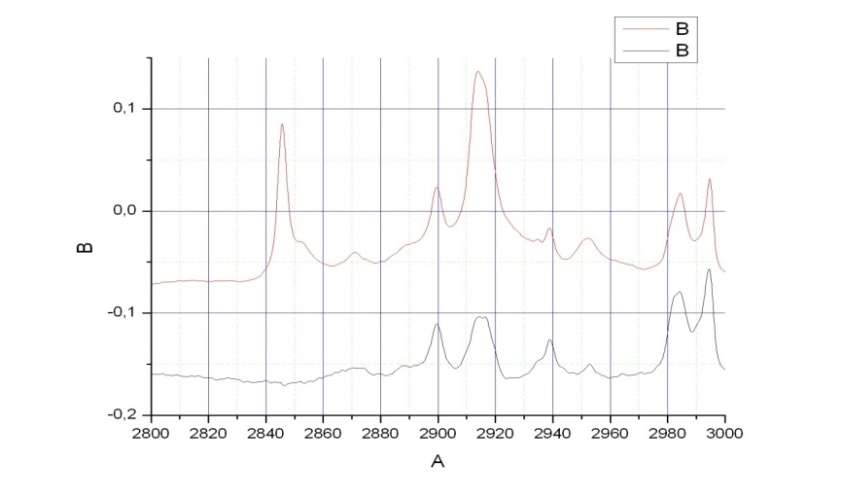 | Figure 2. FTIR spectra of an ethanol molecule over the spectral interval 2800 – 3000 cm-1 (concentration ratios 1:1000 – black; 1:2000 – red) |
4.2. Interpretation of IR Spectra for Ethanol in the Region of С-Н Stretching Vibrations
- Now we consider high-frequency vibrations of СН3СН2ОН. The doublet at 3659; 3656 cm-1 and the band at 3649 cm-1 in trans- and gauche-conformers, respectively, may be assigned to the stretching vibration of a hydroxyl group. As it was noted previously, the splitting of the band with a maximum at 3657.5 cm-1 is assigned to the “site” effect, similar to[13]. All the theoretical computations predict a higher frequency of the hydroxyl-group vibration for a trans-conformer. It is obvious only that the region 2800- 3000 cm-1 is associated with stretching С-Н vibrations. As a molecule of ethanol has five С-Н bonds, no more than five absorption bands should be observed in the indicated region. However, the sample under study reveals the presence of a trans-conformer as well as some amount of a gauche-conformer. On the basis of computations in the anharmonic approximation it is predicted that the frequencies of stretching vibrations of С-Н bonds differ greatly for trans- (2965.6; 2959.2; 2942.2; 2856.5; 2804.2 cm-1) and gauche- (2951.9; 2942.6; 2921.4; 2890.6; 2830.4 cm-1) conformers. Because of this, the band number may be in excess of five. Moreover, the computations predict several Fermi resonances due to which some overtones or combined frequencies may borrow intensity from the fundamental vibrations. The authors of[23] have considered the emergence of Fermi resonance between the first overtone of scissoring vibrations and a symmetric stretching vibration of C-Н bonds for the finite and infinite chains of methylene groups. Unperturbed frequencies of these vibrations for n-butane having a single CH2 group are considered to be equal (2885 cm-1); for their coupling constant it has been proposed to use the value 46 cm-1. As a result, frequencies of the perturbed vibrations are determined as 2908 and 2862 cm-1, intensities of the fundamental vibrations and overtone being practically equal. A similar resonance is predicted in this work for a trans-conformer, but unperturbed frequencies differ considerably, whereas the cubic constant is -32.8 cm-1. In the case of a trans-conformer symmetric and antisymmetric stretching vibrations of С-Н bonds in СН2 group lie lower than vibrations of these bonds in СН3 group, both in the harmonic and anharmonic approximations. As a whole, it is conventionally assumed that such a situation is always revealed spectrally when a molecule has a methylene and methyl group. Nevertheless, in more recent experimental works[16,17] devoted to the interpretation of photoacoustic Raman spectra for ethanol in gas and liquid phases a new assignment of Raman lines has been proposed. Owing to the experimental setup used, the authors have obtained a Raman spectrum of a gas phase with a sufficient intensity of Raman lines and have calculated their depolarization ratio for the molecules СН3СН2ОН, СD3СН2ОН, and СН3СD2ОН to a high accuracy. The experimental results presented in these works are undoubtful, though their interpretation is less obvious. The lines at 2882 and 2888 cm-1 are attributed to the overlapping symmetric stretching vibrations of С-Н bonds in methyl and methylene groups. The line at 2917 cm-1 is assigned to the Fermi resonance associated with a methyl group. The line at 2938 cm-1 is due to the frequency coincidence of antisymmetric vibrations of С-Н bonds in a methylene group and one more Fermi resonance in a methyl group. According to the authors, the line at 2983 cm-1 is also caused by the frequency-coincident antisymmetric stretching vibration of С-Н bonds in a methyl group and Fermi resonance in a methylene group. However, the authors of[16,17] in their interpretation neglected the presence of two conformers in the samples studied. In their theoretical description of computations for the structure and normal molecular vibrations of ethanol the authors have not indicated which of the conformers was involved. But as it was noted above, in gas and liquid phases at room temperatures the gauche-conformer having no symmetry is dominant, all vibration being symmetric formally. Moreover, in any case the appearance of a narrow high-intensity polarized (
 =0.007) line at 2878 cm-1 in a Raman spectrum of СН3СD2ОН necessitates a detailed analysis of the situation. Just this experimental result has enabled the authors of[16,17] to interpret the overlapping lines at 2882 and 2888 cm-1 as
  +
+  , despite the fact that this is at variance with their own computational results for normal molecular vibrations in the harmonic approximation. Even though the authors of[17] believe that a sequence of the computed frequencies is far from being coincident with the experimental one, we (proceeding from our earlier results presented in[24]) think that in the majority of cases the approximations B3LYP/cc-pVDZ and B3LYP/cc-pVQZ are capable of predicting accurately a sequence of the frequencies for normal vibrations. It was already noted that the performed computations for a trans-conformer of normal ethanol reveal symmetric and antisymmetric vibrations of С-Н bonds in a methylene group lying lower than all stretching vibrations of С-Н bonds in a methyl group (Table 1). According to the computations in the anharmonic approximation with regard to all the Fermi resonances possible, three vibrations in СН3 group lie higher than 2900 cm-1. Because of this, for a trans-conformer of СН3СD2ОН the line at 2878 cm-1 is more likely associated with the Fermi-resonance enhanced overtone. The situation for a trans-conformer of normal ethanol may be adequately described taking into consideration Fermi resonance between the
  vibration with the unperturbed “anharmonic” frequency 2953.9 cm-1, and the overtones of the symmetric and antisymmetric bending vibrations of С-Н bonds in the same group with the unperturbed frequencies at 2993.1 and 2910.2 cm-1. The values of the cubic force constants responsible for resonance are equal to -29.9 and -31.0 cm-1. Due to the resonance, the overtone 2910.2 cm-1 is subjected to a bathochromic shift (2892.0 cm-1) and falling within the region of interest. The fundamental vibration acquires the frequency 2953.5 cm-1. So, for a trans-conformer of СН3СН2ОН the lines at about 2870-2890 cm-1 may be associated with the Fermi-resonance enhanced overtone of the antisymmetric bending vibration of С-Н bonds in a methyl group. As it is seen in Table 1, the Fermi-resonance enhanced overtone of the antisymmetric bending vibration of a CH3 group (2892.0 cm-1) is actually the lowest-frequency (2800-3000 cm-1) vibration computed for a trans-conformer of a molecule of СН3СD2ОН. For a gauche-conformer the situation is different. According to the computational results, a
  vibration, as before, has the lowest frequency (2830.4 cm-1) among all stretch vibrations of С-Н bonds in a molecule of СН3СН2ОН, considering anharmonicity and Fermi resonance. But now it is followed by
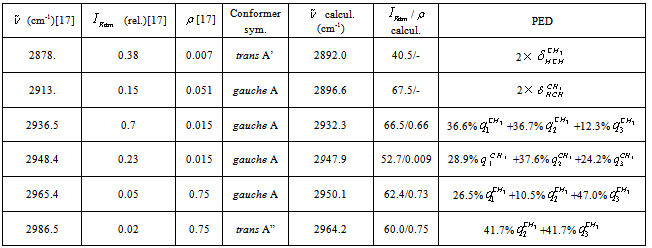
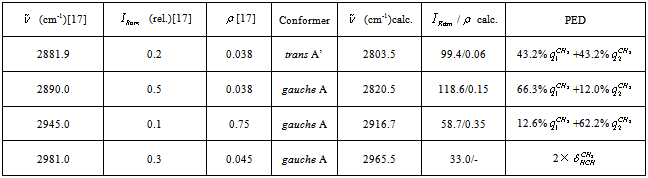
  vibration. The “anharmonic” frequency of this vibration equals 2923.6 cm-1. Being involved into Fermi resonance with three overtones of bending vibrations of a methyl and methylene groups, it is subjected to a bathochromic shift acquiring the frequency 2890.6 cm-1. As it is seen, this vibration may be responsible for the lines appearing in the region 2880-2895 cm-1. High-frequency vibrations of С-Н bonds in СН2 and СН3 groups of a gauche-conformer (2921.4; 2942.6, and 2951.9 cm-1) become strongly mixed, that is uncharacteristic for a trans-conformer. In this respect the results of anharmonic computations support the assumptions made in[10,14]. Apart from a narrow line at 2878 cm-1 in a photoacoustic Raman spectrum for СН3СD2ОН, one can observe two more rather narrow Raman lines at 2913 and 2938 cm-1, and a wide depolarized line near 2962-2988 cm-1 with a maximum close to 2980 cm-1. Comparison of Raman spectra for СН3СD2ОН with IR spectra in a gas phase (see Fig. 3 included by the courtesy of Professor Liu Shilin) exhibits a more complex pattern of the Raman lines due to the appearance of narrow Q-branches for a symmetric vibrations in the IR spectrum. The line at 2938 cm-1, in particular, is rather a doublet with the maximums at 2936.5 and 2948.1 cm-1. Besides, in the IR spectrum the Q-branch at 2986.5 cm-1 is marked, being less obvious at 2965.4 cm-1. Considering the results from Table 1 and taking into account that in gas phase gauche-conformer is dominated, these bands and lines in IR and Raman spectra of СН3СD2OH may be interpreted as in Table 3.Let us consider a photoacoustic Raman spectrum of СD3CH2OH. The authors of[17] indicate three Raman lines: a line with the highest intensity at 2888 cm-1 and two lines of medium intensity at 2945 and 2981 cm-1. Unfortunately, comparison with the IR spectrum is less informative in this case. But it may be assumed that the line at 2888 cm-1 is also complex in its structure. There is an additional maximum at 2881.9 cm-1 and a high-intensity component is observed at 2890 cm-1. Taking into account of the results obtained during the anharmonic computation of vibrations for СD3CH2OH, its spectrum may be interpreted as given in Table 4.Note that the computed vibrational frequencies in a methylene group have a worse agreement with the experimental data (Table 4) compared to the methyl group (Table 3), where the agreement is quite satisfactory. At the same time, a sequence of the computed frequencies for both molecules (СН3СD2ОН and СD3CH2OH) agrees with the experimental one.Let us consider a photoacoustic Raman spectrum of СH3CH2OH. The authors of[17] indicate four Raman lines: the lines with the high intensity at 2888, 2938 and 2983 cm-1 and the line of low intensity at 2917 cm-1. The comparison with the IR spectrum gives additional bands maximums at 2883.7, 2900.0, 2972.7 and 2989.2 cm-1. This is in agreement with[9] (see Table 2). Taking into account the results obtained during the anharmonic computation of frequencies, intensities and depolarization ratio
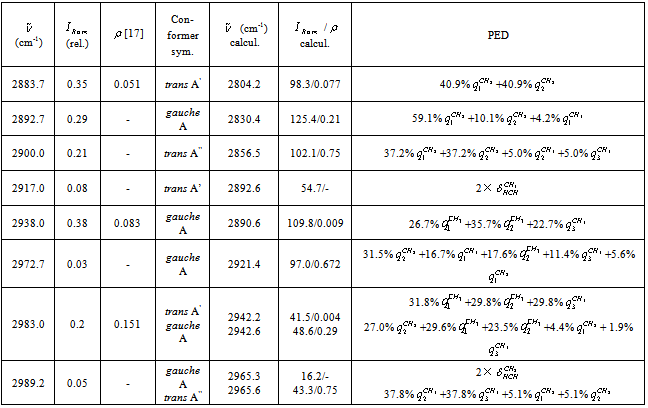
  for СH3CH2OH vibrations, its spectrum may be interpreted as it is given in Table 5.Based on the results listed in Tables 3-5, on the interpretation of the spectra for СН3СD2ОН, СD3CH2OH and СН3СH2ОН, on the foregoing arguments and Table 1, the bands in the region 2870-2900 cm-1 for normal ethanol in argon matrix should be attributed to
  vibration of trans- and gauche-conformers (2804.2 and 2830.4 cm-1) and
  vibration in trans-conformer (2856.5 cm-1). Assigning the other bands in the IR spectrum of ethanol in matrix isolation we take into account the following: 1) trans-conformer of normal ethanol is dominant in the sample; 2) the calculation is able to reproduce the correct sequence of normal vibrations frequencies of the studied molecules; 3) the values of the experimental and calculated intensities of the absorption bands should be taken into account; 4) literature data on the interpretation of IR spectra for ethanol.
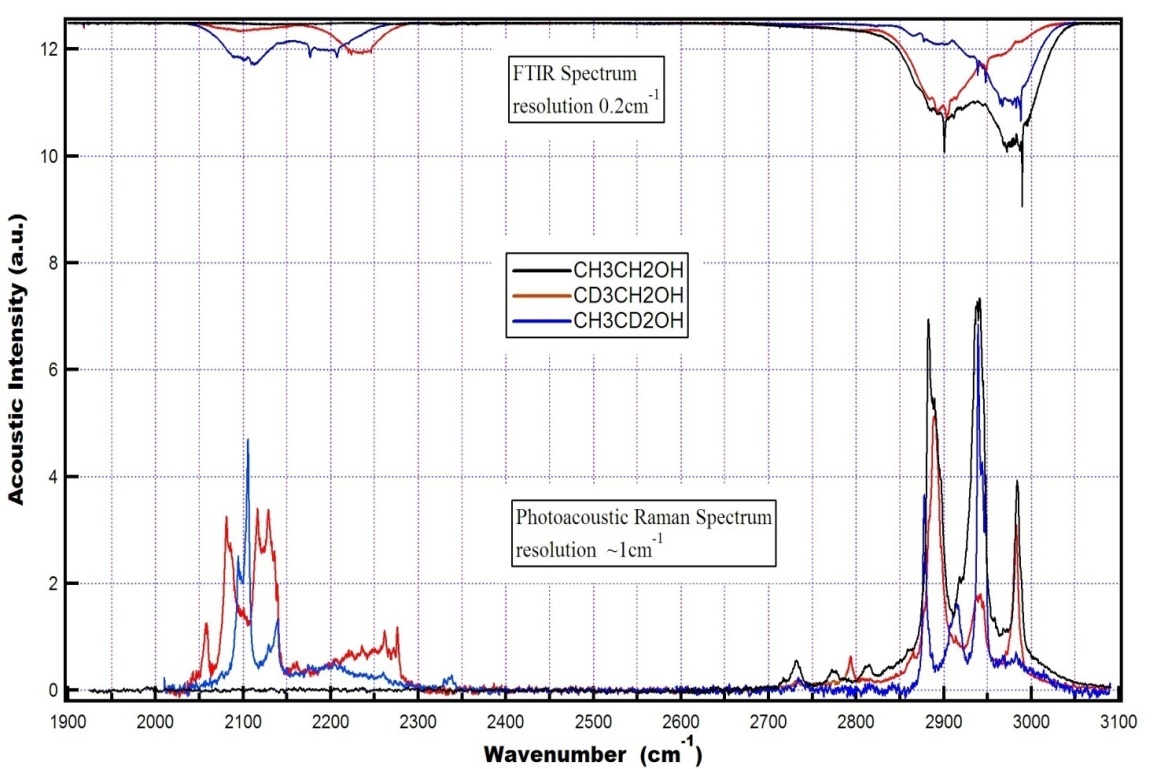 | Figure 3. Photacoustic Raman and IR spectra of the molecules СН3СН2ОН, СD3СН2ОН, and СН3СD2ОН in a gas phase |
|
|
|
|
4. Conclusions
- The low-temperature FTIR spectra of an ethanol isolated in the argon matrix have been obtained at several temperatures from 20 to 50 К for the concentrations 1:1000 and 1:2000. Based on a comparative analysis of these spectra with the literature data (low-temperature spectra of ethanol), the authors have revealed the bands due to absorption of the impurities and associates. The assignments of the bands has been revised owing to the structural computations performed in the approximation B3LYP/cc-pVQZ for gauche- and trans-conformers of the molecules СН3СН2ОН, СD3СН2ОН, СН3СD2ОН and the subsequent anharmonic computations of the corresponding IR and Raman spectra. It has been found that a significant role in the formation of ethanol spectra in 2800 -3000 cm-1 spectral region is played by the Fermi resonance. The resonance effect was taken into consideration during anharmonic analysis of the molecular vibrations of ethanol. It has been demonstrated that ethanol in the argon matrix is mainly in the trans-configuration, despite the fact that the highest-intensity absorption bands of a gauche-conformer are observed in spectra of the samples as well. Without scaling of the quadratic force constants, a good agreement has been attained between the theoretically computed and experimental frequencies, their sequences being practically coincident.
ACKNOWLEDGEMENTS
- This work was supported by the Belarusian Fundamental Research Foundation (Grant №F11К – 032) and the State Fund for Fundamental Researches of Ukraine (Grant № F41/138-2011).The authors are grateful to Professor Liu Shilin for the opportunity of using the experimental IR and photoacoustic Raman spectra of the molecules СН3СН2ОН, СD3СН2ОН, and СН3СD2ОН in a gas phase.