-
Paper Information
- Next Paper
- Previous Paper
- Paper Submission
-
Journal Information
- About This Journal
- Editorial Board
- Current Issue
- Archive
- Author Guidelines
- Contact Us
American Journal of Chemistry
2012; 2(4): 191-208
doi: 10.5923/j.chemistry.20120204.03
Heavy Metal Contamination and Risk Assessment in the Marine Environment of Arabian Sea, along the Southwest Coast of India
 Abstract
 Reference
 Full-Text PDF
 Full-Text HTML
Robin R. S 1, Pradipta R. Muduli 2, K. Vishnu Vardhan 2, D. Ganguly 3, K. R Abhilash 4, T. Balasubramanian 1
1Centre of Advanced Study in Marine Biology, Faculty of Marine Sciences, Annamalai University, India
2Department of Inorganic and Analytical Chemistry, Andhra University, India
3Department of Marine Science, University of Calcutta, India
4Department of Marine Biology, Microbiology and Biochemistry, Cochin University of Science and Technology, India
Correspondence to: Robin R. S , Centre of Advanced Study in Marine Biology, Faculty of Marine Sciences, Annamalai University, India.
| Email: |  |
Copyright © 2012 Scientific & Academic Publishing. All Rights Reserved.
Marine ecosystem is being threatened by the discharge of untreated sewage wastes and industrial effluents which ultimately affects the sustainability of living resources and public health. These wastes carry enormous level of toxicants especially the heavy metals have the tendency to accumulate into the basic food chain and move up through the higher trophic level and results in negative impact on the marine resources thus causing economic loss. In this regard, to ascertain the level of heavy metals in water, particulate, zooplankton (Zn, Mn, Pb, Cu, Cd and Hg) and in sediment (Pb, Al, Cd and Hg) along southern Kerala coast, India has been evaluated during early 2006. The heavy metal concentrations followed the hierarchy; Zn>Mn>Pb>Cu>Cd>Hg; Pb>Zn>Mn>Cu>Cd>Hg; Zn>Pb>Mn>Cu>Cd>Hg and Pb>Al>Cd>Hg in seawater, particulate matter, zooplankton and sediment respectively. The results revealed that in all the transacts (except Cochin) the heavy metal concentrations are below the threshold levels associated with the toxicological effects and the regulatory limits. Metal enrichments were observed close to the major urban areas of coastal waters, mostly associated with large scale industrialization. Enrichment factor, geoaccumulation index and pollution load index were calculated to evaluate the heavy metal threats along the coastal sediment. It revealed minor to moderately severe enrichment of Cd, Pb and Hg in the industrial zones of the coastal stretches especially at Cochin. A comparison with sediment quality guideline quotient indicated that there may be probability of ecotoxicological threats to the benthic community along Cochin transect.
Keywords: Multivariate Statistics, Sediment, Zooplankton, Enrichment Factor, Pollution Load Index
Article Outline
1. Introduction
- Heavy metals are one of the severe pollutants in natural environment due to their toxicity, persistence and bioaccumulation problems[1,2]. Most of the heavy metals are present in seawater in trace concentrations, whereas excessive concentration can affect marine biota and pose risk to consumers of sea food[3]. The impact of anthropogenic perturbation is most strongly felt by estuarine and coastal environments adjacent to urban areas[4]. Pollution of the natural environment by heavy metals is a worldwide problem because these metals are persistent and most of them have toxic effects on living organisms when they exceed a certain concentration[5]. In coastal environments and estuaries, which are often characterized by large industrial settlements and urban areas, the impact of effluent discharges leads to the accumulation of heavy metals[6]. Discharge of greater quantity pollutants into the aquatic environment may result into deterioration of ecological imbalance, changes the physical and chemical nature of the water and aquatic biota[7].Coastal waters act as a transition zone in which continental weathering material is trapped and through which some of the material is transported to the open sea. The composition and variability of total suspended solids (TSS) in this river-ocean boundary are affected by sediment–water interactions, changes in metal adsorption–desorption equilibrium along the salinity gradient or both[8] and physical processes (river flow, tidal energy, currents), therefore often difficult to interpret[9]. Sediments of coastal region can be sensitive indicators for monitoring contaminants in aquatic environments[10, 11], act as a major reservoir of metals[12], and also as a source of contaminants[13] via several pathways, including disposal of liquid effluents, terrestrial runoff, and leachates carrying chemicals originating from numerous urban, industrial, and agricultural activities, as well as atmospheric deposition[14,15,16]. Enrichment of heavy metals due to industrialization and urbanization was recorded in sediments of coastal seas all over the world[1]. The mechanism of biochemical interactions among trace metals and planktonic organisms is one the keys to elucidate the role of trace metals in the ecology of the oceans including bioaccumulation and biomagnification processes. Heavy metal accumulation in aquatic consumers is of interest to ecologists and environmentalists so as to understand the fate and effects of contaminants in the food web dynamics as well as in the biogeochemical cycling of trace elements. Zooplanktons mostly feed on phytoplankton and in turn serve as food for animals at higher trophic level[17] and have been chosen as one of the recommended groups for the base line studies of metals in the marine environment. Significant contributions have been made with references to oceanic and coastal distribution of various heavy metals along the Indian coast[18,19]. However the study of the spatial distributions of dissolved, particulate heavy metals (e.g. Cu, Zn, Mn, Pb, Cd and Hg), their geochemistry and bioaccumulation at primary consumer level in southern Kerala coast is limited. Further the studies on heavy metal distributions and its recycling processes within zooplankton from the Kerala coast, India, not much explored other than the random reports by[20,21]. Hence the present work is first of its kind focusing the sediment water interactions largely affected by anthropogenic inputs and its immediate impact on the primary consumer level.
2. Materials and Methods
2.1. Sampling and Sample Analysis
- Six transects were established for the study along southern Kerala coast between latitudes 9˚ 57’ N and 8˚ 29’ N and longitudes 76˚ 14’ E and 76˚ 53’ E. Transect I (Cochin), transect II (Alleppey), transect III (Kayamkulam), transect IV (Neendakara), transect V (Paravur), and transect VI (Veli) were extended from north to south (Figure 1). Four stations, on each of these transects were selected for sampling viz., nearshore, 2 km, 5 km, 10 km (offshore) across the coast. The water samples were collected by 5 L Niskin sampler, during the cruise onboard CRV Sugar Purvi, during Jan 2006. In situ temperature was recorded using a thermometer (1–51oC range within ± 0.1oC; Brannan, UK). Dissolved oxygen (DO) were fixed and analysed onboard according to Winkler’s method[22] and the remaining water samples were collected in acid washed polythene jerry cans and was filtered through pre-weighted Millipore filter paper (0.45μm). The filtrate was acidified to a pH between 2-3 using suprapure nitric acids for trace metal analysis. Salinity was determined using a Digi-Auto Salinometer (Model TSK, accuracy ± 0.001). Total Suspended solids (TSS) was measured by filtering a known volume of water through 0.45 lm cellulose acetate membrane filters (Millipore), rinsed with copious Milli-Q water and by taking the difference of initial and final weights of filter.
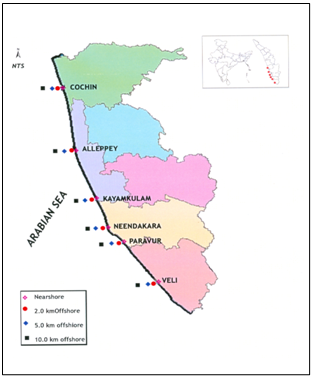 | Figure 1. Sampling sites along southern Kerala coast |
2.2. Data Analysis
- Statistical analysis was performed using Statistical Program for Social Sciences (SPSS version 17). Analysis of variance (ANOVA) without replication was carried out to observe the spatial variations of metal variables. Pearson’s correlation analysis was performed to identify inter-elemental relationship. Cluster analysis (CA) using PRIMER was performed to classify elements of different sources on the basis of their similarities using dendrograms and to identify relatively homogeneous groups of variables with similar properties[27]. Factor analysis (FA) was employed on the variables that are associated with such groupings of hydrogeochemical concentration so as to establish their origin. Simultaneous representation of stations with influenced variables was performed using CANACO statistical package.
|
|
3. Results
3.1. Hydrographic Conditions
- During the study of coastal waters of Kerala experienced a warm humid climate. Among the stations, atmospheric temperature varied from 28.4℃ at Paravur nearshore (estuary) to 31.6℃ at Alleppey 10 km offshore. The surface water temperature ranged from 26.0℃ (Paravur 2 km) to 28.3℃ (at Alleppey 5 km offshore and Veli nearshore. The variation in surface water temperature in all station in different transect might be due to variable intensity of solar radiation, evaporation and water column turbidity etc. There was significant fluctuation in salinity among the stations. The maximum salinity of 34.6 was recorded at Veli 10 km offshore and the minimum 14.7 was recorded at Cochin nearshore (estuary). Among transect, all estuarine stations recorded low salinity compared to offshore stations. This could be attributed to large quantity of fresh water discharge (from backwaters) which is one of the prime factors influencing the abundance and distribution of the fauna and flora in the estuarine and coastal waters. There was not much variation in DO concentration among the stations. The maximum concentration (5.85 mg L-1) was recorded at Alleppey 5 km offshore and minimum (3.28 mg L-1) was recorded at Veli nearshore.
3.2. Heavy Metal Distributions in Water
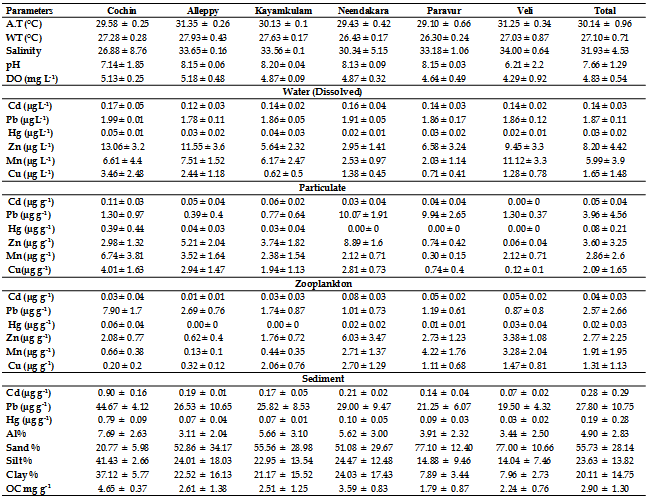
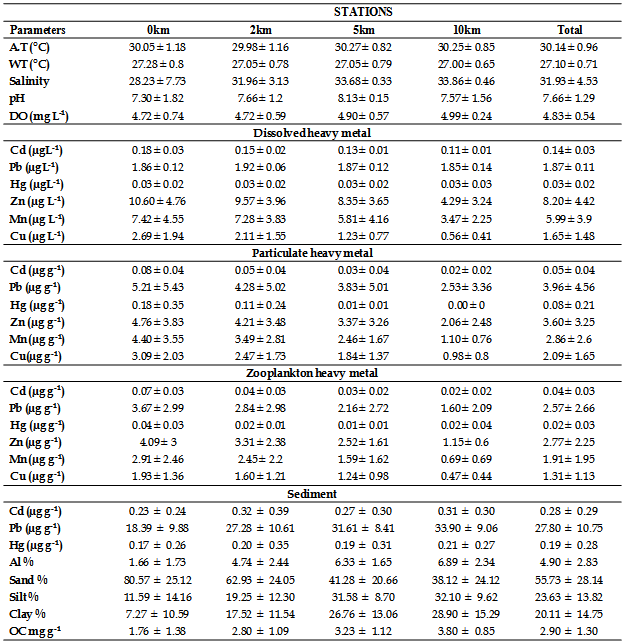
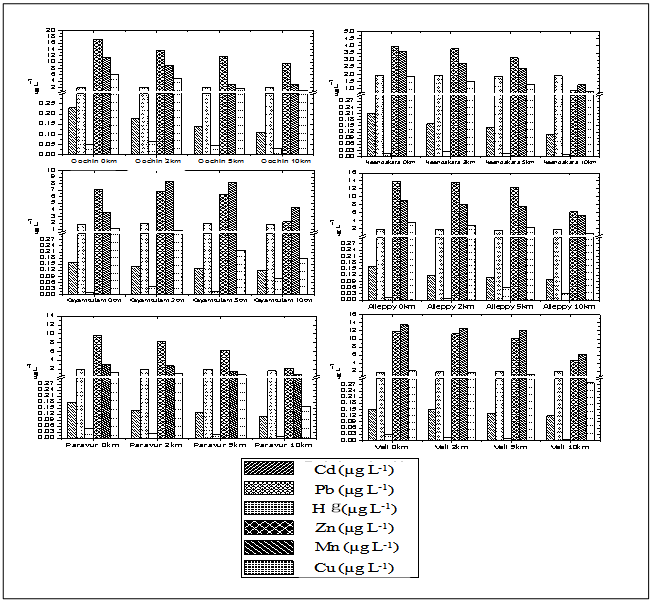
- The mean surface water heavy metal concentration of different transects and stations were shown in Table 1 and 2. ANOVA revealed that spatial variations of all dissolved metals were significant. The magnitude of different heavy metals followed hierarchy, Zn>Mn>Pb>Cu> Cd>Hg. In this study dissolved Hg, Cd, Cu, Pb, Mn and Zn concentrations ranged from 0.007 to 0.065 µg L-1, 0.10 to 0.23 µg L-1, 0.18 to 6.2 µg L-1, 1.6 to 1.99 µg L-1, 0.68 to 13.48 µg L-1 and 0.89 to 17.18 µg L-1, respectively. Spatial distribution of dissolved metals at different stations was illustrated in Figure 2.
3.3. Heavy Metals in Particulate Matter
- In order to understand the factors controlling geochemical processes in coastal waters of Kerala, the distribution of dissolved and particulate heavy metals and their possible interaction with total suspended solid (TSS) was studied. The range and mean of heavy metal concentrations in particulate matter are given in Table 1 and 2. The data revealed that estuarine transect with high TSS contained relatively higher concentrations of particulate heavy metals compared to open coast. The concentration of TSS ranged from 2.16 mg L-1 (Alleppey 10 km offshore) to 12.56 mg L-1 (Veli nearshore). High TSS concentration near Veli transect could be attributed to large amount of factory effluent containing large quantities of ferrous sulphate mostly originated from nearby Travancore Titanium Product (TTP) factory. Rapid oxidation of ferrous to ferric form in the coastal saline water could be responsible for immediate precipitates in colloidal form. This observation is in concord with that by[28, 29].The elevated levels of TSS at Cochin estuary might be due to the extensive dredging, movement of ships and mechanized ferry service that keeps the water churned up to a considerable extent and bring large quantity of suspended matter into water column (Figure 3). The magnitude of different heavy metals in particulate matter followed hierarchy, Pb>Zn>Mn>Cu>Cd>Hg. Spatial distribution of particulate metals at different stations of the inner shelf was illustrated in Figure 4.
3.4. Heavy Metals in Zooplankton
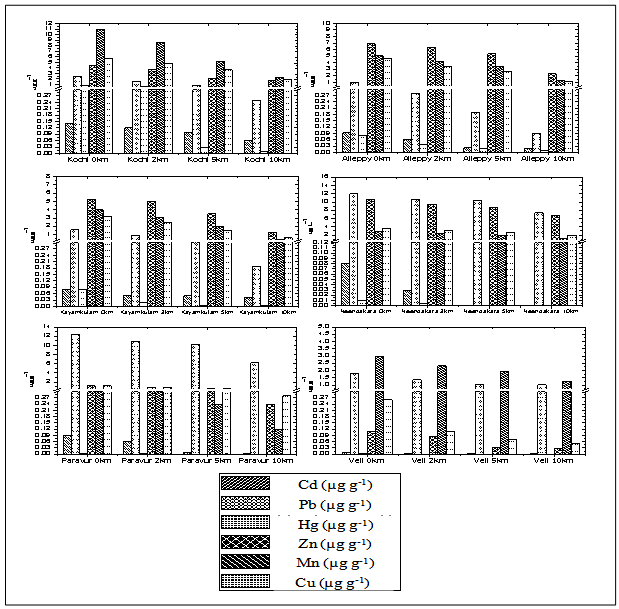
- So far, little information about spatial fluctuations of background concentrations of heavy metals in zooplankton from the southern Kerala coastal waters is available. To fill this gap, heavy metal concentrations in zooplankton from the upper mixed layer (ML) of the southern Kerala were investigated.Moreover, soluble metal concentrations from the ML gives a broader picture of both the environmental conditions of the area under investigation, to assess possible bioaccumulation patterns, and in turn, helps to determine whether or not zooplankton ecology is influenced by the source. The biological composition of zooplankton samples from all the stations of six transect showed that copepods were most dominant in all the samples. Chaetognaths were the next in abundance and this was followed by ostracods and euphausids. The heuristic comparison of the metal concentrations detected in seawater and zooplankton from the ML of coastal sites relied on the concentration ranges, which are compiled in Tables 1 and 2. The metal concentrations in zooplankton of the coastal area vary depending upon the sampling sites. The extent of different heavy metals in zooplankton followed hierarchy, Zn>Pb>Mn>Cu>Cd>Hg (Figure 5). In general, metal concentrations in zooplankton from stations in the Cochin, Alleppy, Kayamkulam and Neendakara region were found to be relatively higher than those in the Paravur and Veli. The high concentrations of heavy metals in zooplankton collected at coastal as well as offshore stations often coincided with high concentrations of dissolved metals, and hence their higher concentrations might be attributed to their higher availability in seawater.
3.5. Sediment Characteristics
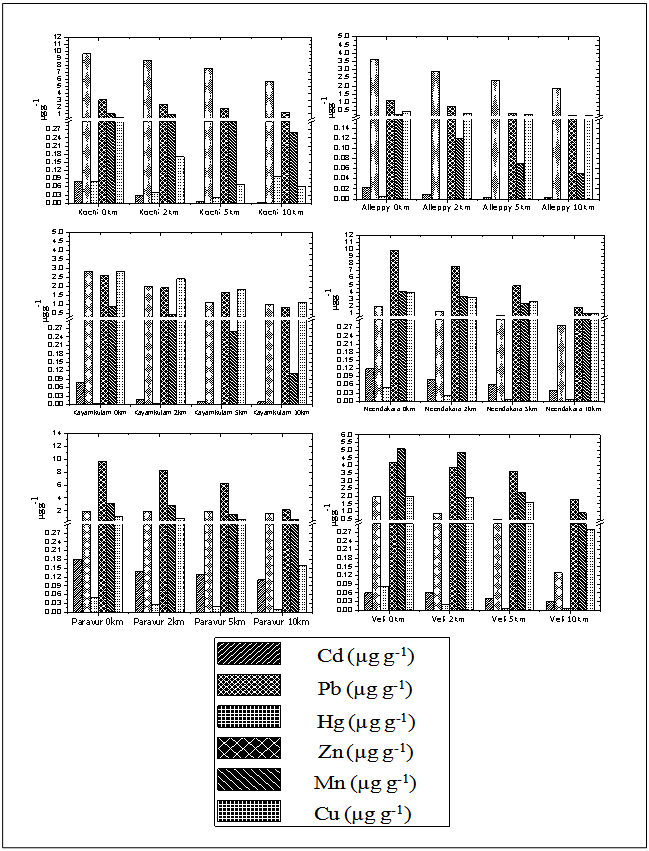
- The sediments were generally rich in organic carbon and predominant in sandy-silt fraction. The nearshore was however characterized by high sand fraction. The textural analysis of the sediment showed higher sand percentage (55.73%) followed by silt (23.63%). The distribution of organic carbon availability in the soil was irregular with comparatively lower concentrations at Paravur and Veli transect. The nearshore sediment recorded low in organic carbon, with low percentage of clay, silt and high percentage of sand. Heavy metal concentrations in sediments are shown in Table 1 & 2. The hierarchy of sediment heavy metals in this present study was as follows, Pb>Al>Cd>Hg. The range of Hg, Cd, Al and Pb in sediment varied from 0.01- 0.91 μg g-1, 0.04-1.10 μg g-1, 0.43-11.12 μg g-1, and 13.50-46.88 μg g-1, respectively (Figure 6).
3.6. Statistical Analysis
- Correlation matrix showed significant positive correlation (P<0.01) between the dissolved and particulate fraction of Cd, Zn and Cu, whereas dissolved Hg showed positive correlation (P<0.05) with sediment texture and organic carbon. Inter-elemental association in dissolved, particulate, zooplankton and sediment has also been evaluated by Pearson’s correlation coefficient (r). The results showed that the dissolved metal pairs of Zn/Mn, (r = 0.666, d.f = 24, P < 0.01); Zn/Cu, (r = 0.774, d.f = 24, P < 0.01) and Cd/Cu (r = 0.656, d.f = 24, P < 0.01) were significantly correlated with each other, whereas the rest of elemental pairs showed no significant correlation with each other. Elemental association may signify that each paired elements has identical source or common sink in the sediments[30, 31]. Particulate metal showed a significant associations (P<0.01) of elemental pairs viz. Zn/Cd, Cd/Hg, Cd/Cu, Zn/Hg, Mn/Pb, Cu/Cd, Cu/Hg and Cu/Mn and Cu/Cd with each other, whereas the rest were not significantly correlated.
 | Figure 2. Variation of dissolved concentrations of Cd, Pb, Hg, Zn, Mn and Cu along transects |
3.7. Cluster (CA), Canonical Component Analysis (CCA) Biplot Analysis
- Seasonal group average clustering from euclidean distances and CCA biplot for lagoon carbon variables is shown in (Figure 7 & 8). The dendrogram revealed a grouping of station based on different sectors. Dendrogram for sampling locations based on the metal concentration for the stations provided a fairly convincing three group of stations.
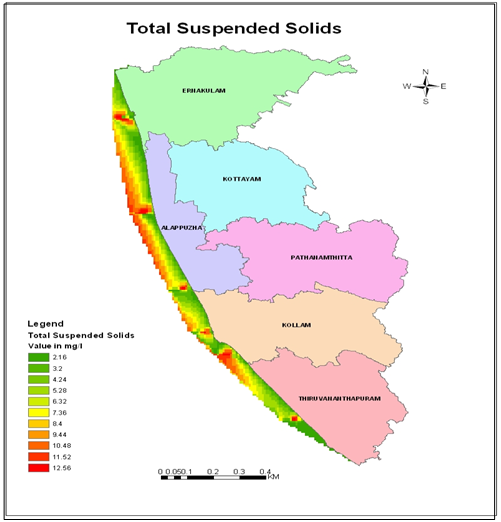 | Figure 3. Variation of total suspended solid along southern Kerala coast |
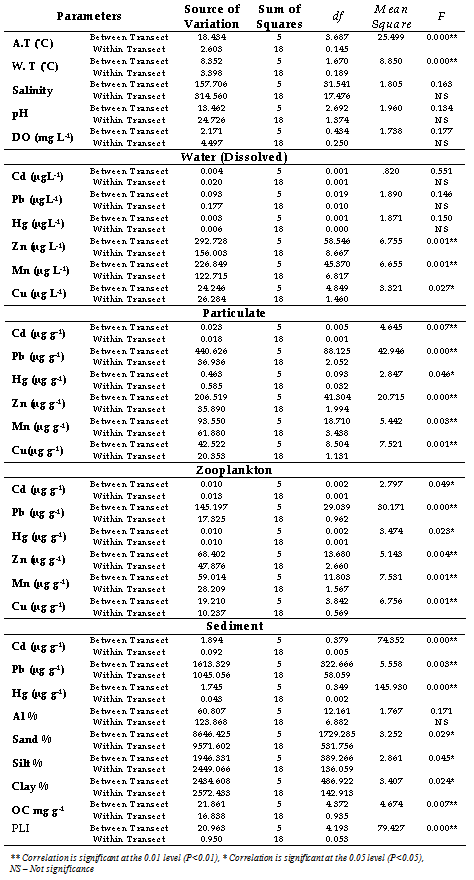
3.8. Factor analysis (FA) and Analysis of Variance (ANOVA)
- Factor analysis was applied to characterize the linear correlations and the loadings of the variables for prime principal components. It may be noted that the loading values expressed the influence of each original variable with a principal component. Factor loading along with the Eigen values and percentage of variance is given in (Table 3). Factor loading (Varimax normalized) larger than approximately 0.7 were considered statistically significant. The factor analysis generated five significant factors, which explained nearly 80% of the variance in data sets. Factor 1 accounted for 35.39% with significant positive loading of Cd, Cu, Zn (dissolved), Hg, Mn, Cu (particulate) and Pb (zooplankton). Factor 2 elucidates 21% of the total variance with positive loadings of silt, clay, OC, sediment Pb and Al. The strong loading of silt, clay, OC along with Pb, Al, sand, silt, clay and OC in the second component can be interpreted in terms of association of those metals as a single source with fine sediments and OC. This factor clearly illustrates the granulometric dependence of these metals with dominant controlling factors like OC. The factor 3, 4 and 5 recorded a total variance of 13.38%, 7.94% and 4.75% with negative loading of atmospheric and water temperature, and particulate Pb with positive loading in factor 3. Both pH and DO showed negative loading, whereas particulate and zooplankton Zn showed positive loading in factor 4. Metals such as Zn, Mn, Cu, Cd, Hg, Pb, silt, clay, OC, pH and salinity with a strong factor loading (> 0.700) found to be a significant parameters contributing to the water quality of these coastal waters. High and positive scores of dissolved metals and sediment characteristic on varifactors 1 or 2 indicated high anthropogenic inputs from catchments. The presence of multiple variables present in the same factor suggested a close association among them and identical source. With the objective of evaluating significant differences among sectors, for all the metal data were analysed using a one-way nonparametric ANOVA. Highly significant differences (P<0.01) were observed for all data in relation to the factor “transect” (Table 4). Sectoral ANOVA for all the variables were significant at the (P<0.01) level except salinity, pH, DO, dissolved Cd, Pb, Hg and sediment Al.
3.9. Geochemical Normalization and Enrichment Factors (EF)
- In an attempt to compensate for the natural variability of major and total trace elements in sediments, normalization was done so that any anthropogenic metal contributions could be detected and quantified. Loring[34] indicated that the natural mineralogical and granular variability is best compensated by the geochemical normalization of major and trace metal data. The following equation was used to estimate the EF of metals from each sediment stations using Al as a normaliser to correct for differences in sediments grain size and mineralogy: EF= (Me/Al)sample/(Me/Al) crustal averageWhere, (Me/Al) sample and (Me/Al) crustal average value are the metal (Me) concentrations (μg/g dw) except Cd, Pb and Hg in relation to Al levels (% dw) in sediment samples, and crustal average values were taken from Turekian and Wedephol[35]. EF values close to unity point to crustal origin, whereas those greater than 10 are considered to be non-crustal source[36]. EF values lower than 0.5 can reflect mobilisation and loss of these elements relative to Al, or indicate an overestimation of the reference metal contents[37]. The EF values were plotted using Box whisker plot (Figure 9) where EF < 1 represents no enrichment, 1-3 is minor; 3-5 is moderate; 5-10 is moderately severe; 10–25 is severe; 25-50 is very severe; and >50 is extremely severe. The ranges of EF values for metals were as follows: Cd (0.2–4.65), Pb (0.35–4.74), Hg (0.026–6.42) and Al (0.20–3.51).
|
 | Figure 4. Variation of particulate concentrations of Cd, Pb, Hg, Zn, Mn and Cu along transects |
3.10. Geoaccumalation Index (Igeo)
- The geo-accumulation index (Igeo) introduced by Muller[39] was used to assess metal pollution in sediments, sampled along southern Kerala coast. Igeo was expressed as follows:Igeo = log2 (Cn / 1.5 × Bn)Where,Cn - measured concentration of heavy metal in the sediment,Bn - geochemical background value in average shale (Turekian and Wedepohl[35] of element n, 1.5 is the background matrix correction in factor due to lithogenic effects. Igeo consists of seven grades or classes, with Igeo of 6 indicating almost 100 fold enrichment above background value[39]. All transects except Cochin found unpolluted in terms of Cd and Pb, whereas moderate Hg pollution in all transects with maximum index along the Cochin was observed (Figure 10). These results indicate clear anthropogenic threats to these coastal waters.
 | Figure 5. Variation of zooplankton concentrations of Cd, Pb, Hg, Zn, Mn and Cu along transects |
3.11. Pollution Load Index
- The assessment of the contamination extent by metals in sediments was further calculated using the Pollution Load Index (PLI)[40] with the heavy metal data and world shale average values of the respective metals[35, 41, 42]. It provides a summative indication of the overall level of heavy metal pollution in a particular sample. PLI was calculated for the area under investigation for only three (Cd, Hg and Pb) of the four studied metals, considering the least toxicity by most abundant metals (Al). PLI was evaluated using the equation
 CF = contamination factor, n = Number of metalsContamination Factor = Metal concentration in sediment / Shale value of the metalThe values of PLI recorded for all the sites ranged between 0.20 and 3.51. The lowest PLI values were found in transects Alleppy, Kayamkulam, Paravur, and Veli, which is represented by a particular group defined in the cluster analysis and the highest values recorded among transects Cochin and Neendakara were grouped in a different cluster. The variation of PLI along the southern Kerala coast is shown in the (Figure 11). PLI values were <1 for all the stations of transect Alleppy, Kayamkulam, Neendakara, Paravur and Veli with few exceptional stations Neendakara (10 km offshore) and all the stations of transect Cochin associated with the large harbour and fish processing activities. The high values in these transects also indicated the accumulation of metals in these regions were from agricultural and domestic discharges. PLI values from all the stations of Cochin was >1 and it progressively increased to a value >3.5 at station 2 km. The PLI revealed an alarming status of the sites on the Cochin compared to the less polluted southern region apart from the stations closer to Alappuzha, Kollam and Thiruvananthapuram.
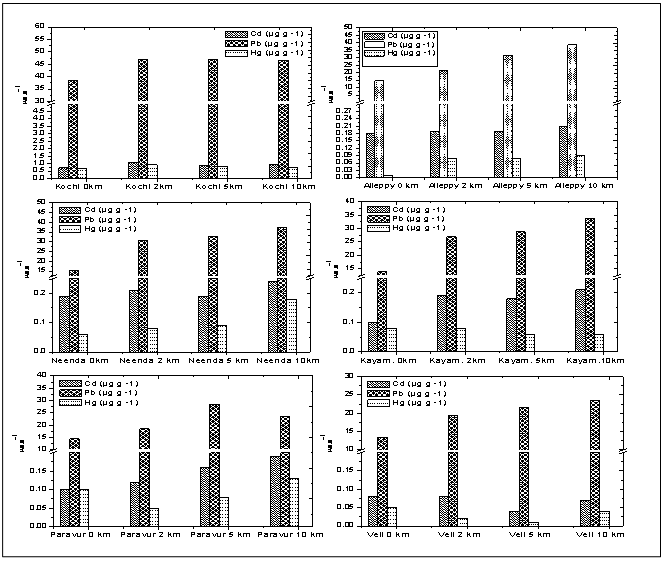 | Figure 6. Variation of sediment concentrations of Cd, Pb and Hg, along transects |
3.12. Ecotoxicological Sense of Heavy Metal Contamination by Using Sediment Quality Guidelines (SQGs)
- The ecotoxicological sense of heavy metal contamination in sediments was determined using SQGs developed for marine and estuarine ecosystem[43]. The results were compared with universal guidelines on sediment toxicity limits by international environmental authority, considering the dependence of the biotic resource of this system. Sediment Quality Guidelines (SQG) is an informal tool to evaluate and categorize the relative quality of sediments[44] and also make an initial assessment of sediment toxicity in the absence of direct biological effects data[45]. Mean SQG quotients were determined as the average of the ratios between the chemical concentrations in the samples and the respective effective range median values (ERM), so as to account for the actual concentration of individual metals as well as their combinations[46].
 Where Ci is the sediment concentration of compound i, ERMi is the Effect Range Median for compound i and n is the number of compound i. The spatial distribution of mean ERM quotient of the sediment samples are shown in Figure 12. The mean ERM quotient of < 0.1 has a 12% probability of being toxic; a mean ERM quotient of 0.11–0.5 has a 30% probability of toxicity; a mean ERM quotient of 0.51–1.5 has a 40% probability of being toxic and a mean ERM quotient of >1.5 has a 74% probability of toxicity[47, 48]. According to this classification, 83.3% of the sediment samples studied can be classified as “low priority” sites with 12% probability of toxicity and 16.6% of the sediment samples sites falling in the “medium–low priority” priority sites with 30% probable toxicity.
 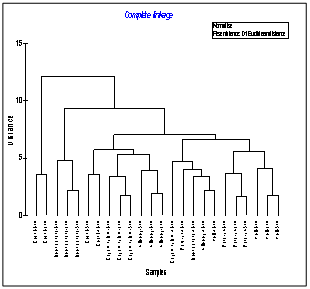 | Figure 7. Dendrogram showing Euclidean distance based similarity of stations along southern Kerala coast |
4. Discussion
- The average concentration levels of dissolved and particulate metals in the water column of the nearshore were relatively higher than the offshore stations. This indicated effective dispersion of metals through dynamic mixing of seawater caused due to wind and under water current. The relative enrichment of dissolved and particulate copper towards the inner shelf when compared with the offshore regions can be attributed to the influence of land run-off and freshwater inputs into the coastal regions. The distribution of dissolved metals Pb>Al>Cd>Hg in all transect exhibited a unique spatial pattern with highest values at near shore stations especially at Cochin harbour stations. This variation in dissolved metal distribution could be attributed to petrochemical industries and chemical speciation under variable environmental condition. The phenomenon of chemical speciation is governed by a number of factors like distribution, mobility, biological availability of chemical elements (i.e. it's chemical or physical association), pH, redox potential and availability of reactive species such as complexing ligands (organic and inorganic), particle surface for adsorption and colloidal matter. Dissolve Cd and Pb in the coastal water indicated that salinity played a major role in the depletion of the dissolved metals during estuarine mixing. As salinity increased, the concentrations of dissolved Pb and Cd decreased. The data revealed that large quantum of metals were removed from the water column and precipitated as suspended matter which may contaminate the bottom sediments. The decrease in the concentration of heavy metals with salinity showed contribution from fresh water sources was insignificant which indicated that point sources and physical mixing of anthropogenic inputs injected by industrial, harbour activity, sewage etc. regulated the metal concentrations along these waters.In particulate matter, Zn concentration was followed by Mn, Cu, Pb, Cd and Hg. High concentrations of metals in the near shore stations especially estuaries suggested its origin from fine grade suspended matter from the industrial and fishing activities or by solubilisation of Cu and Cd from sediment under influence of salinity. The maximum Zn concentration (9.8 µg g-1) recorded at Neendakara nearshore. This could be due to agricultural and domestic discharges, which build up due to the blockage of tidal flushing by salinity barrier and freshwater input from Kallada River. The maximum concentrations of particulate Mn (10.94 µg g-1), Cu (5.62 µg g-1), Pb (2.48 µg g-1), Cd (0.14 µg g-1), and Hg (0.90 µg g 1) was at Cochin near shore (estuary). This could be due to longer residence time of finer fractions of suspended solids in estuaries that facilitate metal uptake by ion exchange processes in lower salinities. The low particulate metal concentrations recorded at offshore stations might be due to solubilisation, precipitation and subsequent incorporation in biological system. These statements are in agreement with that made by[19].Higher concentration of Zn, Pb, Mn, Cu, Cd and Hg in zooplankton of coastal samples relative to that of the offshore samples could be attributed to their industrial source carried through river discharges which increases the bio-availabilities thereby uptake of metals by zooplankton. Zooplankton is of much importance in the cycling processes of elements in the coastal waters. Moreover, being a major source of food for larger animals, their role in transferring the metals to the higher trophic levels is of much importance[21]. Metal accumulation by zooplankton is mainly of two pathways, i.e. direct uptake from water and the assimilation from injected food and detritus[50]. The observed high metal levels including Pb in seawater and zooplankton in the Cochin and Neendakara could be attributed to high influxes at these regions, primarily from automotive exhausts due to loading and unloading of large quantities of general and bulk cargo at these localities. Pb is known to form colloids in seawater, and such colloids would have adsorbed onto planktonic debris, which consequently might have resulted in higher concentration of this element in zooplankton from the coastal waters of Cochin, Kayamkulam and Neendakara, respectively.
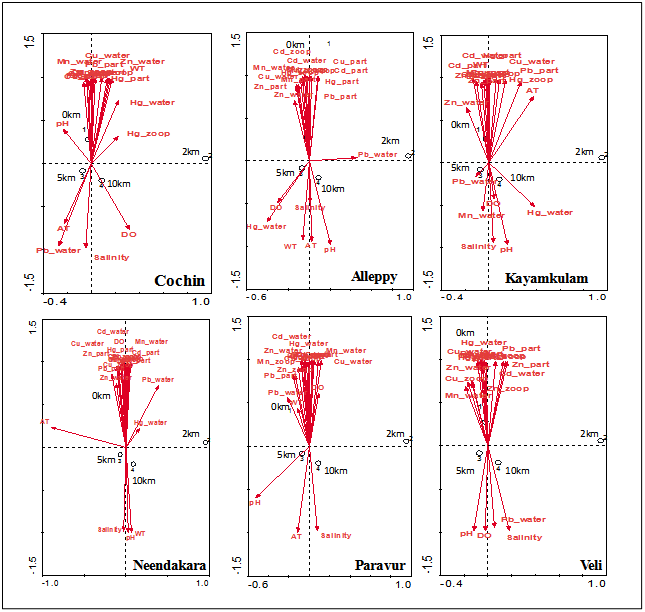 | Figure 8. Canonical correspondence analysis, biplot showing samples and environmental variables |
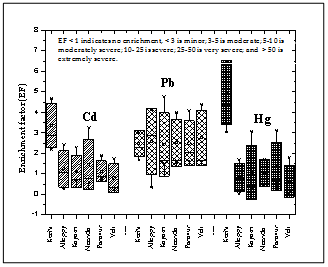 | Figure 9. Enrichment factor tendency of heavy metals in the sediments of southern Kerala coast |
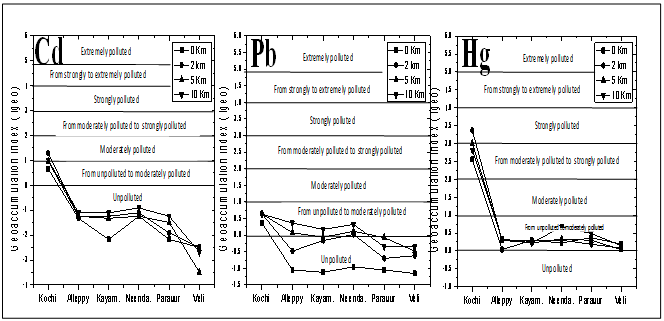 | Figure 10. Geoaccumulation index (Igeo) of Cd,Pb and Hg along southern Kerala coas |
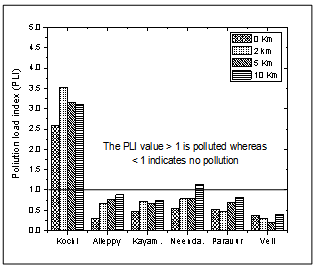 | Figure 11. Variation of pollution load index along southern Kerala coast |
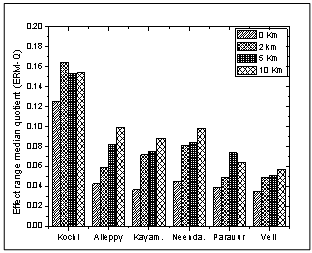 | Figure 12. Variation of effect range median quotient (ERM-Q) along southern Kerala coast |
5. Conclusions
- Seawater, particulate matter, zooplankton and sediment quality was evaluated for heavy metal content and observed to be low with exception of some “hot spots” viz Cochin and Neendakara, in the vicinity of urban, industrial and port activities. Relatively higher enrichment of trace metals in water, particulate and zooplankton of coastal samples compared to the offshore was attributed to be the river discharges carrying substantial industrial effluents which in turn could increase the bio-availabilities thereby uptake of metals. The high concentrations of particulate heavy metals in estuarine environments were attributed to remineralization from sediments and organic matter in the low salinity range. High concentrations of heavy metals in all the forms were observed in Cochin, Kayamkulam and Neendakara compared to the less polluted Paravur and Veli. At Cochin transact, EF, Igeo index and PLI indicated that the sediment quality was deteriorated with respect to Cd, Pb and Hg in sediment which might have severe impact on the ecosystem. This study also revealed that the geochemical distributions of heavy metals were mainly controlled by organic carbon and sediment texture. On the basis of EF and PLI, northern transects were identified as critical point of contamination originated from both urban and industries as point sources. Mean ERM quotient indicated some ecotoxicological risk for benthic organisms especially along Cochin transect. Further studies on bioavailability of metals with their potential toxicity at higher trophic levels and the metal fractionation in sediments should be useful to derive water quality criteria for these waters. The findings of the study indicate the need for proper industrial planning and the safe disposal of industrial and urban waste, which would otherwise lead high levels of pollutants in to coastal ecosystem of Kerala, and would greatly invite socioeconomic disaster.
ACKNOWLEDGEMENTS
- The authors are grateful to Ministry of Earth Sciences, Government of India for the financial support during the study period. The authors are grateful to university authorities for the support in preparation of this manuscript is gratefully acknowledged. We would also like to record our deep appreciation to our colleagues who assisted us in sampling, analysis, post processing and manuscript preparation.
References
| [1] | Pekey, H., 2006, The distribution and sources of heavy metals in Izmit Bay surface sediments affected by a polluted stream. Marine Pollution Bulletin, 52 (10), 1197 – 1208. |
| [2] | Nouri, J., Mahvi, A.H., Babaei, A., and Ahmadpour, E., 2006, Regional pattern distribution of groundwater fluoride in the Shush aquifer of Khuzestan County Iran, Fluoride, 39 (4), 321–325. |
| [3] | Turner, A., 1996, Trace metals portioning in estuaries importance of salinity and particulate concentration. Marine Chemistry, 54, 27 – 39. |
| [4] | Nouri, J., Karbassi, A.R., and Mirkia, S., 2008, Environmental management of coastal regions in the Caspian Sea. International Journal of Environmental Science and Technology, 5 (1), 43 –52. |
| [5] | Chakraborty, R., Zaman, S., Mukhopadhyay, N., Banerjee, K., and Mitra, A., 2009, Seasonal variation of Zn, Cu and Pb in the estuarine stretch of west Bengal. Indian Journal of Marine Science, 38 (1), 104 –109. |
| [6] | Ridgway, J., and Shimmield, G., 2002, Estuaries as repositories of historical contamination and their impact on shelf areas. Estuarine, Coastal and Shelf Science, 55, 903–928. |
| [7] | Mitra, A., Trivedi, S., Gupta, A., et al. 1996, Distribution of trace metals in the sediments from Hooghly estuary, India. Pollution Research, 15, 137 – 141. |
| [8] | Edmond, J.M., Spivack, A., Grant, B.C., et al. 1985. Chemical dynamics of the Changjiang estuary. Continental Shelf Research, 4 (1–2), 17–36. |
| [9] | Turner, A., Millward, G.E., and Tyler, A.O., 1994, The distribution and chemical composition of particles in a macro tidal estuary. Estuarine and Coastal Shelf Science, 32, 325 – 346. |
| [10] | Balls, P.W., Hull, S., Miller, B.S., Pirie, J.M., and Proctor, W., 1997, Trace metal in Scottish Estuarine and coastal sediments. Marine Pollution Bulletin, 34, 42 – 50. |
| [11] | Atgın, R.S., El-Agha, O., Zararsız, A, et al. 2000, Investigation of the sediment pollution in Izmir Bay: trace elements. Spectrochimica Acta Part B 55, 1151–1164. |
| [12] | Caccia, V.G., Millero, F.J., and Palanques, A., 2003, The distribution of trace metals in Florida Baysediments. Marine Pollution Bulletin, 46, 1420 –1433. |
| [13] | Adams, W.J., Kimerle, R.A., and Barnett, R.A., Jr. 1992, Sediment quality and aquatic life assessment. Environmental Science and Technology, 26, 1865 –1875. |
| [14] | Rivail Da Silva M., Lamotte, M., Donard, O.F.X., et al. 1996, Metal contamination in surface sedimentsof mangroves, lagoons and Southern Bay in Florianopolis Island. Environmental Technology, 17, 1035 – 1046. |
| [15] | Karageorgis, A.P., Sioulas, A.I., and Anagnostou C.L., 2002, Use of surface sediments in Pagassitikos Gulf, Greece, to detect anthropogenic influence. Geo-Marine Letters 21: 200 –211. |
| [16] | Mucha, A.P., Vasconcelos, M.T.S.D., and Bordalo, A.A., 2003, Macro benthic community in the Douro Estuary: relations with trace metals and natural sediment characteristics. Environmental Pollution, 121, 169 – 180. |
| [17] | Kleppel, G.S., 1993, On the diets of calanoid copepods. Marine Ecology Progress Series, 99, 183 – 195. |
| [18] | Govindasamy, C., Azariah. J., 1999, Seasonal variation of heavy metals in coastal waters of Coramandal coast, Bay of Bengal. Indian Journal of Marine Sciences, 28, 249-256. |
| [19] | Ouseph, P.P., 1992, Dissolved and particulate trace metals in the Cochin estuary. Marine Pollution Bulletin, 24 (4), 186 –192. |
| [20] | George, M.D., Kureishy, T.W., 1979, Trace metals in zooplankton from the Bay of Bengal. Indian Journal of Marine Sciences, 8, 190 – 192. |
| [21] | Gajbhiye, S.N., Vijayalakshmi, R.N., Narvekar, P.V., and Desai B.N., 1985, Concentration and Toxicity of some metals in zooplankton from near shore waters of Bombay. Indian Journal of Marine Sciences, 14, 181–183. |
| [22] | Grasshoff, K., Ehrhardt, M., and Kremling, K., 1999, Methods of Sea water analysis, 3rd edition, Verlag Chemie, Weinheim, Germany. 89 – 224. |
| [23] | Brooks, R.R., Presley, B.J., and Kaplan I.R., 1967, APDC-MIBK extraction system for the determination of trace elements in saline waters by Atomic Absorption Spectrophotometry. Talata 14: 809-816. |
| [24] | Loring, D.H., Rantala, R.T.T., 1992, Manual for Geochemical Analysis. Earth Science Reviews, 32, 235-283. |
| [25] | USEPA., 1979, Methods for chemical analysis of water and wastes. EPA - 600/4-79 020, p. 294. |
| [26] | Krumbein, W.C., Petti John, F.J., 1938, Manual of sedimentary petrography. Appleton, New York. 549–551. |
| [27] | Robin, R.S., Vardhan, K.V., Muduli, P.R., et al. 2010, Vertical distribution of biological characteristics and phytoplankton community structure in the shelf waters off southwest coast of India. International Journal of Current Research, 8, 016 – 034. |
| [28] | Bijumon, K.B., Robin, R.S., Sunil Kumar, S., and Ouseph, P.P., 1999, Effect of factory effluent on the biological productivity of coastal marine system at Veli, Thiruvananthapuram. Proceeding of the 12th Kerala Science Congress, Kumily, Kerala, India, 27-29 January 1999. pp 205-207. Kerala State Council for Science, Technology and Environment (KSCSTE) Publishing. |
| [29] | Rajalakshmi, B, 2004, Coastal and ground water pollution studies along the Veli coast, Thiruvananthapuram. M.Sc. dissertation, Bharathidasan University, Thiruchirapalli, India. |
| [30] | Singh, M., Muller, G., and Singh, I.B, 2002, Heavy metals in freshly deposited stream sediments of rivers associated with urbanization of the Ganga plain, India. Water, Air, & Soil Pollution, 141(1-4), 35 – 54. |
| [31] | Nyangababo, J.T, Henry, I., and Omutunge, E., 2005, Heavy metal contamination in plants, sediments and air precipitation of Katonga, Simiyu and Nyando wetlands of Lake Victoria Basin. East Africa. Bulletin of Environmental Contamination and Toxicology, 75 (1), 189 –196. |
| [32] | Padmalal, D., Maya, K., and Seralathan, P., 1997, Geochemistry of Cu, Co, Ni, Zn, Cd and Cr in the surficial sediments of a tropical river and estuary, south west coast of India. A granulometric approach. Environmental Geology, 31, 85 – 93. |
| [33] | Marchand, C., Lalliet, V.E., Baltzer, F., et al. 2006, Heavy Metals Distribution in Mangrove Sediments along the Mobile Coastline of French Guiana. Marine Chemistry, 98: 1 –17. |
| [34] | Loring, D.H., 1991, Normalization of heavy-metal data from estuarine and coastal sediments, ICES Journal Marine Sciences 48 (1): 101-115. doi:10.1093/icesjms/48.1.101. |
| [35] | Turekian, K.K., and Wedepohl, K.H., 1961, Distribution of the elements in some major units of the earth's crust. Geological Society of America Bulletin, 72, 175 – 192. |
| [36] | Nolting, R.F., Ramkema, A., and Everaats, J.M., 1999. The geochemistry of Cu, Cd, Zn, Ni and Pb in sediment cores from the continental slope of the Banc d’Arguin (Mauritania). Continental Shelf Researc,h 19: 665 – 691. |
| [37] | Zhang J., 1995, Geochemistry of trace metals from Chinese river/estuary systems: an overview. Estuarine, Coastal and Shelf Science, 41, 631 – 658. |
| [38] | Birch, G., 2003, A scheme for assessing human impacts on coastal aquatic environments using sediments. in: Woodcoffe, C. D., Furness, R. A. (Eds.), Coastal GIS 2003. Wollongong University Papers in Center for Maritime Policy, 14, Australia. |
| [39] | Muller, G., 1979, Schwermetalle in den Sedimenten des Rheins Veranderungenseit. Umschau, 79 (24), 778 –783. |
| [40] | Tomlinson, D.L., Wilson, J.G., Harris, C.R., Jeffney, D.W., 1980. Problems in the assessment of heavy metals levels in estuaries and the formation of pollution index: Helgol. Wiss. Meeresunters, 33, 566. |
| [41] | Badr, N.B.E., El-Fiky, A.A., Mostafa, A.R, and Al-Mur B.A., 2009. Metal pollution records in core sediments of some Red Sea coastal areas, Kingdom of Saudi Arabia. Environmental Monitoring and Assessment 155(1–4): 509 – 526. |
| [42] | Ray, A.K, Tripathi, S.C, Patra, S, and Sarma, V.V., 2006, Assessment of Godavary estuarine mangrove ecosystem through trace metal studies. Environment International, 32, 219 – 223. |
| [43] | Bakan, G., Ozkoc, H.B., 2007, An ecological risk assessment of the impact of heavy metals in surface sediments on biota from the mid-Black Sea coast of Turkey. International Journal of Environmental Studies, 64 (1), 45 – 57. |
| [44] | Long, E.R., Field, L.J., and Macdonald, D.D., 1998, Predicting toxicity in marine sediments with numerical Sediment Quality Guidelines. Environmental Toxicology and Chemistry, 17 (4), 714 –727. |
| [45] | Birch, G.F., Taylor, S.E., 2002, Application of sediment quality guidelines in the assessment of contaminated surficial sediments in Port Jackson (Sydney Harbour), Australia. Environmental Management, 29 (6), 860 – 870. |
| [46] | Long, E.R., Field, L.J., MacDonald, D.D., 1998, Predicting toxicity in marine sediments with numerical sediment quality guidelines. Environmental Toxicology & Chemistry 17:714- 727. |
| [47] | Long, E.R., MacDonald, D.D., Severn, C.G., and Hong, C.B., 1998, Classifying probabilities of acute toxicity in marine sediments with empirically derived sediment quality guidelines. Environmental Toxicology and Chemistry, 19, 2598 – 2601. |
| [48] | Essien, J.P., Antai, S.P., and Olajire, A.A., 2009. Distribution, seasonal variations and ecotoxicological significance of heavy metals in sediments of Cross river, estuary mangrove swamp. Water, Air, and Soil Pollution 197: 91 – 105. |
| [49] | Martin, G.D., Nisha, P.A., Balachandran, K.K., et al. 2011, Eutrophication induced changes in benthic community structure of a flow restricted tropical estuary (Cochin backwaters), India. Environmental Monitoring and Assessment, 176 (1-4), 427-438. |
| [50] | Davies, A.G., 1978, Pollution studies with marine plankton. Part II. Heavy metals. Advances in Marine Biology, 15, 381 – 478. |
| [51] | Reddy, H.R., and Hariharan, V., 1986, Distribution of nutrients in the sediments of the Netravathi-Gurupur estuary, Mangalore. Indian Journal of Fisheries, 33, 123 – 126. |
| [52] | Balachandran, K.K., Laluraj, C.M., Nair, M, et al. 2005, Heavy metal accumulation in a flow restricted, tropical estuary. Estuarine and Coastal Shelf Science, 65, 361 – 370. |
| [53] | Balachandran, K.K., Laluraj, C.M., Martin, G.D., et al. 2006. Environmental analysis of heavy metal deposition in sediments of an impacted tropical ecosystem. Environmental Forensics, 7, 345 – 351. |
| [54] | Lu, J.C.S., and Chen, K.Y., 1977, Migration of trace metals in interfaces of sea water and polluted surficial sediments. Environmental Science and Technology, 11, 174 – 182. |
| [55] | Sarma, V.V., Vara Prasad, S.J.D., Gupta, G.V.M, and Sudhakar, U. 1996. Petroleum hydrocarbons and trace metals in Visakhapatnam harbour and Kakinada Bay, east coast of India. Indian Journal of Marine Sciences 25: 148 – 150. |
| [56] | Madhupratap, M., 1987, Status of zooplankton of tropical Indian estuaries, A review. Bulletin of Plankton Society of Japan, 34, 65 – 81. |
| [57] | Vallius, H., 1999, Heavy metal deposition and variation in sedimentation rate within a sedimentary basin in central Gulf of Finland. Chemosphere, 38, 1959 – 1972. |
| [58] | Nair, C.K., Balchand, A.N., and Nambisan, N.P.K., 1991. Heavy metal speciation in sediments of Cochin estuary determined using chemical extraction techniques. Science of The Total Environment, 102, 113 –128. |