American Journal of Chemistry

p-ISSN: 2165-8749    e-ISSN: 2165-8781

2012;  2(3): 171-180

doi: 10.5923/j.chemistry.20120203.13

Sediment Heavy Metal Contaminants in Vasai Creek Of Mumbai: Pollution Impacts

Pravin U. Singare, Manisha P. Trivedi, Ravindra M.

Department of Chemistry, Bhavan’s College, Munshi Nagar, Andheri (West), Mumbai 400058, India

Correspondence to: Pravin  U. Singare, Department of Chemistry, Bhavan’s College, Munshi Nagar, Andheri (West), Mumbai 400058, India.

Email:

Copyright © 2012 Scientific & Academic Publishing. All Rights Reserved.

Abstract

In the present investigation, quantification study of different toxic heavy metals in the sediment samples of Vasai Creek of Mumbai was performed using Atomic Absorption Spectroscopy technique. The study is of importance because such assessment of heavy metals in sediments helps to understand long term pollution load in aquatic environment. Such study will also help to provide a means for evaluating the long term accumulation of heavy metal contaminants. The results of the study indicates that the concentration level of most of the toxic heavy metals like Al, As, Cd, Cr, Hg, Ni, Pb, Sr and Mn for the assessment year 2010-11 were higher than that obtained for the year 2009-10 by the factor of 1.0 to 2.5 µg/g. It is expected that results of present investigation will help in rational planning of pollution control strategies so as to reduce the toxicity impact on marine life of Vasai Creek.

Keywords: Toxic Heavy Metals, Sediments; Marine Life, Quantification, Atomic Absorption Spectroscopy, Cold Vapour Technique, Vasai Creek, Mumbai, India

1. Introduction

Heavy metals are among the most common environmental pollutants, and their occurrence in waters and biota indicate the presence of natural or anthropogenic sources. Their accumulation and distribution in soil, water and environment are increasing at an alarming rate causing deposition and sedimentation in water reservoirs and affecting aquatic organisms as well[1-5]. Heavy metals like chromium, lead, cadmium, arsenic, etc. exhibit extreme toxicity even at trace levels. Creeks and Rivers are dominant pathways for metals transport[6,7] and heavy metals become significant pollutants of these water bodies[8]. These toxic metals not only pollute the aquatic systems but also pose a threat to the aquatic biota. The increase in residue levels of heavy metal content in water, sediments and biota, will result in decreased productivity [9] and increase in health risk in case of human beings[10-13]. The behaviour of metals in natural waters is a function of the substrate sediment composition, the suspended sediment composition, and the water chemistry. During their transport, the heavy metals undergo numerous changes in their speciation due to dissolution, precipitation, sorption and complexation phenomena[8,14,15] which affect their behaviour and bioavailability[16,17]. For better understanding of heavy metal sources, their accumulation in the sediment and in water seem to be particularly important issues of present day research on risk assessments.
In hydrosphere, toxic metal concentrations are typically orders of magnitude greater in the sediments as compared to those in overlying waters. The capacity of sediments to concentrate trace levels of most of the metals make them useful indicators for monitoring purposes and for detecting sources of pollution in the aquatic system. These heavy metals are sensitive indicators for monitoring changes in the water environment. Also the experimental data obtained based on analysis of sediment cores helps to provide a historical record of the heavy metal burdens.
The problem of environmental pollution due to heavy metals has begun to cause concern now in most of the major metropolitan cities in Maharashtra state and Mumbai is not an exception to it. The day by day increasing tremendous industrial pollution [18-27] has prompted us to carry the systematic and detail study of pollution due to toxic heavy metals in sediments of Vasai Creek which due to rapid urbanisation and industrialisation is considered as one of the highly polluted creeks of Mumbai.

2. Materials and Methods

2.1. Area of Study

Vasai Creek is an estuarine creek, one of the two main distributaries of the Ulhas Creek in Maharashtra state of western India. The Ulhas Creek splits at the northeast corner of Salsette Island into its two main distributaries, Vasai Creek and Thane Creek. Vasai Creek which lies between latitude 19.315°N longitude 72.875°E, forms the northern boundary of Salsette Island, and empties west into the Arabian Sea. The Creek receives domestic raw sewage as well as industrial waste water effluent from surrounding habitation and nearby industrial belt. The activities like cattle washing, cloth washing, and religious activities like immersion of idols of Lord Ganesha and Deity Durga during Ganesh festival and Navratri festival is also a major source of pollution of creek water.

2.2. Climatic Conditions

Climate is subtropical, with mild winters and warm summers. The weather is typical coastal sultry and humid. The average rainfall of records from 1500 mm to 2000 mm. The place experiences the onset of the monsoon in the month of June and experiences monsoon till the end of September. The average temperature recorded in varies from 25 to 37 degrees.

2.3. Requirements

The chemicals and reagent used for analysis were of analytical reagent grade. The procedure for calculating the different parameters were conducted in the laboratory. The laboratory apparatus were soaked in nitric acid before analysis and then rinsed thoroughly with tap water and deionised distilled water to ensure any traces of cleaning reagents were removed. Finally, it is dried and stored in a clean place. The pipettes and burette were rinsed with the same solution before final use.

2.4. Sediment Sampling and Preparation

The sediment samples were collected randomly four times in a month in morning, afternoon and evening session at four different sampling stations namely Vasai Bundar (S-1) , Bhayandar west side of Railway Bridge (S-2), Bhayandar east side near Reti Bundar (S-3), and Ghodbundar site (S-4) along the Vasai Creek (Figure 1). The samples were collected and subsequently analysed for a span of two years starting from October 2009 to September 2011. The sampling was done in three shifts i.e. morning shift between 07:00 a.m. to 09:00 a.m., afternoon shift between 02:00 p.m. to 04:00 p.m. and evening shift between 07:00 p.m. to 09:00 p.m. Sediment samples were collected by hand-pushing plastic core tubes (7 cm diameter) as far as possible into the sediment. The sediment cores retrieved in the field were sliced on arrival at the lab at 1-cm depth intervals for the first 15 cm, 2-cm depth intervals from 15–25 cm, and then every 5 cm for the deeper sections of the cores. The sediments were kept cool in icebox during the transportation to the laboratory [28]. They were then ground manually to a fine powder in an alumina mortar; it is passed through a 2-mm mesh screen and stored in polyethylene bags and kept in a dry place until analyses. Well-mixed samples of 2 g each were taken in 250 mL glass beakers and digested with 8 mL of aqua regia on a sand bath for 2 h. After evaporation to near dryness, the samples where dissolved with 10 mL of 2% nitric acid, filtered through Whatman’s No. 1 filter paper and then diluted with deionised water to give final volumes depending on the suspected level of the metals [29]. The samples were subjected to nitric acid digestion using the microwave-assisted technique, setting pressure at 30 bar and power at 700 watts [30, 31]. About 400 mL of the sample was transformed into clean glass separating funnel in which 10 mL of 2% ammonium pyrrolidine dithiocarbamate, 4 mL of 0.5 M HCl and 10 mL of methyl isobutyl ketone (MIBK) are added [32]. The solution in separating funnel was shaken vigorously for 2 min and was left undisturbed for the phases to separate. The MIBK extract containing the desired metals was then diluted to give final volumes depending on the suspected level of the metals [33]. The sample solution was then aspirated into air acetylene flame in an atomic absorption spectrophotometer.
Figure 1. Map Showing Sampling Stations along Vasai Creek of Mumbai

2.5. Heavy metal analysis by AAS technique

The analysis for the majority of the trace metals like Aluminum (Al), cadmium (Cd), chromium (Cr), nickel (Ni), lead (Pb), strontium (Sr) and manganese (Mn) was done by Perkin Elmer ASS-280 Flame Atomic Absorption Spectrophotometer. Arsenic (As) was determined by hydride generation coupled with an atomic fluorescence detector, while mercury (Hg) was analysed with a cold-vapour atomic adsorption spectrophotometer. The calibration curves were prepared separately for all the metals by running different concentrations of standard solutions. A reagent blank sample was taken through the method, analyzed and subtracted from the samples to correct for reagent impurities and other sources of errors from the environment. Average values of three replicates were taken for each determination.

2.6. Quality Control/Assurance

Sediment samples were collected with plastic-made implements to avoid contamination. Samples were kept in polythene bags that were free from heavy metals and organics and well covered while transporting from field to the laboratory to avoid contamination from the environment. All reagents were standardised against primary standards to determine their actual concentrations. All instruments used were calibrated before use. Tools and work surfaces were carefully cleaned for each sample during grinding to avoid cross contamination. Replicate samples were analysed to check precision of the analytical method and instrument. To validate the analytical procedures used, the spike recovery test was conducted on some samples for Al, As, Cd, Cr, Ni, Pb, Sr, Mn and Hg.

3. Results and Discussion

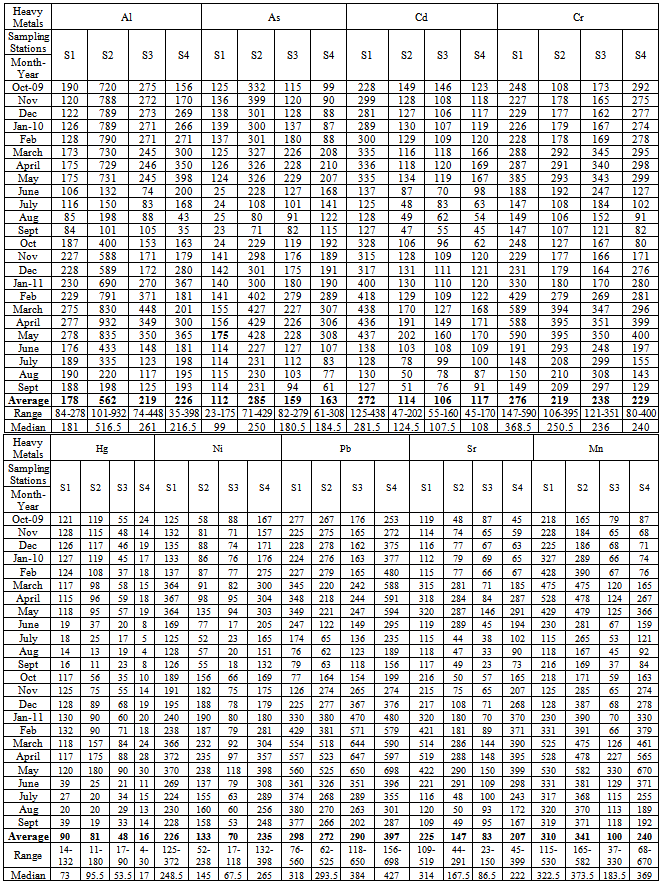
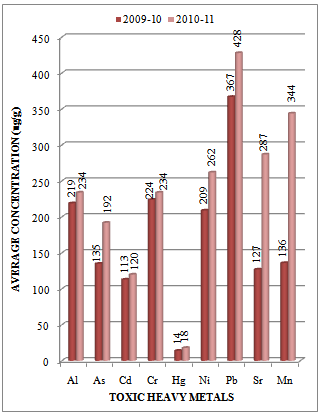
Heavy metals, known to be potentially hazardous substances, are present in both natural and contaminated environments. In natural environments, they occur at low concentrations. However, at high concentrations as is the case in contaminated environments, they result in public health impacts. The elements that are of concern include nickel, cadmium, chromium, mercury, lead, strontium, manganese, Aluminum and arsenic. These toxic heavy metals entering in aquatic environment are adsorbed onto particulate matter, although they can form free metal ions and soluble complexes that are available for uptake by biological organisms. The metals associated with particulate material are also available for biological uptake, and are deposited in estuarine sediments[34]. Once deposited, binding by sulfides and/or iron hydroxides immobilises trace metals until a change in redox or pH occurs[35]. Thus, surfical sediments, particularly the fine fraction, accumulate trace metals and provide a means for evaluating the long term accumulation of heavy metal contaminants[36]. The study of such trace and toxic heavy metals in the environment is more important in comparison to other pollutants due to their non-bio- degradable nature, accumulative properties and long biological half lives. These toxic heavy metals can be absorbed by green plants, which are primary producers in the ecosystem. As they move up the food chain from producers to consumers, they endanger the public health by bioaccumulating in the plant and animal tissues and can cause physiological and neurological disorders
The experimental data on concentration (µg/g) of toxic heavy metals like Al, As, Cd, Cr, Hg, Ni, Pb, Sr and Mn in the sediment samples collected along sampling stations S1, S2, S3 and S4 of Vasai Creek is presented in Table 1. The trend in average concentration of these metals at different sampling stations for two assessment years 2009-10 and 2010-11 is graphically represented in Figures 2-5. From the results it was observed that Aluminum (Al) concentration at different sampling stations lies in the range of 84-278,101-932, 74-448 and 35-398 µg/g at the respective sampling stations. The biyearly average Al concentration was found to be 178, 562, 219 and 226 µg/g respectively at different sampling stations (Table 1). It was also observed that the average Al concentration for assessment year 2010-11 was higher than that obtained for the assessment year 2009-10 by a factor of 1.03 at S2 to 1.68 at S1 (Figures 2-5). It is important here to note that Al toxicity is a potential growth-limiting factor for plants grown in acid soils in many parts of the world [37]. The major Al toxicity symptom observed in plants is inhibition of root growth [38]. The roots exhibit greater signs of cellular damage than other parts of the plant [39]. Al toxicity could be observed in the root system particularly in root-tips and in lateral roots; lateral roots become thickened and turn brown [40]. The root system as a whole is corraloid in appearance with many stubby lateral roots but lacks fine branching. Aluminum interferes with cell division in roots, decreases root respiration and uptake and use of water and nutrients, particularly calcium and phosphorous and metabolic pathway [41].
Levels of arsenic (As) are higher in the aquatic environment than in most areas as it is fairly water-soluble and may be washed out of arsenic bearing rocks [42]. Recently, the anthropogenic activities such as treatment of agricultural land with arsenical pesticides, treating of wood using chromated copper arsenate, burning of coal in thermal plants power stations and the operations of gold-mining have increased the environmental pervasiveness of As and its rate of discharge into freshwater habitat [43]. As can also interfere with the fish immune system by suppressing antibody production [44] as well as by lowering macrophage activity and maturation [45]. Several studies are reporting As induced liver fibrosis, hepatocellular damage, inflammation, focal necrosis in addition to hepatocellular carcinoma [46, 47]. In the present investigation it was observed that As concentration at S1, S2, S3 and S4 sampling stations lies in the range of 23-175, 71-429, 82-279 and 61-308 µg/g respectively. The biyearly average As concentration was found to be 112, 285, 159 and 163 µg/g respectively at different sampling stations (Table 1). It was also observed that the average As concentration for assessment year 2010-11 was higher than that obtained for the assessment year 2009-10 by a factor of 1.16 at S3 to 1.42 at S4 (Figures 2-5).
Table 1. Heavy Metal Content in Sediment Samples Collected at different Sampling Stations along Vasai Creek of Mumbai (values in µg/g dry weight)
     
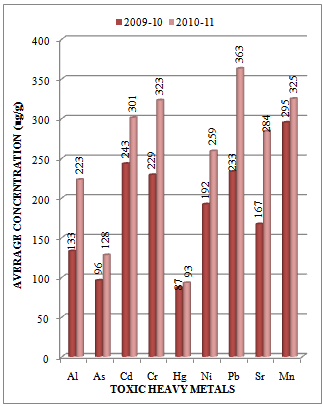
Figure 2. Variation in average concentration values of different toxic heavy metals in sediment samples collected at S-1 sampling station of Vasai Creek during the assessment year 2009-10 and 2010-1
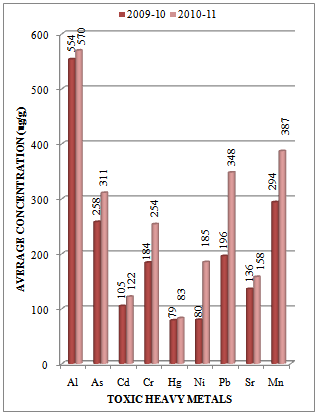
Figure 3. Variation in average concentration values of different toxic heavy metals in sediment samples collected at S-2 sampling station of Vasai Creek during the assessment year 2009-10 and 2010-11
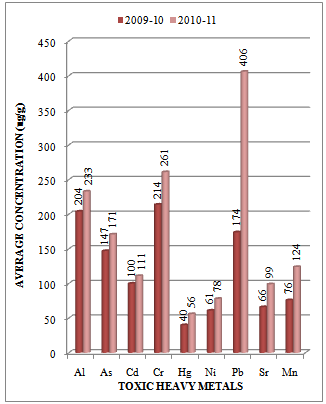
Figure 4. Variation in average concentration values of different toxic heavy metals in sediment samples collected at S-3 sampling station of Vasai Creek during the assessment year 2009-10 and 2010-11
Figure 5. Variation in average concentration values of different toxic heavy metals in sediment samples collected at S-4 sampling station of Vasai Creek during the assessment year 2009-10 and 2010-11
Cadmium (Cd), a non-essential element, is one of the most toxic[48] and mobile heavy metals widely distributed in natural waters as a result of human activities[49]. It is a very important source of environmental pollution due to its bioavailability (it is less strongly complexed than other divalent heavy metals and, consequently, more toxic) and to its multiple technological applications (batteries, pigments, polymer stabilisation, etc.). The acute toxicity of waterborne cadmium on aquatic organisms is highly variable even among phylogenetically closely related species and depends on metal speciation, being the free ion (Cd2+) form particularly toxic. Ferrari and Salibián[50] found that low concentrations of Cd2+ induced severe damage to the skin of Bufo arenarum tadpoles by the disruption of epithelial cell junctions, mainly in the absence of calcium ions in the solution. In the present investigation it was observed that Cd concentration at S1, S2, S3 and S4 sampling stations lies in the range of 125-438, 47-202, 55-160 and 45-170 µg/g respectively. The biyearly average Cd concentration was found to be 272, 114, 106 and 117 µg/g respectively at different sampling stations (Table 1). It was also observed that the average Cd concentration for assessment year 2010-11 was higher than that obtained for the assessment year 2009-10 by a factor of 1.06 at S4 to 1.24 at S1 (Figures 2-5).
In natural waters, fish are often exposed to chromium (Cr) waste and demonstrate cumulative deleterious effects as a function of time. Steinhagen et al.[51] examined the effect of Cr on carp (Cyprinus carpio)-derived immune cells. The results demonstrated that at concentrations between 2 and 200 μmol L−1 Cr, the metal induced cytotoxicity and decreased the activation of mitogen-induced lymphocytes, as well as phagocyte functions. Neutrophils showed changes in cell shape together with reduced nitric oxide and reactive oxygen production at concentrations much lower than for the cytotoxic effects. The altered lymphocyte and neutrophil functions reflect the decreased resistance to pathogens observed in fishes under chronic Cr challenge. In the present investigation it was observed that Cr concentration at S1, S2, S3 and S4 sampling stations lies in the range of 147-590, 106-395, 121-351 and 80-400 µg/g respectively. The biyearly average Cr concentration was found to be 276, 219, 238 and 229 µg/g respectively at different sampling stations (Table 1). It was also observed that the average Cr concentration for assessment year 2010-11 was higher than that obtained for the assessment year 2009-10 by a factor of 1.04 at S4 to 1.41 at S1 (Figures 2-5).
Mercury (Hg) poisoning has become a problem of current interest as a result of environmental pollution on a global scale. Mercury is a strong phytotoxic as well as genotoxic metal[52]. Toxic effects of mercury in plants include abscission of older leaves, growth reduction, decreased vigour inhibition of root and leaf development, decreased chlorophyll content and nitrate reductase activity[53]. Other adverse effects caused by excessive mercury include membrane structure integrity disruption[54], mineral nutrient uptake reduction[55] and photosynthesis and transpiration reduction[56]. Higher concentrations (> 1-2 mg/l) of mercury decreased the growth of pea, tomato[55] and alfalfa[57]. Mercury also inhibited water uptake through aquaporins in plasma membrane in wheat[58]. Inhibition of enzymes of different metabolic pathways has also been reported by mercury toxicity[59]. In the present investigation it was observed that Hg concentration at S1, S2, S3 and S4 sampling stations lies in the range of 14-132, 11-180, 17-90 and 4-30 µg/g respectively. The biyearly average Hg concentration was found to be 90, 81, 48 and 16 µg/g respectively at different sampling stations (Table 1). It was also observed that the average Hg concentration for assessment year 2010-11 was higher than that obtained for the assessment year 2009-10 by a factor of 1.05 at S2 to 1.40 at S3 (Figures 2-5).
Nickel(Ni) and nickel compounds have many industrial and commercial uses, and the progress of industrialization has led to increased emission of pollutants into ecosystems. Nickel is easily accumulated in the biota, particularly in the phytoplankton or other aquatic plants, which are sensitive bioindicators of water pollution. It can be deposited in the sediment by such processes as precipitation, complexation and adsorption on clay particles and via uptake by biota [60]. Levels of precipitation of Ni of 0.9 mg/m2/year over long periods were found to be dangerous for biological systems of fresh water catchments[61]. In rivers, nickel is transported mainly as a precipitated coating on particles and in association with organic matter. Recent studies have suggested an increase in cancer in nickel refinery areas where exposure to water-soluble nickel salts occurs[62]. Nickel has been shown to be immunotoxic, altering the activity of all specific types involved in the immunological response, resulting in contact dermatitis or asthma[63]. Human exposure to highly nickel-polluted environments has the potential to produce a variety of pathological effects. Among them are skin allergies, lung fibrosis, cancer of the respiratory tract and iatrogenic nickel poisoning[64,65]. While no reproductive effects have been associated with nickel exposure to humans, several studies on laboratory animals have demonstrated fetotoxicity[63,66]. In the present investigation it was observed that Ni concentration at S1, S2, S3 and S4 sampling stations lies in the range of 125-372, 52-238, 17-118 and 132-398 µg/g respectively. The biyearly average Ni concentration was found to be 226, 133, 70 and 235 µg/g respectively at different sampling stations (Table 1). It was also observed that the average Ni concentration for assessment year 2010-11 was higher than that obtained for the assessment year 2009-10 by a factor of 1.25 at S4 to 2.31 at S2 (Figures 2-5).
Lead (Pb) is not essential for plants, and excessive amounts can cause growth inhibition, as well as reduced photosynthesis, mitosis, and water absorption. The decline of some European spruce forests has been attributed to excessive concentrations of atmospheric Pb[67]. Lead is toxic to all phyla of aquatic biota, though effects are modified significantly by various biological and abiotic variables. Wastes from Pb mining activities have severely reduced or eliminated populations of fish and aquatic invertebrates, either directly through lethal toxicity or indirectly through toxicity to prey species. Health advisories warning anglers against eating Pb-contaminated fish have been posted in Missouri [68]. In the present investigation it was observed that Pb concentration at S1, S2, S3 and S4 sampling stations lies in the range of 76-560, 62-525, 118-650 and 156-698 µg/g respectively. The biyearly average Pb concentration was found to be 298, 272, 290 and 397 µg/g respectively at different sampling stations (Table 1). It was also observed that the average Pb concentration for assessment year 2010-11 was higher than that obtained for the assessment year 2009-10 by a factor of 1.17 at S4 to 2.33 at S3 (Figures 2-5).
Strontium (Sr) compounds that are water-insoluble can become water-soluble, as a result of chemical reactions. The water-soluble compounds are a greater threat to human health than the water-insoluble ones. Therefore, water- soluble forms of strontium have the opportunity to pollute aquatic environment. For children exceeded strontium uptake may be a health risk, because it can cause problems with bone growth. In the present investigation it was observed that Sr concentration at S1, S2, S3 and S4 sampling stations lies in the range of 109-519, 44-291, 23-150 and 45-399 µg/g respectively. The biyearly average Sr concentration was found to be 225, 147, 83 and 207 µg/g respectively at different sampling stations (Table 1). It was also observed that the average Sr concentration for assessment year 2010-11 was higher than that obtained for the assessment year 2009-10 by a factor of 1.16 at S2 to 2.26 at S4 (Figures 2-5).
Manganese (Mn) is one out of three toxic essential trace elements, which means that it is not only necessary for humans to survive, but it is also toxic when too high concentrations are present in a human body. Excess manganese interferes with the absorption of dietary iron. Long-term exposure to excess levels may result in iron-deficiency anaemia. Increased manganese intake impairs the activity of copper metallo-enzymes. The presence of manganese in drinking water supplies may be objectionable for a number of reasons unrelated to health. At concentrations exceeding 0.15 mg/L, manganese stains plumbing fixtures and laundry and causes undesirable tastes in beverages[69]. Oxidation of manganese ions in solution results in precipitation of manganese oxides and incrustation problems. Even at concentrations of approximately 0.02 mg/L, manganese may form coatings on water distribution pipes that may slough off as black precipitates[70]. The growth of certain nuisance organisms is also supported by manganese[69,71]. The presence of "manganese" bacteria, which concentrate manganese, may give rise to taste, odour and turbidity problems in the distributed water. Highly toxic concentrations of manganese in soils can cause swelling of cell walls, withering of leafs and brown spots on leaves. In the present investigation it was observed that Mn concentration at S1, S2, S3 and S4 sampling stations lies in the range of 115-530, 165-582, 37-330 and 68-670 µg/g respectively. The biyearly average Mn concentration was found to be 310, 341, 100 and 240 µg/g respectively at different sampling stations (Table 1). It was also observed that the average Mn concentration for assessment year 2010-11 was higher than that obtained for the assessment year 2009-10 by a factor of 1.10 at S1 to 2.53 at S4 (Figures 2-5).

4. Conclusions

Although in India the Central Pollution Control Board (CPCB) is responsible for restoration and maintaining the wholesomeness of aquatic resources under Water Prevention and Control of Pollution Act 1974 passed by Indian Parliament, it is expected that to maintained or restored the quality of aquatic resources at desired level it is important to have monitoring on regular basis. Although much work has been done on pollution of aquatic resources due to toxic heavy metals, there is still a great need for information on influences of metals and their toxicities fully. The real problem today is not whether heavy metals are toxic or not, since we know that they are: but what concentrations are permissible/safe levels in our waters which do not produce harmful effects on users of water and biological life from the waters. Although it is impossible to prevent pollution of aquatic environment totally, but metal pollution and toxicity could be minimized by certain precautionary measures like development of adequate environmental control and management programmes and by continuous scientific monitoring of our aquatic environment. The present study on monitoring of toxic heavy metals in sediments will help to provide a means for evaluating the long term accumulation of heavy metal contaminants. The present study on pollution due to toxic heavy metals in the sediment samples collected along the Vasai Creek of Mumbai will be useful for rational planning of pollution control strategies and their prioritisation; to assess the nature and extent of pollution control needed and to evaluate effectiveness of pollution control measures already is existence.

ACKNOWLEDGEMENTS

The authors are thankful to SAP Productions for developing and maintaining the paper template.

References

[1]  Cataldo, D., Colombo, J. C., Boltovskoy, D., Bilos, C., and Landoni,P., 2001, Environmental toxicity assessment in the Parana river delta (Argentina): simultaneous evaluation of selected pollutants and mortality rates of Corbicula Fluminea (Bivalvia) early juveniles, Environ. Poll., 112 (3), 379-389.
[2]  Hobbelen, P.H.F., Koolhaas, J.E., and Van Gestel, C.A.M., 2004, Risk assessment of heavy metal pollution for detritivores in flood plain soils in the Biesbosch, The Netherlands, taking bioavailability in to account, Environ. Poll., 129(3), 409 -419.
[3]  Koukal, B., Dominik, J., Vignati, D., Arpagaus, P., Santiago, S., Ouddane, B., and Benaabidate, L., 2004, Assessment of water quality and toxicity of polluted rivers Fez and Sebou in the region of Fez (Morocco), Environ. Poll., 131 (1), 163-172.
[4]  Okafor, E. C., and Opuene, K., 2007, Preliminary assessment of trace metals and polycyclic aromatic hydrocarbons in the sediments, Int. J. Environ. Sci. Tech., 4 (2) 233 – 240.
[5]  Mohiuddin, K.M., Zakir, H.M., Otomo, K., Sharmin, S., and Shikazono, N., 2010. Geochemical distribution of trace metal pollutants in water and sediments of downstream of an urban river, Int. J. Environ. Sci. Tech., 7 (1), 17-28.
[6]  Miller, C.V., Foster, G.D., and Majedi, B.F., 2003, Baseflow and stormflow metal fluxes from two small agricultural catchments in the coastal plain of Chesapeake Bay Basin, United States, Appl. Geochem., 18(4), 483-501.
[7]  Harikumar, P. S., Nasir, U.P., and Mujeebu Rahman, M. P., 2009, Distribution of heavy metals in the core sediments of a tropical wetland system, Int. J. Environ. Sci. Tech., 6 (2), 225 -232.
[8]  Dassenakis, M., Scoullos, M., Foufa, E., Krasakopoulou, E., Pavlidou, A., and Kloukiniotou, M., 1998, Effects of multiple source pollution on a small Mediterranean river, Appl. Geochem., 13(2), 197 -211.
[9]  Lokhande, R.S., and Kelkar, N., 1999, Studies on heavy metals in water of Vasai Creek, Maharashtra, Indian J. Environ. Protect. 19(3): 664–668.
[10]  Kazi, T.G., Arain, M.B., and Baig, J.A., 2009, The correlation of arsenic levels in drinking water with the biological samples of skin disorders, The Science of the Total Environment, 407(3):1019–1026.
[11]  Gbaruko, B.C., Ana, G.R., Nwachukwu, J.K., 2008, Ecotoxicology of arsenic in the hydrosphere: implications for public health, African Journal of Biotechnology, 7(25):4737–4742.
[12]  Cai, L., Liu, G., Rensing, C., and Wang, G., 2009, Genes involved in arsenic transformation and resistance associated with different levels of arseniccontaminated soils, BMC microbiology, 9:4
[13]  Pokhrel, D., Bhandari, B.S., and Viraraghavan, T., 2009, Arsenic contamination of groundwater in the Terai region of Nepal: an overview of health concerns and treatment options. Environment International, 35(1):157-161.
[14]  Akcay, H., Oguz, A., and Karapire, C., 2003, Study of heavy metal pollution and speciation in Buyak Menderes and Gediz river sediments, Water Res., 37(4), 813-822
[15]  Abdel-Ghani, N.T., and Elchaghaby,G.A., 2007, Influence of operating condit ions on the removal of Cu, Zn, Cd and Pb ions from waste water by adsorption, Int. J. Environ. Sci. Tech., c4 (4), 451-456.
[16]  Nicolau, R., Galera, C.A., and Lucas, Y., 2006, Transfer of Nutrients and labile metals from the continent to the sea by a small Mediterrane an river, Chemosphere, 63(3), 469 -476.
[17]  Nouri, J., Lorestani, B., Yousefi, N., Khorasani, N., Hasani, A. H., Seif, S., and Cheraghi, M., 2011, Phytoremediation potential of native plants grown in the vicinity of Ahangaran lead– zinc mine (Hamedan,Iran), Environ.Earth Sci., 62 (3), 639 -644.
[18]  Modak, D.M., Singh, K.P., Ahmed, S., and Ray, P.K., 1990, Trace metal ion in Ganga water system, Chemosphere, 21 (1-2):275–87.
[19]  Rajaram T., and Das A., 2008, Water pollution by industrial effluents in India: discharge scenarios and case for participatory ecosystem specific local regulation, Futures, 40(1):56–69.
[20]  Lokhande, R.S., Singare, P.U., and Pimple, D.S., 2011, Toxicity Study of Heavy Metals Pollutants in Waste Water Effluent Samples Collected From Taloja Industrial Estate of Mumbai, India, Resources and Environment, 1(1): 13-19.
[21]  Lokhande, R.S., Singare, P.U., and Pimple, D.S., 2011, Quantification Study of Toxic Heavy Metals Pollutants in Sediment Samples Collected from Kasardi River Flowing along the Taloja Industrial Area of Mumbai, India, The New York Science Journal 4(9), 66-71.
[22]  Singare, P.U., 2011, Distribution Behaviour of Trace and Toxic Metals in Soil and Sediment along the Thane Creek near Mumbai, India. Interdisciplinary Environmental Review, 12(4), 298–312.
[23]  Singare, P.U., Lokhande, R.S., and Bhanage, S.V., 2011, Study of water pollution due to Heavy metals in Kukshet lakes of Nerul, Navi Mumbai, India, International Journal of Global Environmental Issues, 11(1), 79–90.
[24]  Singare, P.U., Lokhande, R.S., and Jagtap, A.G., 2011, Water pollution by discharge effluents from Gove Industrial Area of Maharashtra, India: Dispersion of heavy metals and their Toxic effects, International Journal of Global Environmental Issues, 11(1), 28–36.
[25]  Singare, P.U., Lokhande, R.S., and Pathak, P.P., 2010, Study on Physico-Chemical properties and Heavy Metal Content of the Soil Samples from Thane Creek of Maharashtra, India, Interdisciplinary Environmental Review, 11(1), 38-56.
[26]  Singare, P.U., Lokhande, R.S., and Naik, K.U., 2010, A Case Study of Some Lakes Located at and Around Thane City of Maharashtra, India, with Special Reference to Physico-Chemical Properties and Heavy Metal content of Lake Water, Interdisciplinary Environmental Review, 11(1), 90-107.
[27]  Singare, P.U., Lokhande, R.S., and Bhattacharjee, S.S., 2013, Analysis of the Heavy metal Pollutants in Sediment Samples collected from Thane Creek of Maharashtra, India, International Journal of Sustainable Society, 5(3), 296-308.
[28]  Jung, H., Yun, S., Mayer, B., Kim, S., Park S., and Lee, P., 2005, Transport and Sediment-Water Partitioning Of Trace Metals in Acid Mine Drainage: An Example from the Abandoned Kwangyang Au-Ag Mine Area, South Korea, Environmental Geology. 48(4-5), 437-449.
[29]  Chen, M, and Ma, L.Q., 2001, Comparison of three aqua regia digestion methods for twenty florida soils, Soil Science Society of American Journal, 65(2),491–499.
[30]  Clesceri, L.S., 1998, Standard methods for the examination of water and waste water, in Arnold, E., Greenbergy, Eaton, A.D. (Eds.): Collection and Preservation of Samples and Metals, pp.1–27, pp.1–35, pp.3–1, pp.3–21, APHA, AWWA, WEF, Washington DC.
[31]  Paar, A., 1998, Microwave Sample Preparation System’ – Instruction Handbook, p.128, Anton Paar GmbH, Austria.
[32]  Sachdev, S.L. and West, P.W., 1970, Concentration of trace metals by solvent extraction and their determination by atomic absorption spectrophotometer, Environmental Science and Technology, 4(9), 749–751.
[33]  Chen, M., and Ma, L.Q., 2001, Comparison of three aqua regia digestion methods for twenty florida soils, Soil Science Society of American Journal, 65(2), 491–499.
[34]  Weston, D.P., and Maraya, K.A., 2002, Predicting bioavailability and bioaccumulation with in vitro digestive fluid extraction’, Environ Toxicol Chem., 21(5), 962–971.
[35]  Maher, W., Batley, G.E., and Lawrence, I., 1999, Assessing the health of sediment ecosystems: use of chemical measurements’, Freshwater Biol., 41(2), 361–372.
[36]  Kennicutt, M.C., Wade, T.L., Presley, B.J., Requejo, A.G., Brooks, J.M., and Denoux, G.J., 1994, Sediment contaminants in Casco Bay, Maine: inventories, sources and potential for biological impacts, Environ. Sci. Technol., 28(1), 1–15.
[37]  Foy, C.D.,1996, Tolerance of Barley cultivars to an acid, aluminum-toxic subsoil related to mineral element concentrations of their shoots, J. Plant Nutr., 19(10-11), 1361–1380.
[38]  Kochian, L.V., 1995, Cellular mechanisms of aluminum toxicity and resistance in plants, Annu. Rev. Plant Physiol. and Plant Mol. Biol., 46(1), 237–260.
[39]  Rincon, M., and Gonzales, R.A., 1992, Aluminum partitioning in intact roots of aluminum-tolerant and aluminum-sensitive wheat (Triticum aestivum L.) Cultivars, Plant Physiol., 99(3), 1021–1028.
[40]  Kinraide, T.B., 1988, Proton extrusion by wheat roots exhibiting severe aluminum toxicity symptoms, Plant Physiol., 88(2), 418–423.
[41]  Rout, G.R., Samantaray, S., and Das, P., 2001, Aluminum toxicity in plants: a review’, Agronomie, 21(1), 3–21.
[42]  Edmonds, J.S., and Francesconi, K.A., 1993, Arsenic in sea foods: human health aspect and regulations. Marine Pollut., 26(12), 665-674.
[43]  Pacyna, J.M., Scholtz, M.T., and Li, Y.F., 1995, Global budgets of trace metal sources. Environ. Rev., 3(2), 145-159.
[44]  Gosh, D., Datta, S., Bhattacharya, S. and Mazumder, S., 2007, Long-term exposure to arsenic affects head kidney and impairs humral immune responses of Clarias batrachus, Aquat. Toxicol., 81(1), 79-89.
[45]  Gosh, D., Datta, S., Bhattacharya, S., and Mazumder, S., 2006, Perturbation in the catfish immune responses by arsenic: organ and cell specific effects. Comp. Biochem. Physiol., 143C: 455-463.
[46]  Liu, S.X., Athar, M., Lippai, I., Waldren, C., and Hei, T.K., 2001, Introduction of oxyradicals by arsenic, implication for mechanism of genotoxicity. Proc. Nat. Acad. Sci. USA, 98(4), 1643-1648.
[47]  Datta, S., Saha, D.R., Gosh, D., Majumdar, T., Bhattacharya, S., and Mazumder, S., 2007, Sub-lethal concentration of arsenic interferes with the proliferation of hepatocytes and induces in vivo apoptosis in Clarias batrachus L., Comp. Biochem. Physiol. Part C, 145(3), 339-349.
[48]  Waalkes, M.P., 2000, Cadmium carcinogenesis in review, Journal of Inorganic Biochemistry, 79(1-4), 241–244.
[49]  US-EPA, 2007, Framework for Metals Risk Assessment, Office of the Science Advisor, Risk Assessment Forum, Washington, DC: EPA 120/R-07/001.
[50]  Ferrari, L., and Salibián, A., 1999, Effect of cadmium on the epidermic structure of Bufo arenarum tadpoles: influence of the chemical composition of the incubation media, Archives of Physiology and Biochemistry, 107(2), 91–96.
[51]  Steinhagen, D., Helmus, T., Maurer, S., Michael, R.D., Leibold, W., Scharsack, J.P, Skouras, A., Schuberth, H.J., 2004, Effect of hexavalent carcinogenic chromium on carp Cyprinus carpio immune cells, Diseases Aquatic Organisms, 62(1-2):155–161.
[52]  Fridovich, I., 1986, Biological effects of the superoxide radical, Archives of Biochemistry and Biophysics, 247(1), 1-11.
[53]  Vyas, J., and Puranik, R.M., 1993, Inhibition of nitrate reductase activity by mercury in bean leaf segments, Indian Journal of Plant Physiology, 36(1), 57-60.
[54]  Ma, C., 1998, Mercury harm on cell membrane of rape leaf and cell endogenous protection effect, YingYong Shengtai Xuebao, 9(1) 23-26.
[55]  Cho, U., Park, J.O., 2000, Mercury induced oxidative stress in tomato seedlings, Plant Science, 156(1), 1-9.
[56]  Krupa, Z., and Baszynski, T., 1995, Some aspects of heavy metal toxicity towards photosynthetic apparatus: direct and indirect effects on light and dark reaction, Acta Physiologiae Plantarum, 17(2), 177-190.
[57]  Zhou, Z.S., Huang, S.Q., Guo, K., Mehta, S.K., Zhang, P.C., and Yang, Z.M., 2007, Metabolic adaptations to mercury- induced oxidative stress in roots of Medicago sativa L, Journal of Inorganic Biochemistry, 101(1), 1-9.
[58]  Zhang, W.H., and Tyerman, S.D., 1999, Inhibition of water channels by HgCl2 in intact wheat root cells, Plant Physiology, 120(3), 849-857.
[59]  Morch, V.M., Schetinges, M.R.C., Martins, A.F., and Rocha, J.B.T., 2002, Effects of cadmium, lead, mercury and zinc on delta amino levulinic acid dehydratase activity from radish leaves, Biologia Plantarum, 45(1): 85-89.
[60]  Nriagu, J.O., and Pacyna, J.M., 1988, Quantitative assessment of worldwide contamination of air, water and soils by trace metals. Nature 333(6169), 134-139.
[61]  Kashulinxc, N.A., Ratkin, N.E., Dauvalter, V.A., and Lukin, A.A., 2001, Impact of airborne pollution on the drainage area of subarctic lakes and fish, Chemosphere, 42 (1), 51-59.
[62]  Haber, L.T., Erdreicht, L., Diamond, G.L., Maier, A.M., Ratney, R., Zhao, Q., and Dourson, M.l., 2000, Hazard identification and dose response of inhaled nickel-soluble salts, Regul. Toxicol. Pharmacol. 31(2), 210-230.
[63]  Coogan, T.P., Latta, D.M., Snow, E.T., Costa, M., and Lawrence, A., 1989, Toxicity and Carcinogenicity of Nickel compounds, Crit. Rev. Toxicol., 19 (4), 341-384.
[64]  Clarkson, T.W., 1988, Biological Monitoring of Toxic Metals; Plenum press: New york, pp. 265-282, 1988.
[65]  Kasprzak, K.S., Sunderman, F.W.(Jr.), and Salnikow, K., 2003, Nickel Carcinogenesis, Mutat. Res., 533 (1-2), 67-97.
[66]  Donskoy, E., Donskoy, M., Forouhar, F., Gillies, C.G., Marzouk, A., Reid, M.C., Zaharia, O., and Sunderman, F.W.(Jr.), 1986, Hepatic toxicity of nickel chloride in rats, Ann. Clin. Lab. Sci., 16(2), 108-117.
[67]  Backhaus, B., and Backhaus, R., 1986, Is atmospheric lead contributing to mid-European forest decline? Sci. Total Environ., 50(1), 223-225.
[68]  Schmitt, C. J., and Finger, S. E., 1987, The effects of sample preparation on measured concentrations of eight elements in edible tissues of fish from streams contaminated by lead mining, Arch. Environ. Contam. Toxicol., 16(2),185-207.
[69]  Griffin, A.E., 1960, Significance and removal of manganese in water supplies. J. Am. Water Works Assoc., 52(10), 1326-1334.
[70]  Bean, E.L., 1974, Potable water-quality goals, J. Am. Water Works Assoc., 66(4), 221-230.
[71]  Wolfe, R.S., 1960, Microbial concentration of Iron and Manganese in Water with Low Concentrations of These Elements, J. Am. Water Works Assoc., 52(10), 1335-1337.