-
Paper Information
- Next Paper
- Previous Paper
- Paper Submission
-
Journal Information
- About This Journal
- Editorial Board
- Current Issue
- Archive
- Author Guidelines
- Contact Us
American Journal of Chemistry
p-ISSN: 2165-8749 e-ISSN: 2165-8781
2012; 2(2): 34-37
doi: 10.5923/j.chemistry.20120202.08
Assessment of Toxic Levels of Some Heavy Metals in Road Deposited Sediments in Suleja, Nigeria
 Abstract
 Reference
 Full-Text PDF
 Full-Text HTML
Jonathan Yisa , John O. Jacob , Christian C. Onoyima
Department of Chemistry, Federal University of Technology, PMB 65, Minna, Nigeria
Correspondence to: Jonathan Yisa , Department of Chemistry, Federal University of Technology, PMB 65, Minna, Nigeria.
| Email: |  |
Copyright © 2012 Scientific & Academic Publishing. All Rights Reserved.
Road deposited sediments contain toxic metals which can pollute terrestrial as well as aquatic environments when these pollutants are mobilized during storm run-off. Assessment of toxic metals in the road deposited sediments of Suleja streets was carried out. 30 samples were collected from seven selected streets. The road sediment samples were digested with a mixture of HNO3 and HClO4 (2:1 v/v), and analyzed for the metals Pb, Cu, Cr, Zn, Cd and Ni using Atomic Absorption Spectrophotometer. Results showed that metal concentrations were in the order Zn>Pb>Cu>Ni>Cd>Cr. Geo-accumulation Index indicated that the contamination degree ranged from unpolluted to moderately polluted areas. Potential Ecological Risk Index demonstrated that overall risk caused by metals ranges from moderate to low. Only Cd constitutes considerable risk and contributed 60.15% of the total risk.
Keywords: Toxic Metals, Geo-Accumulation Index, Ecological Risk Index, Sediments
Article Outline
1. Introduction
- Though a vital link for communication and transport, roads are also becoming a source of pollution. Harmful substances emitted by exhausts and wear from vehicles are deposited and accumulated daily on road pavements and surrounding soil, together with primary and secondary particles from other anthropogenic (demolition/construction, industrial activities, e.t.c) and natural sources (short and long range transport of suspended soils). These depositions on roads are commonly referred to as street/road deposited sediments (RDS/SDS)[1]. The natural fraction of RDS consists of soil materials, plant and leaf litter, and atmospheric deposition[2]. The anthropogenic fraction contains high concentrations of heavy metals originating from brake linings, the combustion of fuels and the wear and tear of pavements and tires and vehicle body[3,4], and also industrial activities, municipal solid waste incineration, metals smelting, e.t. c.Interest in heavy metal pollutions in RDS has been rapidly increasing probably as a consequence of high levels of contamination measured in a number of cities, and the potential health risks associated with them. Roadways and automobiles now are considered to be one of the largest sources of heavy metals. Zinc, copper, and lead are three of the most common heavy metals released from road travel, accounting for at least 90 percent of the total metals in road runoff. Street sediments that accumulate along pavements in urban environments have the potential to provide considerable loading of heavy metals to receiving waters and water bodies[5].One of the most important properties of these metals which differentiate them from other toxic pollutants is that they are not biodegradable in the environment[6]. Another problem associated with them is the potential for bioaccumulation and biomagnifications causing heavier exposure for organisms than is present in the environment alone. Toxic metals accumulate in organisms as a result of direct uptake from surrounding across the body walls, from respiration and from food[7].Rainwater can also carry RDS horizontally as well as vertically along with the various chemical constituents like heavy metals, thus polluting surface and groundwater. The studies by Poleto, et al[8] indicated that on average, 46% of the fluvial suspended sediments originated from paved areas, 23% come from unpaved roads, and 31% come from the stream channel itself. In a similar research to present the relation between pollutants in the street sediments and suspended sediment sample in river, Poleto and Merten[9] showed that concentrations of metals in rivers vary temporarily during storms due to input of street run-off containing elevated concentration of metals.The impacts of highway run-off on receiving water are described in terms of the water quality or biological changes induced by the toxicity level or both. Heavy metals and other pollutants affect water quality and are potentially toxic to stream biota. In three surveys of heavy metals in whole fish in 109 streams across the United States, high levels of zinc and copper were found in Manoa streams[10]. Maltby, et al[11] and Pitt, et al[12], have established a link between road run-off and the deleterious influence of inorganic metal toxicants on benthic community structure and function in receiving water bodies. Humans may ingest these pollutants directly, by drinking contaminated water, or indirectly through contaminated fish.Suleja is a city in Niger state, Nigeria. It is located at longitude 7o11E and latitude 9o11N, just north of Abuja, the Federal Capital Territory of Nigeria. In recent years, it has witnessed a population explosion and high traffic density owing to its proximity to Abuja. The aim of this study is to evaluate the degrees of contamination of these metals in Suleja, by geo-accumulation index method and to assess the potential ecological risk posed by metals, with the aid of potential ecological risk index method.
2. Materials and Methods
2.1. Sample Collection
- The sampling points were selected along the major and minor roads within Suleja town, namely Usman Farouque Minna road (M), Suleiman Barau road (S), Alhasan Bako drive (A), Jibrin Bala Road (J), Abdulahi Zuba road (Z), IBB market road (I), and Hassan Dalhatu Road (H). The sediment sampling was carried out from pavement edges using a plastic dustpan and brushes. About 4 sub-samples were taken, pooled and homogenized to obtain a sample (about 200g) for each site. In order to get the accordant samples, all the RDS samples were collected under similar weather conditions, on a sunny day. The collected samples were kept in polyethylene Ziploc bag.
2.2. Sample Pretreatment and Analysis
- The collected RDS were air dried and mixed thoroughly with the aid of agate mortars and pestles. The sediment samples were then sieved through a 2mm and 0.5mm plastic sieve to obtain fine particles. 1g each of the dried sieved samples was picked by the aid of a high precision analytical balance. Subsequently, the samples were put in polytetra- flouroethylene vessels and digested at 100℃ for 2hrs using 20ml of a mixture of conc. HCl and conc. HClO4 in the ratio of 2:1. The digested samples were cooled and filtered. The filtrates were made up to 100cm3 with distilled water. The total metal levels in the digested samples were determined using Atomic Absorption Spectrophotometer. The blanks and duplicates were similarly determined[12].
|
|
| |||||||||||||||||||||||||||||||||||||||||||||||||||||||||||||||||||||||||||||||||
2.3. Data Analysis
- The results obtained were subjected to analysis to determine the Geo-accumulation Index and Potential Ecological Risk Index of the metals in the environment.
2.3.1. Geo-Accumulation Index (Igeo)
- The Geo-accumulation Index (Igeo), was introduced by Muller[13] for determining the extent of metal accumulation in sediments, and has been used by various workers for their studies. Igeo is mathematically expressed as:
 | (1) |
2.3.2. Potential Ecological Risk Index
- The Potential Ecological Risk Index (RI) was originally introduced by Hakanson[14] to assess the degree of heavy metal pollution in soil, according to the toxicity of metals and the response of the environment. RI could evaluate ecological risk caused by toxic metals comprehensively. The calculating methods of RI are listed below:
 | (2) |
 | (3) |
 | (4) |
3. Results and Discussion
- The ranges of mean concentration (mg/Kg) of the heavy metals in RDS are Pb (20.41 – 50.59), Cu (4.75 – 43.77), Cr (12.34 – 21.82), Zn (60.83 – 168.33), Ni (18.33 – 28.00) and Cd (13.33 – 29.38), respectively (Table 1).
3.1. Contamination Degree Based On Igeo
- The degree of pollution in sediments can be assessed by the determination of indices such as Geo-accumulation Index (Igeo). The calculated Igeo values for different RDS samples are summarized in Fig. 1. From the figures, the Igeo values for Pb shows that 56.67% of the samples fall in the uncontaminated class (≤0), 36.67% in the uncontaminated–moderately contaminated class (0-1), while the remaining 6.67% are moderately contaminated (1-2). Igeo values ≤0 (uncontaminated) for Cu, Cr, Zn, Ni, and Cd accounted for 63.33%, 93.33%, 20%, 26.67%, and 53.33% of the total values respectively. The Igeo values for uncontaminated– moderately contaminated are 13.33%, 6.67%, 63.33%, 56.67%, and 40% for Cu, Cr, Zn, Ni, and Cd respectively.The average Igeo for the observed metals were in the decreasing order of Ni (0.55) > Zn (0.45) > Cu (0.29) > Cd (0.15) > Pb (-0.17) > Cr (-0.46). This implies that Ni, Zn, Cu, and Cd unpolluted – moderately polluted the RDSs while Pb and Cr did not pollute the RDSs. No Igeo value was greater than 4 (i.e. heavily – extremely contaminated), and only two values Cu (3.55) at M5, and Cu (3.12) at J21 are in the heavily contaminated class.
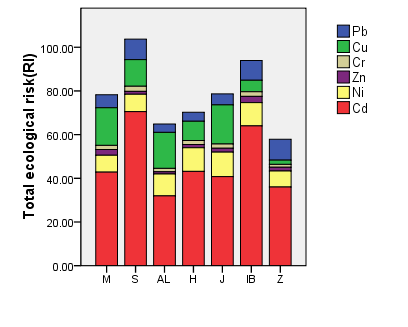 | Figure 1. Contributions of different metals to ecological risk in different streets of Suleja. M, S, AL, H, J, IB and Z refers to Usman Faruque Minna road, Suleiman Barau road, Alhasan Bako Drive, Hassan Dalhatu Road, Jibrin Bala road, Abdulahi Zuba road and IBB market road respectively |
3.2. Potential Ecological Risk Assessment
- The ecological risk assessment results of toxic metals in RDSs were summarized in Table 4. It was found that the average monomial risk factors (Eri) of metals in the RDSs were ranked in the following order Zn
4. Conclusions
- Contamination assessment based on Geo-accumulation Index (Igeo) showed that metals were in the uncontaminated to moderately contaminated degrees, and were in the decreasing order of: Ni > Zn > Cu > Cd > Pb > Cr while the streets are contaminated in the following order: I > S > J > M > H > Z > A. The ecological risk assessment results showed that Cd was the only metal posing a potentially high risk to environment. The overall risk indexes caused by the six toxic metals in Suleja streets indicate that two streets; Suleiman Barau road(S) and IBB Market road(I) are in the moderate risk class while other streets are in low risk.
References
| [1] | Robertson, D. J. and Taylor, K. G., 2007, “Temporal variability of metal contamination in urban road de posited sediment in Manchester, UK: implications for urban pollution monitoring”, Water, Air, Soil Pollu- tion, 186:209–20. |
| [2] | Rogge, W. F., Hildermann, L. M., Mazurek, M. A., Cas, C. R., and Simoneit, B. R., 1993, “Particulate abrasion products from leaf surface of urban plants”, Environmental Science Technology, 27, 2700 – 2711 |
| [3] | Davis, A. P., Shakouhian, M. and Ni, S., 2001, “Loading estimates of lead, cadmium, and zinc in ur- ban runoff from specific sources” Chemisphere, 44, 997 – 1009 |
| [4] | San-Miguel, G., Fowler, G. D., and Sollars, C. J., 2002, “The leaching of inorganic species from acti- vated carbons produced from waste tyre rubber”, Water Resources, 36, 1939 – 1946 |
| [5] | Yisa, J., 2010, “Heavy metal contamination of road-deposited sediments”, American Journal of Applied Sciences, 7 (9), 1231 – 1236 |
| [6] | Serife, T., Senol, K., and Gokhan, B., 2003, “Comparison of three sequential extraction procedure for portioning of heavy metals in car park dust”, Journal of Environmental Monitoring, 5, 468 – 476 |
| [7] | P. O’Neil, “Heavy Metals in Soils, John Wiley, New York, 1990, p. 83 – 89 |
| [8] | Poleto, C., Merten, G. H., and Minella, J. P., 2009, “The identification of sediment sources in a small urban watershed in southern Brazil: An application of sediment fingerprinting”, Environmental Technology, 30 (11), 1145 – 1153 |
| [9] | Poleto, C, and Merten, G.. H., 2008,”Urban street pollutants”, Revista Pesquisas em Geociências, 35, 3-8 |
| [10] | Schmitt, C. J., and Brumbaugh, W. G., 1990, “National contaminant biomonitoring program: concentrations of As, Cd, Cu, Pb, Hg, Se, and Zn in U.S fresh water fish,1976 – 1984”, Archives of Environ- mental Contamination and Toxicology, 19, 732–747 |
| [11] | Maltyby, L., Boxall, A. B., Forrow, D. M., Calow, P., Betton, C. I., 1995, “The effects of motorway runoff on fresh water ecosystem: identifying major toxicants”, Environmental Toxicology and Chemi- stry, 14 (6), 1093 –1101 |
| [12] | Pitt, R., Field, R., Lalor, M., and Brown, M., 1995, “Urban storm water toxic pollutants: assessment, sources, and treatability”, Water Environment Re- search, 63 (3), 260 – 275 |
| [13] | Muller, G., 1969, “Index of geo-accumulation in sediments of Rhine River”, Geochemical Journal, 2, 108 – 118 |
| [14] | Hakanson, L. L., 1980, “An ecological risk index aquatic pollution control, a sedimentological approach”, Water Research, 14 (8), 975 – 1001 |