R. S. Lokhande 1, P. U. Singare 2, P. V. Jadhav 1
1Department of Chemistry, University of Mumbai, Vidyanagari, Santacruz, 400098, Mumbai
2Department of Chemistry, Bhavan’s College, Andheri, 400058, Mumbai
Correspondence to: P. U. Singare , Department of Chemistry, Bhavan’s College, Andheri, 400058, Mumbai.
| Email: |  |
Copyright © 2012 Scientific & Academic Publishing. All Rights Reserved.
Abstract
Organic volatile impurities by Headspace GC method was developed and validated for Diphenoxylate hydrochloride bulk drug for its seven residual solvents. Analysis was performed on Perkin Elmer HS 40 system with auto injector. Carrier gas Helium was used with constant flow rate of 2.5mL/min as carrier gas and the separation of residual solvents were achieved on DB-5 column. The thermostat temperature was 125 °C for 20 minute for each vial and after the equilibration the vials were pressurized and injected on GC column. FID detector was used for detection. The parameter for which the method was validated included specificity, limit of detection and quantification, linearity, precision, accuracy and robustness. The method was successfully used to quantify the levels of specified limit for residual solvents in Diphenoxylate hydrochloride bulk drug.
Keywords:
Diphenoxylate Hydrochloride, Headspace GC; Residual Solvent; Quantification; Impurity Profiling
1. Introduction
Diphenoxylate hydrochloride is a drug, official1 in Pharm Eur. The residual solvent have no therapeutic benefits but may be hazardous to human health and to the environment. One must ensure that they are either not present in the product or are present only below acceptable levels2-3. Literature4-7 reveals development of several Headspace GC methods for determination of organic volatile impurities in pharmaceuticals drug. The quality control8 in residual solvent analysis was also discussed which gave idea; there should be separate method for estimation residual solvent with specified limit for drug. Some of the methods9-13 for estimation of residual solvent was discussed for drugs. In this contest the present work reports a development and validation of Headspace GC Method for separation and estimation of organic volatile impurities in Diphenoxylate hydrochloride bulk drug. Residual solvents used in the synthesis of Diphenoxylate hydrochloride are Methanol, Ethanol, Acetone, Dichloromethane, Toluene and Dimethyl formamide.The benzene is not used in the actual manufacture process the content of Benzene is controlled as there is use of solvent like Acetone, Isopropanol and Toluene. Contamination of benzene is possible if it is not controlled at the released of solvent like Acetone, Isopropanol and Toluene as the benzene is present in solvent as the impurity.| Table 1. Residual solvents in Diphenoxylate hydrochloride |
| | Sr.No. | Residual solvent | Limit | Limit as per ICH | Class | | 1. | Methanol | Max 100 ppm | 3000 ppm | 3 | | 2. | Ethanol | Max 100 ppm | 5000 ppm | 3 | | 3. | Acetone | Max 200 ppm | 5000 ppm | 3 | | 4. | Dichloromethane | Max 200 ppm | 600 ppm | 2 | | 5. | Benzene | Max 2 ppm | 2 ppm | 1 | | 6. | Toluene | Max 100 ppm | 890 ppm | 2 | | 7. | Dimethylformamide | Max 400 ppm | 880 ppm | 2 |
|
|
2. Experimental
2.1. Reagents
Diphenoxylate hydrochloride bulk drug sample was obtained from RPG Life Sciences LTD with certificate of analysis. Methanol, Ethanol, Acetone, Dichloromethane, Benzene, Toluene, Dimethylformamide, Diethalene gycol and Benzyl alcohol used were Analytical grade reagents.
2.2. Preparation of Standard Solution
Mixture of requisite concentration for solvents was obtained by mixing appropriate aliquots of stock for the above seven solvents in dissolving solvent (DS). The DS was prepared by mixing Benzyl alcohol: Diethylene glycol in the ratio 1:3.The working concentration of solvents in the solution is as follows:1) 100µg/mL each of methanol, ethanol and toluene. 2) 200µg/mL of dichloromethane and acetone.3) 400µg/mL of dimethyl formamide.4) 2µg/mL of benzene.1 mL of this solution was transferred into each of six HS vials. 1mL of DS was added to each vial. The vials were closed with PTFE silicon septa closure and secured the closure with an aluminium cap.
2.3. Test Preparation
About 0.5g of the test sample was taken into each of the two HS vials. Add 2mL of DS to make a fine suspension. The vials were closed with PTFE silicon septa closure and secured the closure with an aluminium cap.
2.4. Blank Preparation
2mL of DS was transferred into two HS vials. The vials were closed with PTFE silicon septa closure and secured the closure with an aluminium cap.
2.5. Headspace GC Instrumentation
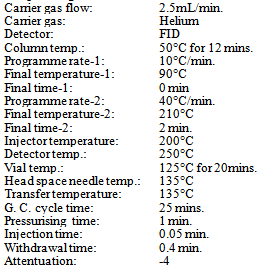
Perkin Elmer HS 40 with auto sampler, FID detector and Terbo-Chrom software. The residual solvent peaks were resolved on Megabore column with 2.65 micron film thickness, 0.53mm id and 30 mt length with stationary phase 5% phenyl polysiloxane (DB-5 J&W make suitable). The chromatographic conditions are listed below for the headspace analysis.Operating conditions | Table 2. Typical retention time of residual solvents in Diphenoxylate hydrochloride |
| | Methanol | 2.0 mins | | Ethanol | 2.4 mins | | Acetone | 2.7 mins. | | Dichloromethane | 3.3 mins. | | Benzene | 7.0 mins. | | Toluene | 14.1 mins. | | Dimethyl formamide | 14.5 mins. |
|
|
 | Figure 1. Typical chromatogram for mix standard of solvents in DS |
2.6. Validation
2.6.1. Specificity
The individual and Mix solution in DS were prepared at the working concentration level for each Methanol, Ethanol, and Acetone, Dichloromethane, Benzene, Toluene and Dimethyl formamide. The blank preparation and individual solution were transferred in HSS vials. Each vial was chromtographed using the headspace conditions. Any peak response in the blank preparation was recorded. The retention time for Methanol, Ethanol, Acetone, Dichloroethane, Benzene, Toluene, Dimethyl formamide and DS peaks were recorded.
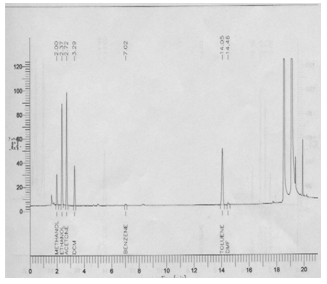
2.6.2. Detection Limit (DL) and Quantification Limit (QL)
A series of solutions were prepared by quantitative dilutions of the stock solution of methanol, ethanol, acetone, dichloromethane, benzene, toluene and dimethyl formamide to obtain solutions in the range 2.0% to 20.0% of the working concentration. Each solution was injected into the chromatograph in duplicate and the mean peak area was calculated. A graph of mean peak area against concentration in ppm was plotted and the equation of regression line and the residual standard deviation was determined. The calculations were done as follows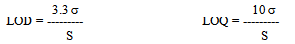 Where,
 = Residual Standard DeviationS = Slope
2.6.3. Linearity
Linearity solutions were prepared by quantitative dilutions of the stock solution of Methanol, Ethanol, Acetone, Dichloromethane, Benzene, Toluene and Dimethyl formamide to obtain solutions in the range from the Quantification Limit to 160% of the working concentration. Each solution was injected into the chromatograph in duplicate and the mean peak area was calculated.A graph of mean peak area against concentration in ppm was plotted and the equation of regression line was determined. The slope, intercept and correlation coefficient of the regression line was reported.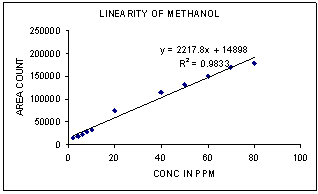 | Figure 2. Linearity of Methanol |
 | Figure 3. Linearity of Ethanol |
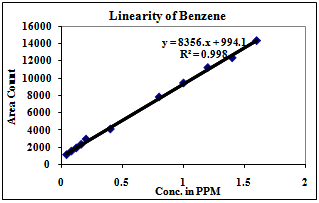 | Figure 4. Linearity of Benzene |
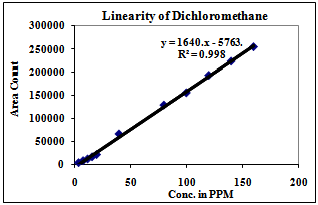 | Figure 5. Linearity of Dichloromethane |
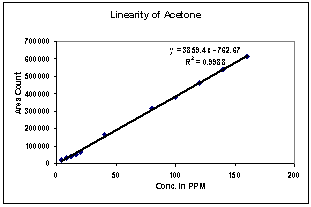 | Figure 6. Linearity of Acetone |
 | Figure 7. Linearity of Toluene |
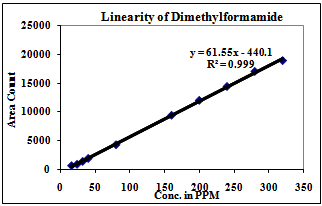 | Figure 8. Linearity of Dimethylformamide |
2.6.4. Precision
a) System PrecisionA standard solution of Methanol, Ethanol, Acetone, Dichloromethane, Benzene, Toluene and Dimethyl formamide of working concentration was prepared as described in the Methodology section and injected in six replicates into the chromatograph. The peak areas were recorded for each solvent and the mean, standard deviation and relative standard deviation was calculated. b) Repeatability Diphenoxylate hydrochloride sample was weighed in six different HSS vials. Each of these samples was spiked with Methanol, Ethanol, Acetone, Dichloromethane, Benzene, Toluene and Dimethyl formamide so as to obtain six solutions at the concentration level of the 50% limit of Methanol, Ethanol, Acetone, Dichloromethane, Benzene, Toluene and Dimethyl formamide. Similar solutions were prepared at 100% and 160% level of working concentration. Each level was analyzed against a freshly prepared standard of methanol, ethanol, acetone, dichloromethane, benzene, toluene and dimethyl formamide. The mean, standard deviation and relative standard deviation of the results was calculated. c) Intermediate PrecisionThe analysis detailed in Repeatability was repeated on a different day. The mean, standard deviation and relative standard deviation of the results was calculated.
2.6.5. Accuracy
Sample preparations were done same, as described under repeatability experiment.
2.6.6. Range
Range was defined once linearity, precision, and accuracy had been established.
2.6.7. Robustness
The head space analysis was carried out using the method outlined in the Methodology section and by spiking the sample with methanol, ethanol, acetone, dichloromethane, benzene, toluene and dimethyl formamide at the working concentration level. The following alterations in the chromatographic conditions were carried out. Change in flow rate of carrier gas (2.5mL/min± 0.3mL/min) The difference between the results obtained in accordance with the normal method and analysis by altered method was calculated and the system suitability test criteria were evaluated for each condition. The difference in the results of methanol, ethanol, acetone, dichloromethane, benzene, toluene and dimethyl formamide obtained by the normal method and those obtained by carrying out deliberate changes in the method were within ±10%. The system suitability criteria were not affected by the deliberate changes made in the method.
2.6.8. Solution Stability
Standard and sample solution was prepared as described in the methodology. These solutions were analyzed against freshly prepared standard after keeping the sample solution at room temperature for 24 hours. The initial results were then compared with the results at 24 hours. The difference in the two observed values for standard preparation was within ± 5%.
3. Results and Discussion
3.1. Specificity
There was no interference of dissolving solvent at the retention time of Methanol, Ethanol, Acetone, Dichloromethane, Benzene, Toluene and Dimethyl formamide. Methanol, Ethanol, Acetone, Dichloromethane, Benzene, Toluene, Dimethylformamide and DS peaks were well resolved from each other. Hence the method was found specific.
3.2. Linearity
Correlation Coefficient was more than 0.99 for each solvent and therefore the method is linear in the range of LOQ to 160% of the working concentration.1) The Method is found linear in the range of 2ppm to 160ppm for Methanol.2) The Method is found linear in the range of 8ppm to 640ppm for Ethanol.3) The Method is found linear in the range of 4ppm to 320ppm for Acetone.4) The Method is found linear in the range of 4ppm to 320ppm for Methanol.5) The Method is found linear in the range of 0.08ppm to 3.2ppm for Benzene.6) The Method is found linear in the range of 2ppm to 160ppm for Toluene.7) The Method is found linear in the range of 16ppm to 640ppm for Dimethyl formamide.| Table 3. Experimental Calculated Detection Limit (DL) and Quantification Limit (QL) of various residual solvents |
| | Methanol | Ethanol | Acetone | DCM | Benzene | Toluene | DMF | | Limit of Detection | 0.67ppm | 0.98ppm | 1.06ppm | 0.90ppm | 0.02ppm | 0.18ppm | 5.23ppm | | Limit of Quantitation (LOQ) | 2.04ppm | 2.96ppm | 3.20ppm | 2.27ppm | 0.07ppm | 0.53ppm | 15.84ppm | | Established LOQ | 2ppm | 8ppm | 4ppm | 4ppm | 0.08ppm | 2ppm | 16ppm | | % RSD at LOQ | 12.23 | 1.38 | 2.13 | 2.47 | 9.64 | 3.67 | 11.38 |
|
|
3.3. Precision
a) System PrecisionThe relative standard deviation of the results for Precision experiment was less than 15.0% for all solvents. b) Repeatability The relative standard deviation of the results of test for repeatability experiment was less than 15.0% for all solvents. c) Intermediate precision ExperimentThe relative standard deviation of the results of system precision for intermediate precision experiment was less than 15.0% for all solvents. The relative standard deviation of the results for test of intermediate precision experiment was less than 15.0% for all solvents.
3.4. Accuracy
The individual recoveries at 50%, 100% and 160% level were within 70.0% to 130.0% for each solvent. The mean recovery was within 80.0% to 120.0% for all the solvent other than Acetone. The mean recovery was within 75.0% to 125.0% for Acetone.
3.5. Range
The Method Complies with parameters of Precision, Linearity and Accuracy in the defined range of limit of detection to 160% of working concentration of each solvent. 1) The range of the method was 2ppm to 160ppm for Methanol.2) The range of the method was 8ppm to 640ppm for Ethanol.3) The range of the method was 4ppm to 320ppm for Acetone.4) The range of the method was 4ppm to 320ppm for Methanol.5) The range of the method was 0.08ppm to 3.2ppm for Benzene.6) The range of the method was 2ppm to 160ppm for Toluene.7) The range of the method was 16ppm to 640ppm for Dimethyl formamide.
3.6. Robustness
There was no significant difference in the results for Methanol, Ethanol, Acetone, Dichloromethane, Benzene, Toluene and Dimethyl formamide obtained by the normal method and those obtained by carrying out deliberate changes in the method. Hence the method was found robust with respect to change in the flow rate for the carrier gas.
3.7. Solution Stability
The difference in the two observed values for standard preparation for initial analysis and the analysis after keeping for 24 hour at room temperature. There was no significant change in the results for test preparation after 24 hour. Hence the solution prepared for standard and test were stable for 24 hour.
4. Conclusions
The suggested method can be successfully used to estimate the residual solvent present in the Diphenoxylate hydrochloride bulk drug.
ACKNOWLEDGEMENTS
Author is thankful to M/S RPG LIFE Sciences Limited for supplying gift samples of dugs to carry out this work.
References
| [1] | European Pharmacopoeia, Third Edition Published accordance with convention on the Elaboration of European Pharmacopoeia (1997). European Pharmacopoeia Supplement, 1999 p-14-18, 755-756. Section 5.4, European Pharmacopoeia, 4th edition (2002). |
| [2] | USP 25-NF 20 (2002). |
| [3] | Anil M. Dwivedi, Drug Delivery Technology. 2002, 26(11), 42-46. |
| [4] | D. Duparque, Analysis 1991, 19 (90), M22. |
| [5] | Horst Hachenbeg and Konrad Beringer, Editors(Beutsche:frank Furt/Main germany), 1999,102pp. |
| [6] | Costin C. Camarasu, Maria Mezei-Szuts and Gabor Bertok Vavga, J. Pharm Biomed. Anal. 1998, 18(4,5) 623-638. |
| [7] | Kerstin Brinnkmann and Siegfried Ebel, Pharm. Ind. 1999, 61(4), 372-376. |
| [8] | Kuyarskaya, Berta Iosefzon, Accredit Qual. Assur. 1999, 4(6), 240-246. |
| [9] | Yumi Nagai, Shimadzu Hyoron 2002, 59(1/2), 57-67. |
| [10] | Yiyao Gongye Zhongguo, Zazhi 2002, 33(4) 186-187. |
| [11] | Jingfang Huang and Yun Xu,Yaowu Fenxi Zazhi 2003, 23(2), 131-133. |
| [12] | Qin Guo, Lijun Zhang and Hongwen Dong, Zhongguo Yaoxue, Zazhi 2002, 37(7), 537-539. |
| [13] | Jinglan Liu and Huan Wang, Fenxi Huaxue 2004, 32(7), 961-963. |
 Abstract
 Reference
 Full-Text PDF
 Full-Text HTML