-
Paper Information
- Next Paper
- Previous Paper
- Paper Submission
-
Journal Information
- About This Journal
- Editorial Board
- Current Issue
- Archive
- Author Guidelines
- Contact Us
American Journal of Chemistry
p-ISSN: 2165-8749 e-ISSN: 2165-8781
2011; 1(2): 47-51
doi: 10.5923/j.chemistry.20110102.10
Evaluation of Kinetic Models of Copper and Lead Uptake from Dye Wastewater by Activated Pride of Barbados Shell
 Abstract
 Reference
 Full-Text PDF
 Full-Text HTML
S. Idris 1, Y.A. Iyaka 1, M. M. Ndamitso 1, E. B. Mohammed 2, M. T. Umar 3
1Department of Chemistry, Federal University of Technology P.M.B. 65 Minna Niger state Nigeria
2Center for Preliminary and Extra Moral Studies, Federal University of Technology, P.M. B.65, Minna, Niger State Nigeria
3Department of Chemistry, Ibrahim Badamasi Babangida University, Lapai, Niger state Nigeria
Correspondence to: S. Idris , Department of Chemistry, Federal University of Technology P.M.B. 65 Minna Niger state Nigeria.
| Email: |  |
Copyright © 2012 Scientific & Academic Publishing. All Rights Reserved.
Pride of Barbados shell was effectively used as a raw materials for the production of activated carbon with HNO3 as an activating agent using twostep process. Batch adsorption was used in interacting the dye wastewater with activated carbon within 30-150 minutes contact time. The maximum adsorption of Cu and Pb were 96.63% and 85.55% at 150 minutes and 30 minute contact time respectively. The result was found to match well with pseudo second-order compared to pseudo first-order, Natarajan and khalaf first order and Elovich model tested. Therefore, activated pride of barbados shell could be employed as an adsorbent in removing Cu and Pb from similar wastewater and aqueous solution.
Keywords: Activated Carbon, Pseudo Second-Order, Copper, Lead, Elovich Model
Cite this paper: S. Idris , Y.A. Iyaka , M. M. Ndamitso , E. B. Mohammed , M. T. Umar , "Evaluation of Kinetic Models of Copper and Lead Uptake from Dye Wastewater by Activated Pride of Barbados Shell", American Journal of Chemistry, Vol. 1 No. 2, 2011, pp. 47-51. doi: 10.5923/j.chemistry.20110102.10.
Article Outline
1. Introduction
- Activated carbon is the common term used for a group of adsorption substances with large internal structures that make the carbon more adsorbent. Activated carbon is made from a variety of raw materials that are heated and further treated, during this treatment some part turn to gas and leave pores behind. The effectiveness of activated carbon depends on its ability to adsorb a carbon substance or substances depending on the chemical and physical properties that carbon possesses (Jason, 2010). Activated carbon remains a best available technology for water treatment as it removes many organic compounds effectively. Specifically, activated carbon is commonly used for removal of organic taste and odor-causing compounds. Activated carbon is also apply in drinking water treatment to remove natural organic compounds that produce carcinogenic chlorinated by-products during chlorine disinfection of water.In wastewater treatment, activated carbon is usually used as a filter medium in tertiary treatment processes. In these applications, carbon filters are usually quite effective in removing low concentration of organic compounds as well as some inorganic metals. In addition to its drinking water and wastewater treatment application, activated carbon is used today for many other purposes. Some other common uses are corn and cane sugar refining, gas adsorption, dry cleaning recovery processes, pharmaceuticals, fat and oil removal, alcoholic beverage production. The aim of this work is to develop an adsorbent with appropriate porosity from pride of barbados shell by HNO3 activation and to investigate its adsorption kinetic using pseudo first-order model, pseudo second-order model, Natarajan and khalaf first order equation, Elovich model and to test the adsorption mechanism using intraparticle diffusion model.
2. Material and Methods
- The pride of barbados shell was collected from the premises of Government secondary school (GSS) Minna, Niger State, Nigeria. The dye wastewater was obtained from local dye industry, Jafaru Mairiga street F-layout Minna, Niger State, Nigeria in the month of June, 2010. It was stored at room temperature without further purification.The pride of barbados shell was dried and ground then sieved with a 2 mm mesh size sieve. The less than 2 mm samples were stored in air tight container. Ash content was determined according to the methods of AOAC (1990). Method described by Udo and Ogunwale (1986) was used to digest the dye wastewater. 10 cm3 of dye wastewater was measured into a beaker, 5cm3 of conc. HNO3 and 2 cm3 of HCl was added and covered with a watch glass. It was digested in a fume cupboard; 15 cm3 of deionized water was added and filtered using what man filtered paper No. 42.The final solution (i.e filtrate) was made to 100cm3 with deionized water.
2.1. Preparation of Activated Carbon
- Activation involving two steps activation process was adopted. Firstly, 5g of grounded raw sample was weighed into clean and weighed crucibles. They were introduce into a muffle finance at 600℃ for 5 minutes after which they were poured from the crucible into a bath of ice water. The excess water was drained off. The carbonized sample was washed suing 0.1M HCl to remove surface ash, followed by hot water wash and further washing with distilled water to remove residual acid. The sample was then sun dried and further dried in the oven at 100℃ for one hour. This process was repeated until a substantial amount of carbonated sample was obtained. Thereafter, 5g of carbonized sample was mixed with 5 cm3 of activation agent (IM HNO3). The sample was allowed to stand for 2 hours, after which it was introduced into a furnace and heated at 800℃ for 5 minutes. The activated sample was cooled with ice-cold water, excess water was drained off and the sample dried at room temperature. The above procedure was repeated for different dwell time (10 min and 15min) until substantial amount of the activated carbon was obtained. Washing of the activated sample was done with 0.1M HCl to remove surface ash, followed by hot water wash and rising with distilled water to remove residual acid. Washing was completed until the pH of the supernatant fall within 6-7, then the sample was dried in an oven at 110℃ overnight and stored in air tight container (Rahman et al., 2005; Fan et al., 2005; Ahmedna et al., 2005).
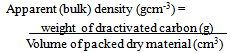
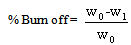
2.2. Activated Carbon Characteristics
 | (1) |
 | (2) |
 | (3) |
2.3. Batch Adsorption
- Adsorption was performed in batch where 2g of activated carbon was interacted with 40cm3 of dye wastewater and allowed to stand for 30 minutes. It was then filtered using whatman filter paper (No. 42). The process was repeated at pre-set times (60, 90,120 and 150 minutes). The concentration of copper and lead in the dye wastewater was determined before and after interaction with the activated carbon by a bulk scientific atomic absorption spectrophotometer (MODEL 210VGP) (Apipreeya et al., 2006).
2.3.1. Determination of the Adsorption Capacity
 | (4) |
2.4. Adsorption Kinetics
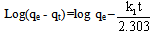
- In order to describe the adsorption kinetics for copper and lead on activated carbon, pseudo first-order (Lagergren, 1898), pseudo second-order (Ho et al., 2000), Natarajan and khalaf first order (Raji et al., 1986) and Elovich Model (Chien and Clayton, 1980; Sparks, 1986) were applied to the experimental data. Pseudo first –order equation:
 | (5) |
 | (6) |
 | (7) |
 | (8) |
2.5. Test of Kinetics Model
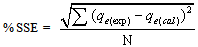
- The applicability of pseudo first- order and pseudo second- order kinetic models are verified through the sum of error squares (SSE, %) given by:
 | (9) |
 | (10) |
3. Results and Discussion
3.1. Characteristic of Activated Carbon
- The percentage ash content was low which is an indication of high carbon content. The pH of the activated carbon fall within the range of 6.48 ± 0.02 to 6.65 ± 0.01. This is in agreement with Ahmedna et al. (1997) that activated carbons produced from precursors with low ash content have been found to have low pH. The percentages yield of activated carbon was found to decrease with increase activation burn off because at longer residual time more volatiles are released from the char resulting to a higher burn off and a corresponding lower yield. Similar result was reported by Martinez et al. (2006). The result revealed that the apparent (bulk) density increase with increasing activation residual time which is an indication that at higher activation residual time, the hardness of activated carbon is high with a resultant high tendency for regeneration.
3.2. Effect of Contact Time
- The activated carbon (PBS/HNO3/5) indicated the maximum percentage of Cu removal at shorter contact time of 30 minutes, that is, 93.94% removed, thereafter desorption occur at contact time of 60 minutes which can be due to the decreased or lesser number of active sites. The adsorbent (PBS/HNO3/10) and (PBS/HNO3/15) showed optimum percentage Cu adsorption at longer contact time of 150 minutes, that is, 96.63% and 96.30% removed. The desorptions that occur at the short contact time give rises to more active site development which increases the adsorption efficiency (Fig.1). The findings show that the percentage Pb adsorption by adsorbent (PBS/HNO3/10) increased from 36.42% to 65.32% in the first 90 minute while the percentage Pb removed by activated carbon (PBS/HNO3/15) increased from 50.87% to 65.32% in first 60 minutes and after a decrease in the efficiency was observed. This may be due to the complete clogging of available adsorption sites on adsorbent material and unavailability of the free sites. The results further revealed the highest percentage Pb uptakes by the adsorbent (PBS/HNO3/15) of 30 minutes and 90 minutes that is, 85.55% adsorbed. Therefore, the slight desorption may be due exhausted binding sites of the adsorbent (Fig.2). Similar process was reported for the removal of chromium (vi) from aqueous solutions (Sucharita and Nandini, 2009).
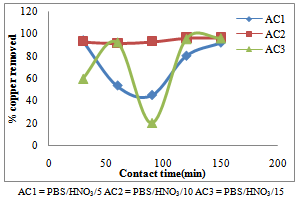 | Figure 1. Effect of contact time on the removal of copper by activated pride of Barbados shell |
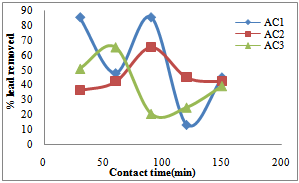 | Figure 2. Effect of contact time on the removal of lead by activated pride of Barbados shell |
3.3. Kinetic of Adsorption
- The pseudo first-order, pseudo second- order, Natarajan and khalaf first order and Elovich model equations and were applied to the adsorption data. The results of kinetic parameters are showns in table 2-7. The conformity between experimental data and the model predicted values was expressed by the correlation coefficients R2 (R2 values close or equal to 1). A relatively high R2 value indicates that the model successfully describe the adsorption kinetics. The R2 value of pseudo second–order is higher compared to R2 values of other kinetic models tested (table2-table7), Fig.3 and 4.
|
|
|
|
|
|
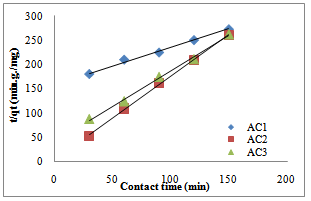 | Figure 3. Pseudo second-order model for copper adsorption by activated pride of Barbados shell |
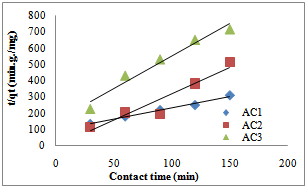 | Figure 4. Pseudo second-order model for lead adsorption by activated pride of Barbados shell |
3.4. Test of Kinetic Models
- Percentage sum of error squares (%SSE) was used to test the applicability of pseudo first-order and pseudo second- order kinetic models. The higher the value of R2 and the lower the values of % SSE, the better will be the goodness of fit. Also sample with least % SSE is accepted for a given model. The % SSE value for pseudo second order is lower compared to that of pseudo first-order (Table 2-Table 5). The result further confirm that the adsorption of Cu and Pb on the absorbent could be best described by the pseudo second- order kinetic models. Similar process was reported by Malik (2004) on the removal of dye one activated carbon prepared from sawdust.Table 8 show the intraparticle diffusion parameters for Cu and Pb adsorption. R2 value is low for all the adsorbent except 0.641 obtained for PBS /HNO3/10 for the Cu adsorption which implies that Cu adsorption by the adsorbent is intraparticle diffusion controlled.
|
4. Conclusions
- Removal of Cu and Pb from dye effluent was carried out using activated carbon prepared from pride of barbados as an adsorbent. Contact time for the interaction of the adsorbent with dye effluent is within 30-150 minutes. Maximum Cu adsorption of 96.63% was obtained at 150 minutes contact time and the maximum Pb removal of 85.55% was indicated at contact time of 30 minutes. Four kinetic model which include pseudo first-order, pseudo second-order, Natarajan and n Khalaf first order and Elovich model were used to test the adsorption. The kinetic of Cu and Pb adsorption on the different adsorbent was found to follow a pseudo second- order model. The findings revealed that the activation dwell time and contact time are also determining factors.
ACKNOWLEDGEMENTS
- The author acknowledges the laboratory technologists, Department of chemistry, federal university of technology, Minna, Niger State, Nigeria for their support during the course of the research.
References
| [1] | Ahmedna, N., Marshall, M., and Rao,M., 2000, Production of granular activated carbon from selected agricultural by- products. Bioresource Technology, 71(2), 113- 123 |
| [2] | AOAC., Official method of analysis, Washington Dc. Association of official analytical chemistry 14th edition: 140-147, 1990 |
| [3] | Apipreeya, k., Phussadee, P., and Prasert, P., 2006, Removal of metal ion from synthetic waste water by activated carbon from Eucalyptus camaldulensis Denn bark. The 2nd jointInternational Conference on “Sustainable Energy and Environment (SEE 2006)” E-041:1-9 |
| [4] | Bulut Y., and Aydin, H., 2006, A kinetics and thermodynamics study of methylene blue adsorption on wheat shells. Desalination, 194:259-267 |
| [5] | Chien, S.H. and Clayton, W. R., 1980, Application of Elovich equation to the kinetics of phosphate release and sorption on soils. Soil Sci. Soc. Am. J, 44:265-268 |
| [6] | Crank G., The mathematics of diffusion, clarenden press, London, New York, 1933 |
| [7] | Fan, M., Marshall, W., Daugaard, D. and Brown, C., 2005, Steam activation of chars produced from oat hulls. Bioresource Technology, 93 (1): 103-107 |
| [8] | Hameed, B.H., 2009, Evaluation of papaya seeds as a novel non-conventional low-cost adsorbent for removal of methylene blue. Journal of Harzadous Materials, 162:939-944 |
| [9] | Hameed, B.H., Din, A.T.M and Ahmed, A.L., 2007, Adsorption of mathylene blue onto bamboo-based activated carbon: kinetics and equilibrium studies. Journal of Hazardous Materials. 141:819-825 |
| [10] | Ho, Y.S., Mckay, G., Wase, D.A.J., and Foster, C.F., 2000, Study of the sorption of divalent metal ions onto peat. Adsorp. Sci. technology, 18:639-650 |
| [11] | Ioannidou, O., and Zabaniotou, A., 2006, Agricultural precursors for activated carbon production. Renewable and Sustainable Energy Review. 11 (1): 1966-2005 |
| [12] | Jason, P.P., 2010, Activated carbon and some application for the remediation of soil and ground water pollution: 3-14 |
| [13] | Lagergren, S., 1898, about the theory of so-called adsorption of soluble substances. K. Sven Vetenskapsaked Handl., 24 (4): 1-39 |
| [14] | Malik, P.K., 2004, Dye Removal from wastewater using activated carbon developed from sawdust: adsorption equilibrium and kinetics. Journal of Harzadous Materials, B113: 81- 88 |
| [15] | Martinez, M., Torres, M. Guzman, C. and Maestri, D., 2006, Preparation and characterization of activated carbon from olive stones and walnut shells. Journal of Industrial Crops and Products, 23(1) |
| [16] | Okiemen, F.E., Ojokoh, F.I., Okiemen, C.D. and Wuana R.A., 2004, Preparation and evaluation of activated carbon from rice husk and rubber seed shell. Chemical journal, 191-196 |
| [17] | Omonhenles, S., Ofomaja,A. and Okiemen, F., 2006, Adsorption of Methylene blue by unmodified and modified citric acid sawdust. Journal of Chemical Society of Nigeria, 30(1& 2): 161-164 |
| [18] | Rahman, I.A., Sa’ad, B., Shaidan, S. and Sya Rizal, E.S., 2005, Adsorption characteristics of malachite green on activated carbon derived from rice husks produced by chemical thermal process. Bioresources Technology, 96 (14): 1578- 1583 |
| [19] | Raji, C., Manju G.N. and Amirudhan, T.S., 1986, Removal of heavy metal ions from water using sawdust-based activated carbon. Indian J. Eng. Mater. Sci,, 4(6): 254-260 |
| [20] | Sparks, D.L., 1986, Kinetics of reaction in pure and mixed systems in soil physical chemistry. CRC Press, Boca Raton |
| [21] | Sucharita, T. and Nanadini, N., 2009, Adsorption efficiency of carbon from treated sugarcane bagasse in removing chromium (vi) from aqueous solutions by optimization of adsorption parameters. Journal of Applied and Natural Science, 1(2): 155-158 |
| [22] | Udo, E. J., and Ogunwale, A., Laboratory manual for the analysis of soil, plant and water samples, second edition, university press limited, Ibadan, Nigeria: 132-133, 1986 |