Research in Cell Biology

p-ISSN: 2326-1366    e-ISSN: 2326-1382

2014;  2(1): 1-7

doi:10.5923/j.cellbiology.20140201.01

Nitric Oxide Activates Plasma Membrane Insertion of the Betaine/GABA Transporter in Renal Epithelial Cells

Stephen A. Kempson1, Bailey M. Anderson1, Moshe Levi2, Judith Blaine2

1Department of Cellular and Integrative Physiology, Indiana University School of Medicine, Indianapolis

2Department of Medicine, University of Colorado Denver, Aurora

Correspondence to: Stephen A. Kempson, Department of Cellular and Integrative Physiology, Indiana University School of Medicine, Indianapolis.

Email:

Copyright © 2014 Scientific & Academic Publishing. All Rights Reserved.

Abstract

In the renal medulla nitric oxide (NO) plays an important role in sodium and water homeostasis, and NO synthase isoforms are expressed in medullary nephron segments. These segments also produce NO in response to hypertonic NaCl, but a possible role for NO during osmotic stress is unclear. When Madin-Darby canine kidney (MDCK) epithelial cells were switched from isotonic to hypertonic medium containing 1 mM nitroprusside, the transport activity of the renal betaine/GABA transporter (BGT1) was increased by 96% within 4 hr compared to hypertonic controls. BGT1 stimulation by nitroprusside also was observed after prior hypertonic adaptation for 24 hr. NO donors also stimulated the hypertonic activation of the system A amino acid transporter, SNAT2. Nitroprusside activation of BGT1 was not reproduced by membrane–permeable analogs of cyclic GMP. To understand the mechanism MDCK cells were transfected with EGFP-tagged BGT1 and imaged by total internal reflection fluorescence microscopy. The rate of recovery of plasma membrane fluorescence after photobleaching was increased almost two-fold in the presence of 1 mM nitroprusside, compared to controls. This suggests NO may accelerate the insertion of BGT1 protein into the basolateral plasma membrane during hypertonic stress, which helps to fully activate the adaptive response.

Keywords: Kidney, MDCK cells, BGT1, TIRF microscopy, NO, Confocal, Osmolyte

Cite this paper: Stephen A. Kempson, Bailey M. Anderson, Moshe Levi, Judith Blaine, Nitric Oxide Activates Plasma Membrane Insertion of the Betaine/GABA Transporter in Renal Epithelial Cells, Research in Cell Biology, Vol. 2 No. 1, 2014, pp. 1-7. doi: 10.5923/j.cellbiology.20140201.01.

1. Introduction

Hypertonic stress in the kidney induces numerous insults and cellular adaptation is a complex process that goes beyond volume regulation. For example, high extracellular NaCl induces oxidative stress in kidney cells in culture [1, 2], and in medullary thick ascending limbs in situ [3], as well as DNA strand breaks in cultured cells and in renal medulla in vivo [4]. Cellular responses include cell cycle arrest, accumulation of heat shock proteins, and activation of mechanisms that detect, repair, and protect against hypertonicity-induced DNA damage [5]. Recent work in C. elegans worms indicate that additional responses may be involved [6]. It has been suggested that hypertonic stress may generate a combination of signals that together lead to full activation of the adaptive responses [5].
One well-studied adaptation to chronic hypertonic stress in the kidney inner medulla involves cellular accumulation of organic osmolytes that do not disturb cell function. Betaine is present in plasma at 30-50 M in humans [7], and is derived mainly from the diet but can be augmented by synthesis in the liver and kidney [8]. It is freely filtered and reabsorbed by Na+ and H+ cotransport systems in the luminal membrane of the proximal tubule [9]. Betaine, together with myo-inositol, sorbitol, and glycerophosphorylcholine, serves as an organic osmolyte that is accumulated by cells of the inner medulla of animal and human kidneys to maintain osmotic balance [7, 10]. Intracellular betaine levels were determined to be at least 60 mM in tissue from inner medulla and papilla [10, 11]. Accumulation of betaine by medullary cells is mediated by the Na+ and Cl- dependent betaine/GABA transporter (BGT1), a member of solute carrier family 6 (SLC6A12) that also accepts GABA as a substrate [12]. Both synthesis and trafficking of BGT1 protein are upregulated by hypertonic stress and the protein is inserted in the basolateral plasma membrane of renal medullary cells [12]. Basolateral sorting is directed primarily by signals embedded within the primary structure of proteins [13], and both C-terminal trafficking motifs [14] and phosphorylation at T40 [15) have been shown to be critical for accurate BGT1 trafficking. Up- and down-regulation of BGT1 by changes in extracellular osmolarity is slow, requiring almost 24 hr. However, we and others have previously demonstrated relatively rapid regulation (within 30 min) of BGT1 transport in renal MDCK cells in response to extracellular ATP, adenosine, calcium and changes in extracellular pH [12].
NO production in the renal medulla plays a very important role in sodium and water homeostasis and the long-term control of arterial pressure [16, 17]. NO is highly diffusible and short-lived, and is synthesized from the amino acid L-arginine in a reaction catalyzed by NO synthase. Isoforms of NO synthase are found throughout the nephron [18] and NO production was detected directly in isolated thick ascending limbs using the fluorescent dye 4-amino-5-methylamino-2’,7’-difluorofluorescein diacetate (DAF-FM) [19]. NO action can be mediated by intracellular pathways that are cyclic-GMP dependent and by pathways that do not require cyclic GMP [18, 20]. Using microelectrodes, we showed previously that NO production by mouse medullary slices was initially 0.1 μM and increased in response to hypertonic bathing solution [21]. However the specific role of NO during osmotic stress is unclear. The present study is focused on the acute effects of NO donors, namely sodium nitroprusside (NP) and diethylamine NONOate (NONO), on the adaptive response of BGT1 to hypertonic stress in cultured renal medullary MDCK epithelial cells. Two different NO donors were tested to ensure that any response was due to released NO and not a side effect of the specific donor. The donors were tested both during the early phase (0 – 4 hr) and after completion (24 hr) of adaptation to hypertonic stress. The MDCK cell line was chosen because it produces NO [22, 23] and expresses BGT1 [15].

2. Materials and Methods

Sodium nitroprusside (NP) and diethylamine NONOate sodium salt (NONO), from Sigma-Aldrich (St Louis, MO) were freshly prepared for each experiment as 100 mM solutions in phosphate buffered saline (pH 7.4). Stocks were used immediately by adding aliquots directly to experimental solutions (pH 7.4). Nitro–L-arginine methyl ester (L-NAME) from Santa Cruz Biotechnology was used as a non-specific inhibitor of NO synthase isoforms.
MDCK cells (#CCL-34, American Type Culture Collection, Rockville, MD) were grown in monolayers in DMEM/Hams F12 (1:1) growth medium containing 10% bovine calf serum, penicillin (100 IU/ml) and streptomycin (100 μg/ml), and were maintained in an atmosphere of 5% CO2 in air. Cells were used between passages 15 and 40 and were grown on glass-bottom 35 mm culture dishes (Matek, Ashland, MA) for microscopy and in plastic 24-well plates for transport studies. Normal isotonic growth medium was made hypertonic (550 mOsm) by addition of NaCl crystals, and the osmolarity was determined by freezing point depression using an osmometer, as used and described previously [24].
MDCK cells were pre-loaded with the fluorescent dye DAF-FM diacetate (Molecular Probes, Eugene, OR) according to the manufacturer’s instructions. Briefly, MDCK cell monolayers on glass (Matek) were incubated with 10 uM DAF-FM diacetate for 60 min at 37℃ in isotonic DMEM growth medium containing 0.5% BSA but lacking both serum and phenol red to avoid interference with the fluorescent signal. The cells were washed to remove excess probe. The DAF-FM released by esterase activity remains intracellular and reacts specifically with NO to form a fluorescent product that is insensitive to pH changes [25, 26]. The live cells were covered with fresh DMEM medium, with or without addition of 1.0 mM NP, and were imaged immediately by confocal microscopy using 495 and 515 nm for excitation and emission, respectively, as described previously [24]. Quantitation of intracellular calcium was obtained using the calcium-sensitive fluorescent indicator Fura 2 exactly as described in our previous studies [27].
The transport activity of BGT1 was measured as Na+-Cl--dependent uptake of [3H]GABA, or [14C] betaine by MDCK cells in monolayer culture, as in previous studies [27, 28]. Both substrates were tested to ensure uniformity of responses. The Na+-dependent system A amino acid transporter (SNAT2, SLC38A2) [29] was used as a control because, like BGT1, it is localized to the basal-lateral plasma membrane of MDCK cells and can be removed by endocytosis. Unlike BGT1, it is upregulated much more rapidly (within 5-6 hr) by hypertonic stress [28]. Transport activity of SNAT2 was determined as Na+-dependent uptake of [14C] methylaminoisobutyric acid, a derivative of alanine [28].
The basolateral surface of MDCK cells was imaged by total internal reflection fluorescence (TIRF) microscopy [30]. The system, used in our previous studies [31, 32], was an Axiovert 200 inverted microscope (Zeiss) equipped with a TIRF laser illumination system (Zeiss), a high numerical aperture (1.45) oil immersion 100x objective, and a Photometrics QuantEM camera, all under the control of Axiovision software (Zeiss). The microscope was equipped with an incubation chamber (37℃) with humidity and CO2 controlled atmosphere. The system was adjusted for TIRF imaging of the basal plasma membrane with 488 nm laser excitation according to the manufacturer’s instructions. The MDCK cells were grown on glass-bottom 35 mm culture dishes and the cells expressed BGT1 tagged with enhanced green fluorescent protein (EGFP), as described in our previous experiments [24]. The EGFP-tagged protein (EGFP-BGT1) was shown previously to behave and function identically to native BGT1 In MDCK cells [24]. Prior to use some cells were adapted to hypertonic growth medium (550 mOsm) overnight while controls remained in normal isotonic medium. Cells were switched to fresh hypertonic or isotonic medium, respectively, 4-5 h prior to imaging. All fresh media contained 0.1% bovine serum albumin but lacked serum and phenol red. When used, NP was added to hypertonic growth medium 15 min prior to imaging. A bleach step with 100% laser power for 5 min eliminated any fluorescence already present in the plasma membrane. The rate of fluorescence recovery after photobleaching (FRAP) was determined by collecting approximately 25-30 images at 75 sec intervals, using the 488nm laser at 5% power for 250 msec. Axiovision software was used to quantitate the fluorescence of individual cells in the collected images and rates of recovery were determined by linear regression analysis.
Data are mean + SD of 3-4 experiments. Where appropriate, significant differences between groups (p<0.05) were determined by Student’s t-test or by analysis of variance and Tukey’s test for multiple comparisons. All images are representative of several cells on each coverglass.

3. Results

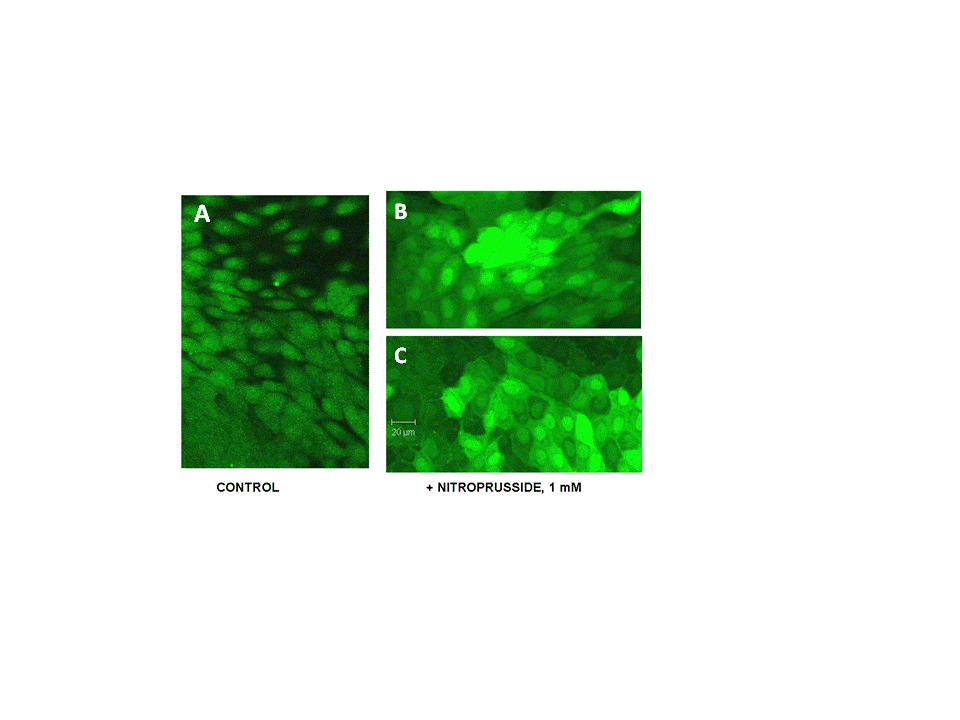
Figure 1. As expected, addition of sodium nitroprusside (1.0 mM final concentration) to native MDCK cells for 1 h produced a marked increase in intracellular NO content. This was confirmed in live cells pre-loaded with the fluorescent dye DAF-FM diacetate. There was a marked increase in intracellular fluorescence after addition of nitroprusside (B,C) compared to controls (A)
A qualitative comparison of confocal images of live cells revealed that, compared to controls (Fig. 1A), there was a marked increase in fluorescence after addition of 1 mM NP (Fig. 1B,C). This confirmed that NP was producing intracellular NO. In contrast, NP produced no change in intracellular calcium when this was quantitated using the Fura-2 technique (not shown). It was important to test for changes in calcium because we previously found that BGT1 transport activity in MDCK cells was sensitive to changes in intracellular calcium [27].
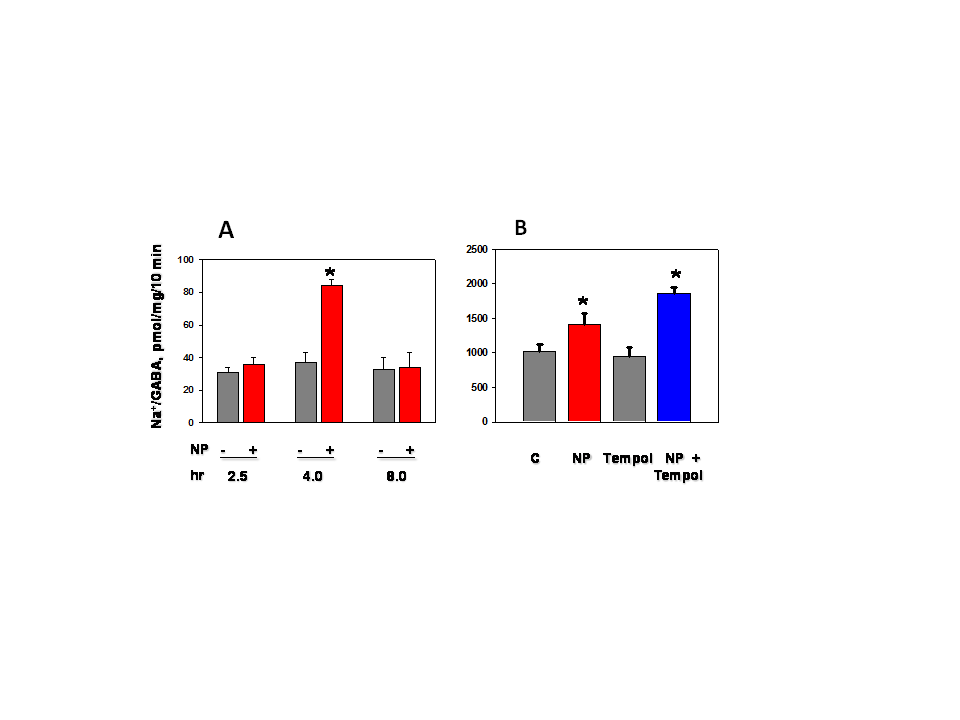
When MDCK cell monolayers were transferred to hypertonic (550 mOsm) growth medium containing 1.0 mM NP there was activation of BGT1 transport activity after 4 h which returned to control levels after 8 h (Fig 2A). This likely reflects the transient release of NO from the NO donor. NO appears to accelerate activation of BGT1 because activation by hypertonic stress alone requires 18-24 h [28]. The activation by NP was additive to the hypertonic effect because it was detectable when NP was added after 24 h hypertonic stress (Fig 2B). The presence of Tempol (1.0 mM), a scavenger of reactive oxygen species, had no direct effect on BGT1 but increased the response to NP (Fig. 2B), possibly by preventing NO degradation by oxygen radicals [33]. Thus, NP can activate BGT1 transport during both the early (4 hr) and completed (24 hr) phases of hypertonic adaptation. The substrate used for BGT1 transport in these studies was [3H]GABA.
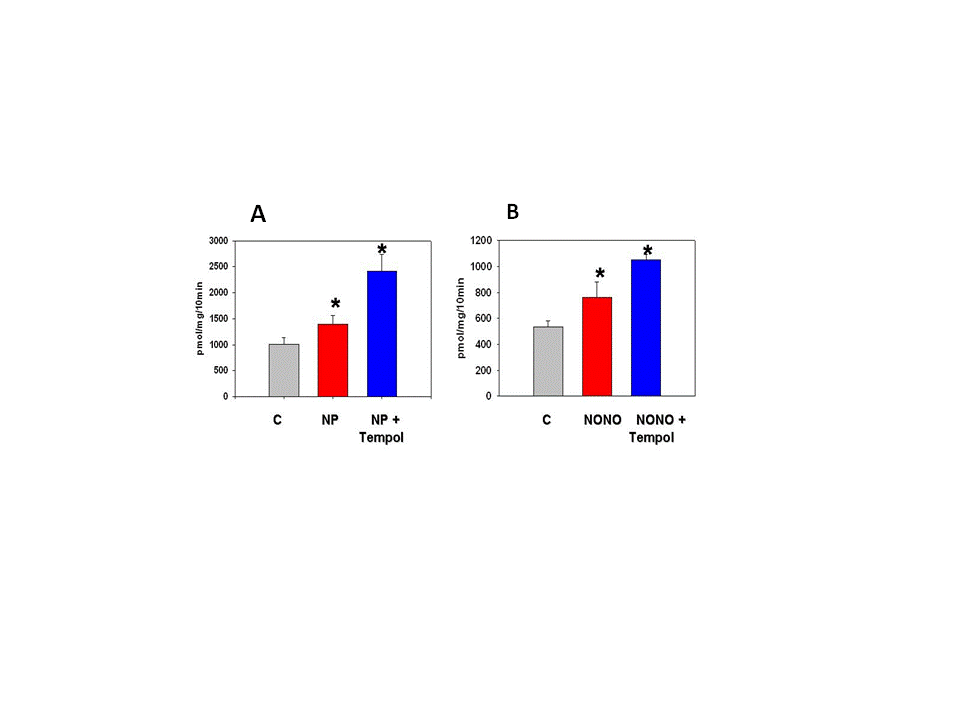
The effect of NO donors was not specific for BGT1 transport. Both NP (Fig. 3A) and NONO Fig. 3B) activated the SNAT2 amino acid transporter within 2 h when MDCK cells were switched to hypertonic medium containing either NP (1.0 mM) or NONO (0.1 mM). As for BGT1, activation of SNAT2 by both donors was increased by the presence of 1.0 mM Tempol.
Figure 2. A. Sodium nitroprusside (NP, 1.0 mM final concentration) activated BGT1 transport of GABA in MDCK cells within 4 hr when added at the onset of hypertonic stress (550mOsm). B. Similarly, NP also activated BGT1 transport when added for 2 h following 24 h of hypertonic stress, and this effect was enhanced by the presence of Tempol (1.0 mM). Controls (C) were exposed only to hypertonic stress. *Significant difference (p<0.05) compared to respective controls (n=3)
Figure 3. A. NP (1.0 mM) also activated cell uptake of methylaminoisobutyric acid (substrate for SNAT2) after just 2 hr hypertonic stress. This effect was increased in presence of 1.0 mM Tempol. B. NONO (0.1 mM) reproduced the effects of NP. *Significant difference (p<0.05) compared to controls (n=3)
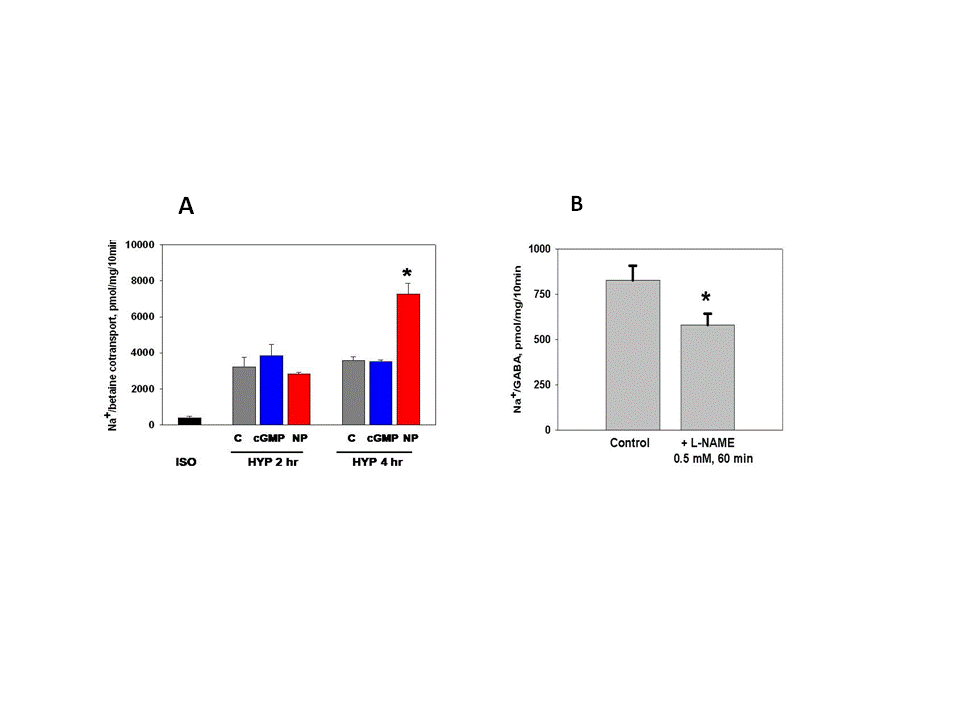
Figure 4. A. 8-Bromo-cyclic GMP (cGMP, 0.2 mM final concentration) did not activate BGT1 transport of betaine during hypertonic stress (HYP) for 2 or 4 h, suggesting that activation by NO donors did not utilize cyclic GMP-dependent pathways. ISO, isotonic controls. B. Following upregulation by 24 h of hypertonic stress, BGT1 transport of GABA was inhibited after 60 min treatment with L-NAME at 0.5 mM final concentration. *Significant difference (p<0.05) compared to respective controls (n=3-4)
Since the action of NO in thick ascending limbs of the nephron was mediated via the soluble guanylate cyclase/ cyclic GMP pathway [34], the effect of NP on BGT1 transport was compared with 8-bromo-cyclic GMP, a membrane-permeable analog of cyclic GMP [23]. In these experiments the substrate used for BGT1 transport was [14C]betaine. Similar to Fig. 2A, NP was added when cells were switched from isotonic to hypertonic growth medium. NP activated BGT1 transport after 4 h but not after 2 h indicating the response to NP was consistent and independent of whether betaine or GABA was used as the substrate. However, BGT1 transport was not activated by 8-bromo- cyclic AMP (0.1 mM) at either 2 or 4 h (Fig 4A), suggesting that NO action on BGT1 was not mediated by cyclic GMP-dependent pathways. p-Chlorophenyl-thio- cyclic GMP (0.1 mM), another cyclic GMP analog, also had no effect on BGT1 transport (not shown). As a positive control, activation by NP (1.0 mM) was still observed after 4 h hypertonicity (Fig. 4A). It remains to be determined if S-nitrosylation [23] is an alternative intracellular pathway by which NO activates BGT1.
L-NAME, a non-specific inhibitor of NO synthase isoforms, was shown previously to inhibit NO production in MDCK cells [22]. Using MDCK cells previously incubated 24 h in hypertonic growth medium to complete the adaptation to hypertonic stress, the addition of L-NAME for a further 60 min led to significant inhibition of BGT1 transport compared to the controls (Fig. 4B). This suggested that endogenous NO release due to the action of NO synthases was important to maintain the full adaptive response of BGT1 to hypertonic stress.
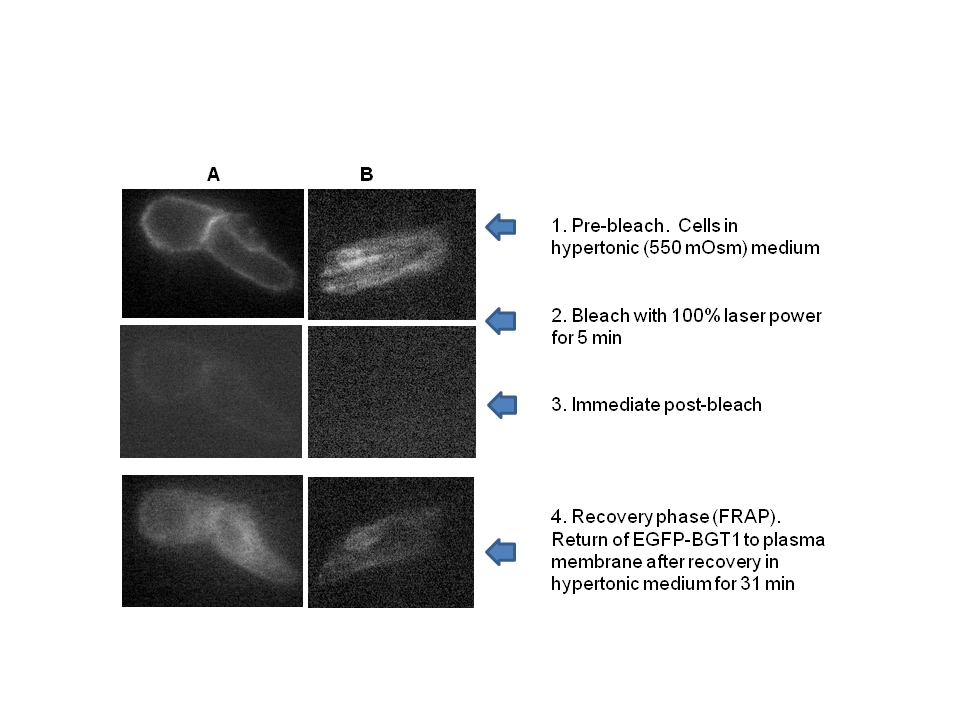
Figure 5. Summary of the TIRF-FRAP technique for studying the basolateral plasma membrane of live MDCK cells. Two separate cells (columns A and B) are shown. (1) Following hypertonic adaptation, BGT1 tagged with EGFP was present in the plasma membrane. (2) Fluorescence was bleached with 100% laser power for 5 min. (3) Immediately after bleaching no membrane fluorescence was detected. (4) New EGFP-BGT1 was inserted in the plasma membrane in the fluorescence recovery phase (FRAP) during which 25-30 images were collected at intervals of 75 sec. Plasma membrane fluorescence showed significant recovery 31 min after photobleaching. Full details in Materials and Methods
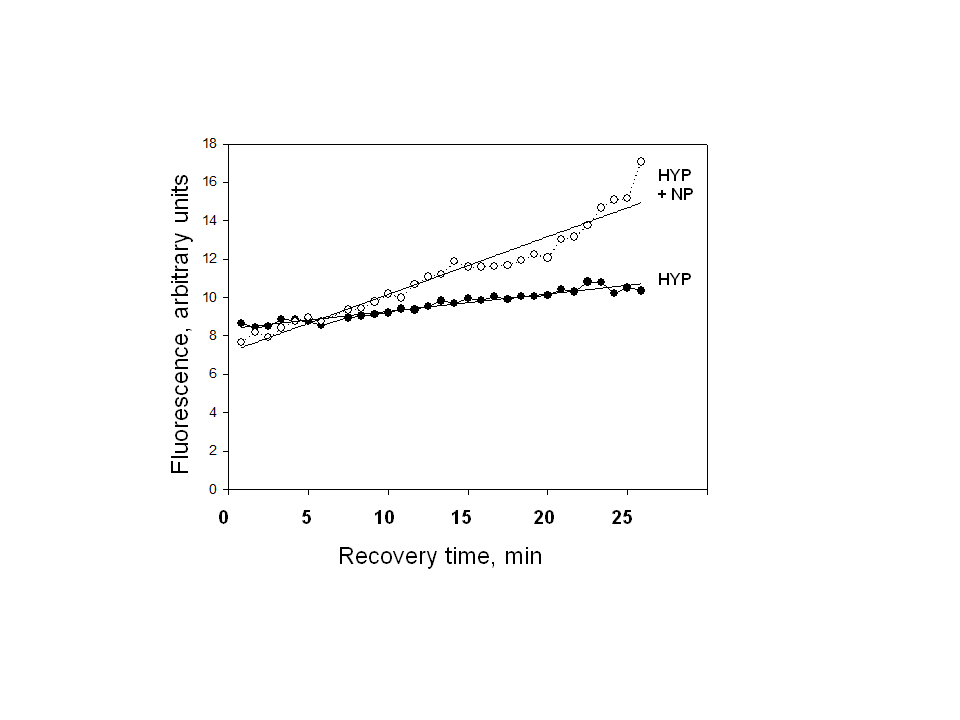
Figure 6. Chronic hypertonic stress (24 h). Rate of EGFP-BGT1 fluorescence recovery in hypertonically (HYP) adapted MDCK cells was more than 3-fold in the presence of sodium nitroprusside (NP, 1.0 mM) compared to HYP controls. NP was added for 15 min prior to TIRF-FRAP imaging. Rates of recovery (fluorescence units/min), determined by linear regression, were 0.09 U/min ( = 0.93) for HYP and 0.30 U/min ( = 0.94) for HYP + NP
The cellular mechanism by which NO donors upregulate BGT1 transport was studied by use of TIRF-FRAP fluorescence microscopy [30-32] to study the basolateral plasma membrane of MDCK cells grown on a glass surface. The protocol for these experiments is described under Materials and Methods and is depicted in Fig. 5. Since the technique monitors individual BGT1 proteins it affords testing responses to NP at a much shorter treatment time (15 min) than the transport studies. As before, both the acute and completed (chronic) phases of hypertonic adaptation were studied. The protocol used cells expressing EGFP-BGT1 [24] and adapted to hypertonic growth medium for 24 h (chronic stress). After imaging these cells to determine the rate of fluorescence recovery, NP was added for 15 min and then different cells in the same dish were imaged to determine the rate of fluorescence recovery in the presence of 1.0 mM NP. A representative experiment (Fig. 6) showed that NP caused a 3.3-fold increase in recovery, consistent with increased rate of insertion of EGFP-BGT1 in the basolateral plasma membrane. This supports the data (Fig. 2B) showing increased BGT1 transport activity in response to NP added after 24 h hypertonic adaptation. It also reveals a response to relatively brief (15 min) exposure to NP.
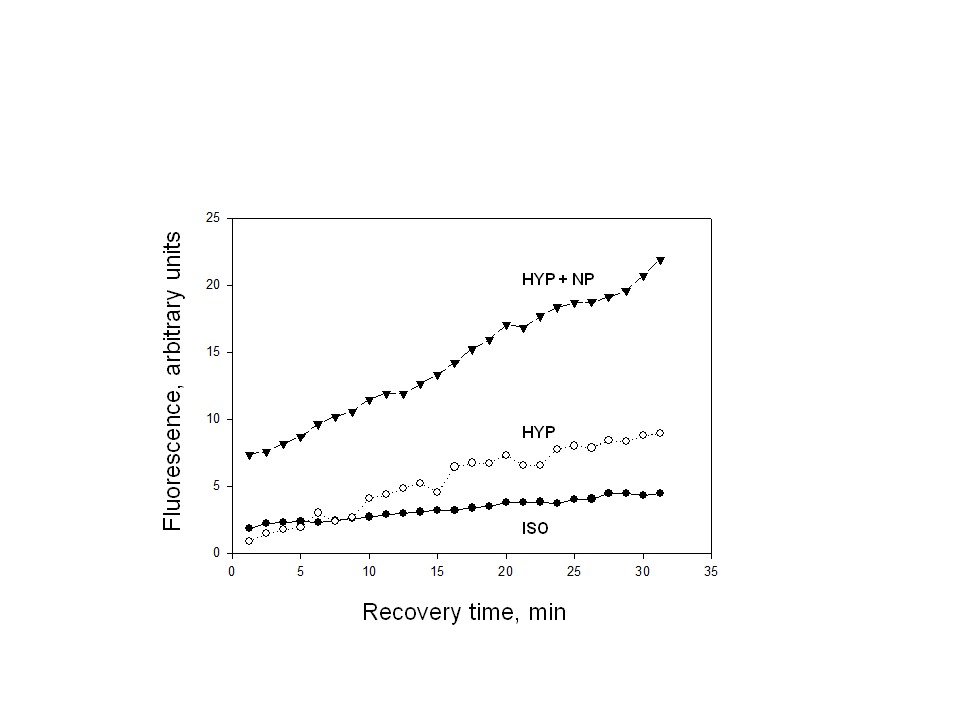
Figure 7. Acute hypertonic stress (4h). Rate of fluorescence recovery of EGFP-BGT1 after acute hypertonic stress was increased 3-fold compared to isotonic MDCK controls (ISO). Addition of NP (1.0 mM) produced an almost 2-fold additional increase in rate of recovery compared to acute hypertonic stress (HYP) alone. NP was added for 15 min prior to TIRF-FRAP imaging. Rates of recovery were 0.09 U/min ( = 0.98) for ISO, 0.27 U/min ( = 0.96) for HYP, and 0.48 U/min ( = 0.99) for HYP + NP
Next, the TIRF-FRAP technique was used to study NP action on the response of BGT1 to 4h hypertonicity (acute stress), based on our previous confocal study [24] that detected insertion of EGFP-BGT1 into the plasma membrane within 2-3 h of hypertonic stress. The same dish of cells was used for each successive protocol as follows. Fluorescence recovery was imaged first under isotonic conditions. The growth medium was then changed to hypertonic for 4 h and fluorescence recovery was imaged again in different cells in the same dish. Lastly NP was added at 1.0 mM final concentration for 15 min and fluorescence recovery was imaged again in different cells. A representative experiment (Fig. 7) showed that acute hypertonicity increased the rate of fluorescence recovery 3.0 – fold compared to isotonic controls. This is consistent with our previous confocal data [24). This did not translate into an overall increase in BGT1 transport after 4 h hypertonicity (Fig. 2A) possibly because insufficient BGT1 proteins had accumulated in the basolateral membrane during this relatively short time. The presence of NP in hypertonic medium produced a further increase (1.8-fold) in the rate of fluorescence recovery compared to hypertonic cells (Fig. 7). This additional increase in the rate of insertion of EGFP-BGT1 into the basolateral membrane likely explains the NP-activated BGT1 transport observed after 4 h (Fig. 2A).

4. Conclusions

We showed previously that NO production in medullary slices was increased rapidly (within 5 min) following onset of hypertonic stress [21]. This precedes the hypertonic activation of BGT1 transport which requires a few hours [24, 28]. NO likely accelerates the adaptive response to hypertonic stress in MDCK cells, specifically by upregulation of the BGT1 and SNAT2 transporters present in the basolateral plasma membrane. The intracellular signaling pathways that upregulate BGT1 remain to be elucidated but are not dependent on cyclic GMP since NP action was not reproduced by membrane-permeable analogs of cyclic GMP. Other intracellular pathways, possibly S-nitrosylation [23], may be involved.
The final step in upregulation of BGT1 transport activity by NO likely involves increased insertion of BGT1 proteins into the basolateral plasma membrane. These data appear to conflict with a previous report that NO donors decreased expression of osmoprotective genes in MDCK cells by directly inhibiting the specific transcription factor termed tonicity-responsive enhancer binding protein (TonEBP) and also known as NFAT5 [12, 23]. However, the NO donors were applied for 24 h, a much longer period than used in the present study. It is also possible that the initial (4 h) stimulation of BGT1 membrane insertion by NO may be followed by downregulation of transcription at 24 h. This could account in part for the fact that BGT1 upregulation by hypertonicity reaches a maximum after 24 h [28].
In conclusion, NO is another example of a rapidly acting regulator of the BGT1 transporter but, in contrast to other rapidly acting factors such as calcium, ATP and adenosine that downregulate BGT1 transport [12], NO upregulates the transporter and is not specific for BGT1 since SNAT2 is also upregulated. This supports the concept that one of the roles of NO produced by renal medullary cells during hypertonic stress [21] may be acceleration of the adaptive response of specific osmolyte transporters.

ACKNOWLEDGEMENTS

Supported in part by a grant from the American Heart Association Midwest Affiliate (SAK), and by the Life-Health Science Internship at IUPUI (BMA). TIRF-FRAP studies were conducted in the Advanced Microscopy Core Facility at the University of Colorado Denver. We thank Dr HG Bohlen (Indiana University School, of Medicine) for helpful discusions.

References

[1]  Zhang, Z., Dmitrieva, N.I., Park, J.H., Levine, R.L., and Burg, M.B., 2004. High urea and NaCl carbonylate proteins in renal cells in culture and in vivo, and high urea causes 8-oxoguanine lesions in their DNA. Proc. Natl. Acad. Sci. USA., 101:9491-9496.
[2]  Zhou, X., Ferraris, J.D., Cai, Q., Agarwal, A., and Burg, M.B., 2005. Increased reactive oxygen species contribute to high NaCl-induced activation of the osmoregulatory transcription factor TonEBP/OREBP. Am. J. Physiol. Renal Physiol., 289:F377-385.
[3]  Mori, T., and Cowley, A.W., 2004. Renal oxidative stress in medullary thick ascending limbs produced by elevated NaCl and glucose. Hypertension, 43:341-346.
[4]  Dmitrieva, N.I., Cai, Q., and Burg, M.B,. 2004. Cells adapted to high NaCl have many DNA breaks and impaired DNA repair both in cell culture and in vivo. Proc. Natl. Acad. Sci. USA., 101:2317-2322.
[5]  Dmitrieva, N.I., Burg, M.B., and Ferraris, J.D., 2005. DNA damage and osmotic regulation in the kidney. Am. J. Physiol. Renal Physiol., 289:F2-7.
[6]  Lamitina, S.T., and Strange, K., 2005. Transcriptional targets of DAF-16 insulin signaling pathway protect C. elegans from extreme hypertonic stress. Am. J. Physiol. Cell Physiol., 288:C467-474.
[7]  Sizeland, P.C., Chambers, S.T., Lever, M., Bason, L.M., and Robson, R.A., 1995. Short-term response of nonurea organic osmolytes in human kidney to a water load and water deprivation. Am. J. Physiol. Renal Physiol., 268:F227-233.
[8]  Dellow, W.J., Chambers, S.T., Lever, M., Lunt, H., and Robson, R.A., 1999. Elevated glycine betaine excretion in diabetes mellitus patients is associated with proximal tubular dysfunction and hyperglycemia. Diabetes Res. Clin. Practice, 43:91-99.
[9]  Wunz, T.M., and Wright, S.H., 1993. Betaine transport in rabbit renal brush-border membrane vesicles. Am. J. Physiol., 264:F948-F955.
[10]  Bagnasco, S., Balaban, R., Fales, H.M., Yang, Y.M., and Burg, M., 1986. Predominant osmotically active organic solutes in rat and rabbit renal medullas. J. Biol. Chem., 261:5872-5877.
[11]  Lohr, J.W., Pochal, M.A., and Acara, M., 1991. Osmoregulatory betaine uptake by rat renal medullary slices. J. Am. Soc. Nephrol., 2:879-884.
[12]  Kempson, S.A., Zhou, Y., and Danbolt, N.C., 2014. The betaine/GABA transporter and betaine: roles in brain, kidney and liver. Front. Physiol., 5. doi:10.3389/fphys.2014.00159.
[13]  Stoops, E.H., and Caplan, M.J., 2014. Trafficking to the apical and basolateral membranes in polarized epithelial cells. J. Am. Soc. Nephrol., 25:1375-1386.
[14]  Perego, C., Bulbarelli, A., Longhi, R., Caimi, M., Villa, A., Caplan, M.J., and Pietrini, G., 1997. Sorting of two polytopic proteins, the GABA and betaine transporters, in polarized epithelial cells. J. Biol. Chem., 272:6584-6592.
[15]  Schweikhard, E.S., Kempson, S.A., Ziegler, C., and Burckhardt, B.C., 2014. Mutation of a single threonine in the cytoplasmic NH2 terminus disrupts trafficking of renal betaine-GABA transporter 1 during hypertonic stress. Am. J. Physiol. Renal Physiol., 307:F107-F115.
[16]  Cowley, A.W., Jr., Mori, T., Mattson, D., and Zou, A.-P., 2003. Role of renal NO production in the regulation of medullary blood flow. Am. J. Physiol. Regul. Integr. Comp. Physiol., 284:R1355-1369.
[17]  Evans, R.G., and Fitzgerald, S.M., 2005. Nitric oxide and superoxide in the renal medulla: a delicate balancing act. Curr. Opin. Nephrol. Hypertens., 14:9-15.
[18]  Ortiz, P.A., and Garvin, J.L., 2002. Role of nitric oxide in the regulation of nephron transport. Am. J. Physiol. Renal Physiol., 282:F777-784.
[19]  Cabral, P.D., and Garvin, J.L., 2014. TRPV4 activation mediates flow-induced nitric oxide production in the rat thick ascending limb. Am. J. Physiol. Renal Physiol., 307:F666-F672.
[20]  Perri, R.E., Langer, D.A., Chatterjee, S., Gibbons, S.J., Gadgil, J., Cao, S., Farrugia, G., and Shah, V.H., 2006. Defects in cGMP-PKG pathway contribute to impaired NO dependent responses in hepatic stellate cells upon activation. Am. J. Physiol. Gastrointest. Liver. Physiol., 290:G535-542.
[21]  Kempson, S., Thompson, N., Pezzuto, L., and Bohlen, H.G., 2007. Nitric oxide production by mouse renal tubules can be increased by a sodium-dependent mechanism. Nitric Oxide, 17:33-43.
[22]  Wu, Z., Nybom, P., Sundqvist, T., and Magnusson, K.-E., 1998. Endogenous nitric oxide in MDCK-I cells modulates the Vibrio choleraehaemagglutinin / protease (HA/P)- mediated cytotoxicity. Microb. Pathog., 24:321-326.
[23]  Neuhofer, W., Fraek, M.-L., and Beck, F.-X., 2009. Nitric oxide decreases expression of osmoprotective genes via direct inhibition of TonEBP transcriptional activity. Pflügers. Archiv. Eur. J. Physiol., 457:831-843.
[24]  Kempson, S.A., Parikh, V., Xi, L., Chu, S., and Montrose, M., 2003. Subcellular distribution of the renal betaine transporter during hypertonic stress. Am. J. Physiol. Cell Physiol., 285:C1091-C1100.
[25]  Kovacs, G., Komlosi, P., Fuson, A., Peti-Peterdi, J., Rosivall, L., and Bell, P.D. 2003., Neuronal Nitric Oxide Synthase: Its Role and Regulation in Macula Densa Cells. J Am Soc Nephrol 14:2475-2483.
[26]  Chu, S., and Bohlen, H.G., 2004. High concentration of glucose inhibits glomerular endothelial eNOS through a PKC mechanism. Am. J. Physio. Renal Physiol., 287:F384-F392.
[27]  Kempson, S.A., Edwards, J.M., and Sturek, M., 2006. Inhibition of the renal betaine transporter by calcium ions. Am. J. Physiol. Renal Physiol., 291:F305-F313.
[28]  Kempson, S.A., 1998. Differential activation of system A and betaine/GABA transport in MDCK cell membranes by hypertonic stress. Biochim. Biophys. Acta, 1372:117-123.
[29]  Hatanaka, T., Hatanaka, Y., and Setou, M., 2006. Regulation of amino acid transporter ATA2 by ubiquitin ligase Nedd4-2. J. Biol. Chem., 281:35922-35930.
[30]  Blaine, J., Lanzano, L., Giral, H., Caldas, Y., Levi, M., Gratton, E., Moldovan, R., and Lei, T., 2011. Dynamic Imaging of the Sodium Phosphate Cotransporters. Adv. Chronic Kidney Dis., 18:145-150.
[31]  Blaine, J., Okamura, K., Giral, H., Breusegem, S., Caldas, Y., Millard, A., Barry, N., and Levi, M., 2009. PTH-induced internalization of apical membrane NaPi2a: role of actin and myosin VI. Am. J. Physiol. Cell Physiol., 297:C1339-C1346.
[32]  Dobrinskikh, E., Okamura, K., Kopp, J.B., Doctor, R.B., and Blaine, J., 2014. Human podocytes perform polarized, caveolae-dependent albumin endocytosis. Am. J. Physiol. Renal Physiol., 306:F941-F951.
[33]  Moss, N.G., Kopple, T.E., and Arendshorst, W.J., 2014. Renal vasoconstriction by vasopressin V1a receptors is modulated by nitric oxide, prostanoids, and superoxide but not the ADP ribosyl cyclase CD38. Am. J. Physiol. Renal Physiol., 306:F1143-F1154.
[34]  Hong, N.J., and Garvin, J.L., 2009. Nitric oxide reduces flow-induced superoxide production via cGMP-dependent protein kinase in thick ascending limbs. Am. J. Physiol. Renal Physiol., 296:F1061-F1066.