International Journal of Biophysics

p-ISSN: 2168-4979    e-ISSN: 2168-4987

2017;  7(4): 53-59

doi:10.5923/j.biophysics.20170704.01


Size-Resolved Concentration of Bacteria and Fungi in Indoor and Outdoor Environments

Mona Moustafa

Physics Department, Faculty of Science, Minia University, El-Minia, Egypt

Correspondence to: Mona Moustafa, Physics Department, Faculty of Science, Minia University, El-Minia, Egypt.

Email:

Copyright © 2017 Scientific & Academic Publishing. All Rights Reserved.

This work is licensed under the Creative Commons Attribution International License (CC BY).
http://creativecommons.org/licenses/by/4.0/

Abstract

Concentration and size distribution of bacteria and fungi were evaluated in the kitchen and restaurant as an indoor environment in Minia university staff members club (El-Minia/Egypt) in summer time during the morning and afternoon periods. Measurements are also performed in outdoor. Six –stage Andersen impactor was used for sampling the biological particles. Temperature and relative humidity were recorded during the sampling. In all conditions, the indoor bacterial concentration was higher than the fungal concentration. The highest mean concentration of bacteria (650 cfu/m3) was found in the restaurant while the highest mean concentration of fungi (322 cfu/m3) was found in the kitchen. The outdoor mean concentration of bacteria was 170 cfu/m3 while the mean concentration of outdoor fungi was 214 cfu/m3. Most of bacterial and fungal concentrations are high in the size range of respirable particles (< 0.5 µm) that can penetrate deep in the human lung. Bacterial particles have higher dispersion than fungal particles. It was found that the environmental factors, temperature and relative humidity impact on the particle concentrations.

Keywords: Bacteria, Fungi, Kitchen, Restaurant, Andersen impactor, Particle size

Cite this paper: Mona Moustafa, Size-Resolved Concentration of Bacteria and Fungi in Indoor and Outdoor Environments, International Journal of Biophysics , Vol. 7 No. 4, 2017, pp. 53-59. doi: 10.5923/j.biophysics.20170704.01.

1. Introduction

Indoor air is the most important environment affect the human health as it is the dominant source of microbes [1]. Indoor air contains a complex mixture of microbes, fragments, byproduct, bacteria, fungi, endotoxin and volatile microbial organic compounds [2]. In many indoor environments, fungi, bacteria and their fragments lie in the respirable size range (<5 µm) that can penetrate deep in the human respiratory tract [3, 4].
The quality of outdoor air, ventilation and air conditioning system and the emission source of microorganisms affect the indoor air quality (IAQ) [5]. Indoor air quality within the restaurant environment is affected by the number of occupants or visitors [1]. Poor indoor air quality is associated with several health hazard [3]. This includes skin and eye irritations, dry cough, allergy, asthma, sick building syndrome and chronic respiratory infections [1].
It can be hypothesized that the occupational diseases were at least partly caused by moist conditions and subsequent microbiological exposure in the kitchen [6]. Microbial exposure arise both directly, from handling, preparing and eating food and indirectly from contact with surfaces [7-9]. The exchange of microbes between humans and kitchen and restaurant environments can impact human health.
Recently, many studies have evaluated the concentration of biological particles such as fungi and bacteria in various indoor environments [10-13]. Biological aerosol particles levels in indoor air depend on many physical and biological factors [14]. Because people spend most of their time (about 90%) in different indoor environments [15], the assessment of microbiological quality of indoor air environment all over the world is important for public health. Size distribution characterization of bioaerosols such as bacteria and fungi is valuable and represents an important key for the assessment of air quality and human health.
In addition, size distribution parameters are vital and essential in the calculation of particles lung deposition using lung models. Because of these reasons, this study aimed to investigate the concentration and size distribution of bacterial and fungal biological particles in the kitchen and the restaurant as an indoor environments and outdoor air as well.

2. Materials and Methods

2.1. Study Sites

Measurements of bacteria and fungi concentrations were performed in the kitchen and the restaurant of Minia university staff members club (Minia/Egypt) as an indoor environment. The study includes also measurements of bacteria and fungi in outdoor environment of the club.
Description of the study sites is presented in table 1.
Table 1. Description of the Study Sites
     

2.2. Air Sampling

Airborne bacteria and fungi were collected using the sex-stage Andersen impactor (ACI) with a flow rate of 28.3 L/min. This impactor fractionates the collected biological particles according to their aerodynamic diameters from 0.65 to above 7.0 µm. The collection efficiency of Andersen impactor was previously validated [16, 17]. The stages of the impactor simulates the human respiratory tract.
Measurements were carried out during summer season. Measurements were performed at two different periods of time: in the morning from 9:30 am to 11:30 am and afternoon from 2: 00 Pm to 3:45 Pm in the kitchen, the restaurant and outdoor. During sampling, the impactor was located at a height of 1.5 m above the ground level to simulate the breathing zone.
Two different media were used for sample collection, sabourauds dextrose agar (SDA) supplemented with chloramphenicol for collecting fungi and nutrient agar (NA) for collecting bacteria. A volume not less than 27 ml of culture medium was placed in each plate then they were inserted into the impactor stages. The sampling time of each run was 15 min to avoid overestimated number of particles. During the measurement, the environmental parameters; temperature and relative humidity are recorded and are summarized in table 2.
Table 2. Environmental Parameters: Mean Temperature, T (°C) and Mean Relative Humidity, RH (%) (K: Kitchen, R: Restaurant, O: Outdoor)
     
After sampling, the plates were incubated at 37°C for 2-3 days depending on the growth of colonies [18]. Colonies growing on the plates were counted and concentration of bacterial and fungal particles were calculated as colony forming unit per cubic meter of air (cfu/m3) by:
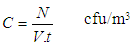
Where:
C is the particles concentration,
N is the number of colonies on each stage of the impactor
V is the impactor flow rate (m3/h),
t is the sampling time (hour)

3. Results and Discussion

3.1. Concentration of Bacteria and Fungi

The mean concentrations of bacteria and fungi measured in the kitchen, restaurant and outdoor of the Minia university staff members club during the morning and afternoon periods are summarized in table 3.
Table 3. Mean Concentration of Bacteria and Fungi
     
The mean concentrations of bacterial particles were 438 ± 63 cfu/m3 and 541 ± 82 cfu/m3 in the kitchen and restaurant, respectively in the morning period. Human skin and food are the main sources of bacterial particles in all kitchen surfaces [19]. The bacterial level increased in the restaurant to reach 760 ± 124 cfu/m3 during the afternoon period due to the increased number of occupants and the higher human activities indicating that the main source of indoor microbes is the number of individuals [5, 20]. It is noticed that the bacterial concentration increased at low temperature environment. Similar results were found by other studies [14, 21].
The mean concentrations of fungi were 341 ± 82 cfu/m3 and 120 ± 23 cfu/m3 in the kitchen and restaurant, respectively in the morning period. These concentrations are relatively decreased to 303 ± 146 cfu/m3 and 91 ± 21 cfu/m3 in the kitchen and restaurant, respectively in the afternoon period. These results suggesting that the human is not a source for fungal particles. The concentration of fungi increases with the relative humidity where the microbial growth is stimulated with high relative humidity [14, 21]. The fungal concentration increased also with the emission rate [22]. Ventilation system, surface texture of walls and the presence of organic materials in indoor environment leads to the production of high fungal particles concentration [3, 23].
In all cases, the indoor fungal concentration is lower than the indoor bacterial concentration. The present results agree with other studies [3, 24-27].
The outdoor concentration of bacteria was 207± 79 cfu/m3 in the morning and turns to be decreased to 134 ± 34 cfu/m3 in the afternoon period. While the outdoor concentration of fungi was 115 ± 24 cfu/m3 in the morning and turns to be relatively increased to 157 ± 41 cfu/m3 in the afternoon period.
The mean concentration of bacterial and fungal particles in indoor and outdoor environments are in the range of World Health Organization guide line value of 500 cfu/m3 [28].

3.2. Indoor / Outdoor Ratio of Microorganisms (I/O Ratio)

For comparing the strength of indoor and outdoor sources of microorganisms, the indoor/outdoor ratio (I/O ratio) for bacterial and fungal concentrations are calculated. If I/O ratio is greater than unity, it suggests that the microorganisms are derived from indoor sources and if the ratio is lower than unity, it indicates that the major sources for emitting microorganisms are from outdoor.
To calculate the I/O ratio, the mean concentrations of bacteria and fungi in indoor (kitchen and restaurant) and a reference site in outdoor were calculated as summarized in table 4. The I/O ratio of bacteria and fungi in the kitchen and restaurant are listed in table 5.
Table 4. Mean Concentration (cfu/m3) of Indoor and Outdoor Bacteria and Fungi
     
Table 5. Mean I/O Ratio of Bacteria and Fungi
     
The I/O ratio of bacteria is greater than unity at both sites which indicates that the main source for bacteria is the human in indoor environment. While the I/O for fungi are 1.5 and 0.5 in the kitchen and restaurant, respectively suggesting that the indoor fungi mostly emitted from external sources. These results are in agreement with other studies [5, 25-27, 29, 30].

3.3. Size Distribution of Bacteria and Fungi

The parameters of the size distribution, Median Aerodynamic Diameter (MAD) and Geometric Standard Deviation (GSD) are given by the following equations [31].
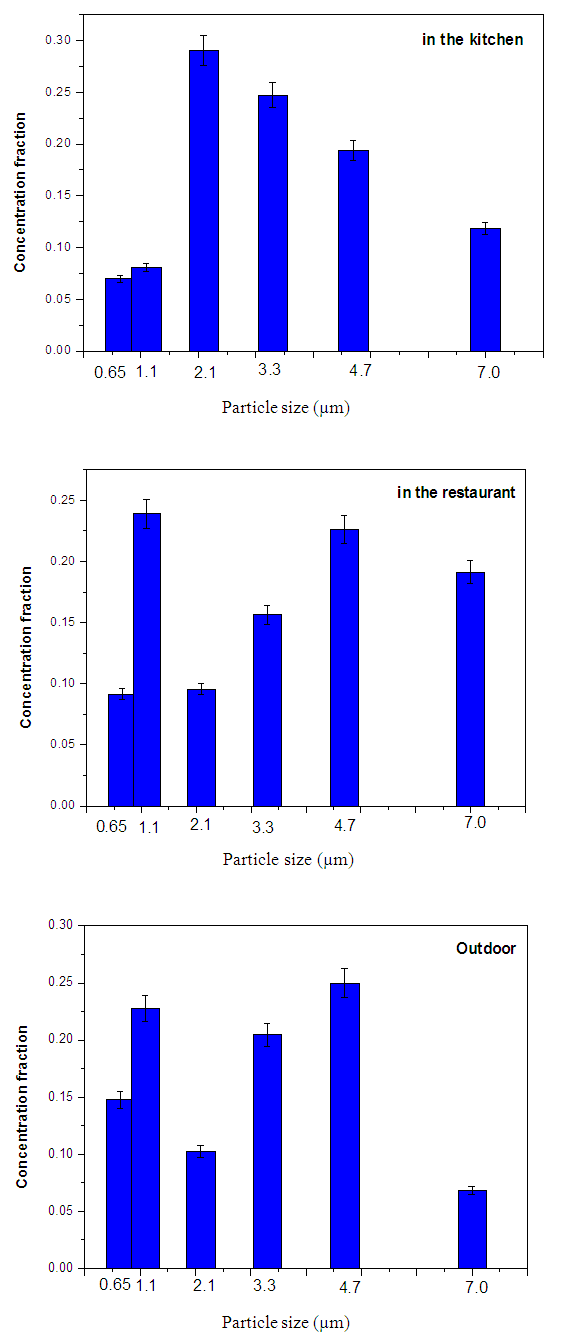
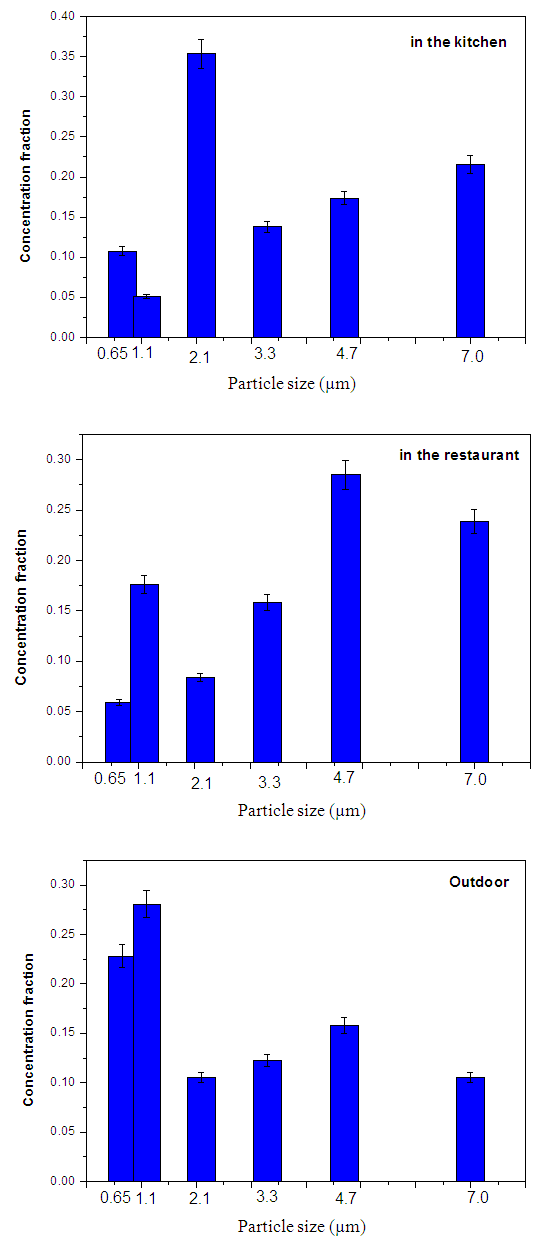
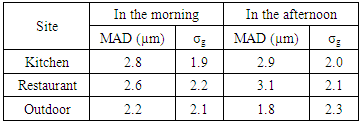
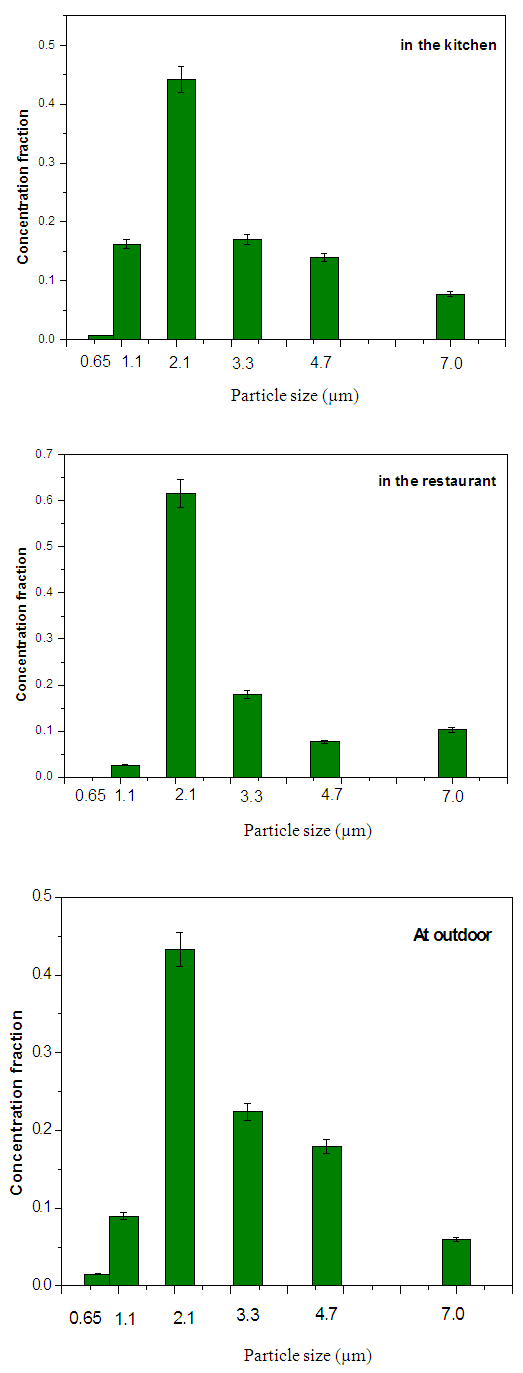
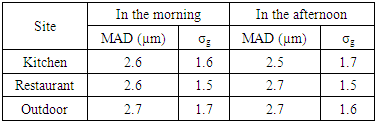
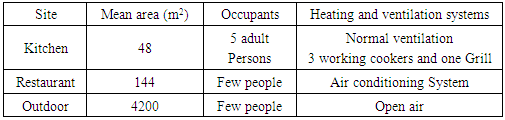
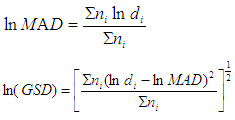
Where MAD is the median aerodynamic diameter, ni is the fraction in stage i, di is the cutoff diameter of the stage i and GSD is the geometric standard deviation (σg). MAD is defined as the diameter at 50% cumulative fractions. GSD of the size distribution is defined as the diameter at 84% cumulative number divided by the diameter obtained at 50%.
Size distribution of bacteria sampled in the kitchen, restaurant and outdoor in the morning and afternoon are shown in figures 1 and 2, respectively. The size distribution parameters of bacteria; median aerodynamic diameter (MAD) and geometric standard deviation (σg) are summarized in table 6.
Figure 1. Indoor and outdoor size distribution of bacteria sampled in the Morning
Figure 2. Indoor and outdoor size distribution of bacteria sampled in the afternoon
Table 6. Size Distribution Parameters of Bacterial Particles: Median Aerodynamic Diameter (MAD) and Geometric Standard Deviation (σg)
     
The concentration of bacterial particles is high in the size range (2.1-4.7 µm) with the highest value at the size 2.1 µm (stage 4) in the kitchen at both periods.
In the afternoon, the concentration of bacteria turns to increase at the size 7.0 µm.
In restaurant, the bacterial concentration is high at the size 1.1 µm and the size range (3.3-7.0 µm) at both period with the highest value at size 1.1 µm (stage 5) in the morning and shifts to a large size 4.7 µm (stage 2) in the afternoon.
In general, the indoor bacterial concentration (in kitchen and restaurant) measured in the afternoon is higher than measured in the morning. This may be attributed to the higher human activity during the afternoon.
Humans are the common source of bacteria in indoor environment [5, 20].
Outdoor concentration of bacteria is high at the size range (0.65-1.1 µm) and size range (3.3-4.7 µm) with the highest value at size 4.7 µm (stage 2) in the morning period. While the highest concentration of bacteria was found in the size 1.1 µm (stage 5) in the afternoon period.
The maximum median aerodynamic diameter, MAD (2.8 µm) was found in the kitchen with a minimum geometric standard deviation, σg (1.9) during the morning period while the maximum MAD (3.1 µm) was found in the restaurant with a σg of 2.1. The minimum MAD (2.2 and 1.8 µm) were found in outdoor during the morning and afternoon times, respectively. The aerodynamic diameters of bacterial particles increased with occupancy [32, 33].
Size distribution of fungi sampled in the kitchen, restaurant and outdoor in the morning and afternoon are shown in figures 3 and 4. The size distribution parameters; median aerodynamic diameter (MAD) and geometric standard deviation (σg), are summarized in table 7.
Figure 3. Indoor and outdoor size distribution of fungi sampled in the morning
Figure 4. Indoor and outdoor size distribution of fungi sampled in the afternoon
Table 7. Size Distribution Parameters of Fungal Particles: Median Aerodynamic Diameter (MAD) and Geometric Standard Deviation (σg)
     
The concentration of fungal particles sampled in the kitchen is high at the size range (2.1-3.3 µm) in the morning with the highest concentration at size 2.1 µm (stage 4) in both periods. In restaurant, fungal particles have the same size distribution in the morning and afternoon. The highest particle concentration was found at the size 2.1 µm (stage 4) in both periods.
There is also no significant difference between the size distribution of fungi in outdoor measured during the morning and afternoon periods. The highest concentration of fungi was found at the size 2.1 µm (stage 4). These results agree with my previous study [34] and other study [35].
The size distribution parameters of fungal particles are similar in the morning and afternoon times where the maximum MAD (2.7 µm) was found in outdoor at the two periods with nearly the same geometric standard deviation. The difference in aerodynamic particle diameters between different sites may be due to the differences in the number of occupants, human activities and ventilation [35, 36]. Other physical factors such as wind speed and forces, including drag force, gravity and Brownian diffusion [37], affect the dispersion and movement of biological particles. Most biological particles with large size are deposited after 12 hours post emission to the atmosphere under the effect of the gravitational forces [38].
It is worth mentioning that the present results reveal of most microbes concentration (bacteria and fungi) are in the size of respirable range (< 5.0 µm). During inhalation, these fine particles inter the lung and can reach to the deep parts and alveoli causing lung diseases [4, 39].

4. Conclusions

Concentration and size distribution of bacteria and fungi were evaluated in indoor and outdoor environments. The mean indoor bacterial concentration was higher than the mean indoor fungal concentration at all measured conditions. In outdoor, the concentration of fungi was higher than bacterial concentration. Concentrations were high for fine particles. Temperature and relative humidity contribute other factors, such as occupancy density and activity, the effect on the biological particle concentration. Occupancy impacts the indoor air quality.

ACKNOWLEDGEMENTS

I would like to introduce my deep thanks to Prof. Dr. Werner Hofmann, Department of Chemistry and Physics of Materials, University of Salzburg, Salzburg, Austria, for his support to perform this work.

References

[1]  U. Undochukwu, J. Inetianbor, F.O. Omorotionmwan, N.S. Okpuruka, Effects of high customer patronage on the indoor air quality of restaurants in Lokoja Metropolis and its public health impact, Am. J. of Microbiol. Res. 4 (2016) 51-55.
[2]  J. Manisha, R.K. Srivastava, Identification of indoor airborn microorganisms in residential rural houses of Uttarakhand, India, Int. J. Curr. Microbiol. App. Sci. 2 (2013) 146-152.
[3]  G. Bipasha, L. Himanshu, K. Rajesh, H. Naba, S. Arun, K.J. Vinod, Estimation of bioaerosol in indoor environment in the university library of Delhi, Sustain. Environ Res. 23 (2013)199-207.
[4]  S.P. Jozef, U. Kyaw Tha Paw, O.L. Danuta, W. Agnieszka, U. Krzysztof, Bacterial and fungal aerosols in indoor environment in upper Silesia, Poland, Atmos. Environ. 34 (2000) 3833-3842.
[5]  S. Teresa, M.G.M. Rosa, F. Alejandro, V.S. Jeronima, C. Jose, G. Mariano, Indoor airborne microbial load in Spanish university (University of Murcia, Span), Anales de Biologia, 31 (2009) 109-115.
[6]  L. Ulla, M. Teija, P. Tuula, et al., Microbial exposure symptoms and inflammatory mediators in nasal lavage fluid of kitchen and critical personnel in schools, Int. J. Occup. Med. Environ. Health, 18 (2005) 139-150.
[7]  E. Scott, Relationship between cross-contamination and the transmission of foodborne pathogen in the homes, Pediatr. Infect. Dis. J. 19 (2000) S111-S113.
[8]  K. Mattick, K. Durham, M. Hendrix, et al., The microbiological quality of washing-up water and the environment in domestic and commercial kitchens, J. Appl. Microbiol. 94 (2003) 842-848.
[9]  A. Medrano-Felix, C. Martinez, N. Castro-del Campo, et al., Impact of Prescribed cleaning and disinfectant use on microbial contamination in the home, J. Appl. Microbiol. 110 (2011) 463-471.
[10]  N. Kalogerakis, D. Paschali, V, Lekaditis, et al., Indoor air quality-bioaerosl measurements in domestic and office premises, J. Aerosol Sci. 36 (2005) 751-761.
[11]  P.N. Pegas, G. Evtyugina, C.A. Alves, et al., Outdoor/indoor air quality in primary schools in Lisbon: A preliminary study, Quim. Nova. 33 (2010) 1145-1149.
[12]  H. Aydogdu, A. Asan, O. M. Tatman, Indoor and outdoor airborne bacteria in child day – care centers in Edirn city (Turky), seasonal distribution and influence of 53-66.
[13]  G. Armadans, V. Rodriguez-Garrido, M. Gil-Cuesta, et al., Particle counting and microbiological air sampling: results of the simultaneous use of both procedures in different types of hospital rooms, Enferm. Infecc. Microbiol. Clin. 31 (2013) 217-221.
[14]  M.H. Seyed, N. Mahnaz, S. Kazuo, et al., Assessment of airborne particles in indoor environments: Applicability of particle counting for prediction of bioaerosol concentrations, Aerosol and air qual. Res. 16 (2016) 1910-2016.
[15]  Q. Hospodsky, D.J. Nazaroff, W. Yamamoto, et al., Human occupancy as a source of indoor airborne bacteria, Plosone 7 (2012) e34867.
[16]  M.P. Buttner, L.D. Stetsenbach, Monitoring of airborne fungal spores in an experimental indoor environment to evaluate sampling methods and the effects of human activity on air sampling, Appl. Environ. Microbiol. 59 (1993) 219-226.
[17]  W. Jones, K. Morring, P. Morey, et al., Evaluation of the Andersen viable impactor for single samling, Am. Ind. Hyg.Ass. J. 46 (1985) 294-298.
[18]  C.F. Green, P.V. Scarpino, The use of ultraviolet germicidal irradiation (UVGI) in disinfection of airborne bacteria, Environ. Engineer Policy. 3 (2002) 101-107.
[19]  E.F. Gilberto, T.B. Scott, J.G. Caporaso, et al., Diversity, distribution and sources of bacteria in residential kitchens, Environ. Microbiol. 15 (2013) 588-596.
[20]  S. Chunxiao, L. Josephine, Y. fang, A case study of upper-room UVGI in densely-occupied elementary classrooms by real-time fluorescent bioaerosol measurements, Int. J. environ. Res. Public Health. 14 (2017) 51-63.
[21]  M. Frankel, G. Beko, M. Timm, et al., Seasonal variations of indoormicrobial exposures and their relation to temperature, relative humidity, and air exchange rate, Appl. Environ. Microbiol. 78 (2012) 8289-8297.
[22]  J. Zhau, W. Fang, Q. Cao, et al., Influence of moisturizer and relative humidity on human emissions of fluorescent biological aerosol particles, Indoor air. 27 (2017) 587-598.
[23]  A. K. Jain, Survey of bioaerosol in different indoor working environments in central India, Aerobiologia. 16 (2000) 221-225.
[24]  L. Chih-Shan, H. Po-An, Bioaerosol characteristics in hospital clean rooms, The Sci. Tot. Environ. 305 (2003) 169-176.
[25]  T. Soto, M. Lozano, J. Vicente-Soler, et al., Microbiological survey of the aerial contamination in urban areas of the city of Murcia, Spain, Anales de Biologia. 31 (2009) 7-13.
[26]  J.H. Lee, W.K. Jo, Characteristics of indoor and outdoor bioaerosols at Korean high-rise apartment buildings, Environ. Res. 101(2006) 11-17.
[27]  M. Sibel, A. Munevver, Y.R. Abbas, et al., Bacteria and fungi levels in various indoor and outdoor environments in Ankara, Turkey, Clean. 37 (2009) 487-493.
[28]  World Health Organization, Indoor Air Quality: Biological Contaminants. Copenhagen: WHO Regional Publications, European Series No.31 (1990).
[29]  W.K. Jo, Y.J. Seo, Indoor and outdoor bioaerosol levels at recreation facilities, elementary schools and homes, Chemosphere. 61 (2005) 1570-1579.
[30]  P.A. Scheff, V.K. Paulius, L. Curtis, et al., Indoor air quality in a middle school, Part II: development of emission factors for particulate matter and bioaerosols, Appl. Occup. Environ Hyg. 15 (2000) 835- 842.
[31]  W.C. Hinds, Aerosol Technology, Properties, Behavior, and Measurement of Airborne Particles. 2nd edn. Wiley, New York. 1999.
[32]  A. Fox, W. Harley, C. Feigley, et al., Large particles are responsible for elevated bacterial marker levels in school air upon occupation, J. Environ. Monit. 7 (2005) 450-456.
[33]  D. Hospodsky, N. Yamamoto, W.W. Nazaroff, et al., Characterizing airborne fungal and bacterial concentrations and emission rates in six occupied children's classrooms, Indoor Air. 25 (2015) 641-625.
[34]  M. Moustafa, Concentration and size distribution of biological particles in school classrooms, J. Adv. Phys. 13 (2017) 5085-5091.
[35]  T. Meklin, T. Reponen, M. Toivola, et al., Size distributions of airborne microbes in moisture-damaged and reference school buildings of two construction types, Atmos. Environ. 36 (2002) 6031-6039.
[36]  R.L. Gorny, T. Reponen, S.A. Grinshpun, et al., Source strength of fungal spores aerosolization from moldy building material, Atmos. Environ. 35 (2001) 4853-4862.
[37]  S.C. Christopher, M.W. Christopher, Bioaerosols Handbook, CRC Press. 1995.
[38]  G. Dexing, G. Chunmei, L. Yanju, et al., Study on the concentration and distribution of the airborne bacteria in indoor air in the lecture theaters at Tianjin Chengjian university, China, Proc. Eng. 121 (2015) 33-36.
[39]  J.M. Seltzer, Biologic contaminants, Occup. Med.State of the art review. 10 (1995) 1-25.