O. D. Osahon1, P. O. Ushie2, O. A. Ojo3
1Department of Physics, Faculty of Physical Sciences, University of Benin, Benin City, Nigeria
2Department of Physics, Faculty of Science, Cross River University of Technology, Calabar, Nigeria
3Department of Physics, Faculty of Science, Osun State University, Osogbo, Nigeria
Correspondence to: P. O. Ushie, Department of Physics, Faculty of Science, Cross River University of Technology, Calabar, Nigeria.
| Email: |  |
Copyright © 2017 Scientific & Academic Publishing. All Rights Reserved.
This work is licensed under the Creative Commons Attribution International License (CC BY).
http://creativecommons.org/licenses/by/4.0/

Abstract
The potential health issues relating to cellular or mobile communication transceiver base station antennas (BSAs) and other radio communication facilities emphasize the importance of having an accessible and easy to understand information on electromagnetic (EM) and radiofrequency radiation (RFR) levels in the surrounding environment. In this study, measurement of radiofrequency exposure due to cellular transceiver base station antennas was carried out. Far field measurements of power density and electric field strength were made around selected transceiver base station antennas in selected states South-South Nigeria, with the aid of frequency dependent equipment (CORNET, Electrosmog meter ED78S EMF RF/LF Dual mode model). The peak power density values of 8.411 mW/m2 in Benin, 4.168 mW/m2 in Calabar, 5.520 mW/m2 in Port Harcourt and 12.940 mW/m2 in Yenagoa along the main lobes were observed at 75 and 100 m from the foot of the BTS. These power density values are less than 9000 mW/m2 (9 W/m2) ICNIRP limit for the public exposure but are far above threshold value of 0.1 mW/m2 established by the EU parliament, (1999).
Keywords:
Base Transceiver Station (BTS), GSM, Main lobe, Power Density, Radiofrequency
Cite this paper: O. D. Osahon, P. O. Ushie, O. A. Ojo, Investigation of the Main Lobe Distance of Transmitted Power Density from GSM Transceiver Base Stations in South-South Nigeria, International Journal of Biophysics , Vol. 7 No. 2, 2017, pp. 17-23. doi: 10.5923/j.biophysics.20170702.01.
1. Introduction
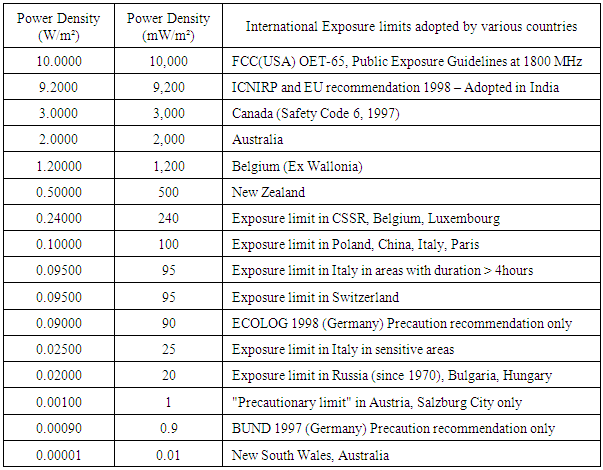
In the last decades, especially in Nigeria the massive proliferation of mobile communications equipment raised a special concern regarding the safety of population exposed to radiofrequency (RF) radiation emitted by either the cellular phone terminals or the Base Transceiver Station (BTS) [2]. Cell phone technology has revolutionized the telecommunication scenario in the world especially developing nations like Nigeria due to its several advantages. The numbers of cell phones of about 1.6 billion [7] and cell towers are increasing without giving due respect to its disadvantages. A number of adverse health effects have been documented at levels below the International Commission for Non-Ionizing Radiation Protection (ICNIRP) guidelines, which include altered white blood cells in children; childhood leukemia; impaired motor function, reaction time, and memory; headaches, dizziness, fatigue, weakness, insomnia etc [13].The total average power radiated, Prad is found by integrating the power flux through the sphere of radius, r around the source. Radiation pattern of antennas has two planes; horizontal and vertical. There is one main lobe and several side lobes. For the main lobe, half-power beam-width (HPBW – defined as angular range over which maximum power decreases to half of its value) in the horizontal direction is 65 degrees and HPBW in the vertical direction is 6 degrees. There are several side lobes, whose maximum levels are about -13 to -20 dB below the main level [5].In Nigeria, we have adopted radiation standards given by ICNIRP guidelines of 1998 for safe power density of f/200, where frequency (f) is in MHz. Hence, for GSM900 transmitting band (935-960 MHz), power density is 4.7 W/m2 = 4700 mW/m2 and for GSM1800 transmitting band (1810-1880 MHz), it is 9.2 W/m2 = 9200 mW/m2. The ICNIRP guidelines clearly state that for simultaneous exposure to multiple frequency fields, the sum of all the radiation must be taken into consideration. However, in Nigeria, we have applied this limit to individual carrier, so the radiation level exceeds by several times than even prescribed by ICNIRP guidelines, depending upon the total number of transmitters in that area. Some of the people (especially older people, house wives, small children) living near the towers are exposed to this radiation 24 hours a day. Unfortunately, ICNIRP (1998) [6] has considered only the thermal effects of radiation, whereas scientist all over the world have found non thermal effects of these radiations to have significant health effects and these non-thermal health effects occurs at levels much below these standards. Bio-Initiative Report in 2007 has been prepared by a group of independent scientists after thorough and very careful survey of the literature and they concluded that the existing standards for public safety are inadequate to protect public health and proposed 1000 μW/m2 = 1 mW/m2 for outdoor, cumulative RF exposure. EU Parliament [12] recommends - 100 μW/m2 = 0.1 mW/m2. The current USA standard for radiation exposure from cell phone towers is 580 - 1,000 μW/cm2, but they are now considering revising the standards. Over 100 Physicians and scientists at Harvard and Boston University Schools of Public Health have called cellular towers a radiation hazard. Thirty three (33) delegate physicians from seven countries have declared cell phone towers a public health emergency [5]. Many countries in the world have adopted much stricter maximum radiation density values of 0.001 - 0.24 W/m2 i.e 1/100th - 1/1000th of ICNIRP guidelines as shown in Table 1. The people in these countries have studied extensively the health hazards of cell tower radiation to adopt stricter radiation standards. Table 1. International Radiation Power Density Limits for GSM1800 [5]
 |
| |
|
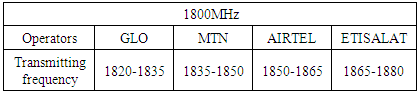
Most cities like Port Harcourt, cell phone towers are mounted on the roof top of residential and commercial buildings. Even though antenna radiates less power vertically down but the distance between the antenna and top floor is usually a few meters, so the radiation level in top floors remain very high. The antennas connected to the base station tend to be mounted high above ground level because the radio signals would be blocked by buildings and other objects if the antennas were nearer the ground. Antennas used with macro cellular base stations are generally placed between 15 and 50 m above ground level because they are designed to provide communications over distances of several kilometers. However, microcellular base stations have their antennas mounted nearer ground level as communications are only carried out over distances of a few hundred meters. Antennas tend to be mounted directly on existing structures, such as buildings, when this is convenient, but ground based lattice towers, shorter masts mounted on roofs, and lamp-post type systems are also used [9].A GSM900 base station antenna transmits in the frequency range of 935 - 960 MHz. This frequency band of 25 MHz is divided into twenty sub-bands of 1.2 MHz, which are allocated to various operators. There may be several carrier frequencies (1 to 5) allotted to one operator with upper limit of 6.2 MHz bandwidth. Each carrier frequency may transmit 10 to 20 W of power. So, one operator may transmit 50 to 100 W of power and there may be 3 - 4 operators on the same roof top or tower, thereby total transmitted power may be 200 to 400 W. In addition, directional antennas are used, which typically may have a gain of around 17 dB, so effectively, several kW of power may be transmitted in the main lobe direction [8]. This can be related to the frequency band under study (1800 MHz) with few differences as shown in Table 2;Table 2. NCC Frequency Spectrum Allocation [1]
 |
| |
|
For time harmonic fields, the time averaging instantaneous power density is;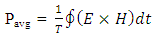 | (1) |
Where,  The instantaneous magnetic field may be rewritten as
 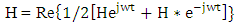 | (2) |
which gives an instantaneous power density of; | (3a) |
 | (3b) |
Where E is the electric field strength, H is the magnetic field strength and ө is the angle between E and H (90° for mutually perpendicular angles).The BTS serving macrocells are either mounted on free-standing towers, typically 10-30 m high, on short towers on top of buildings, or attached to the side of buildings. In a typical arrangement, each tower supports three antennas, each transmitting into a 120° sector.A large proportion of the radiated power antennas are focused into an approximately horizontal beam typically about 6o wide in the vertical direction and the rest goes into a series of weak beams (called side lobes) either side of the main beam. The main beam is tilted slightly downwards but does not reach ground level until the distance from the tower is at least 10 m.The base station antennas transmit appreciably greater power than the phones. The limit to the power is formally set by the need to avoid RF interference and defined by a license issued by the Radio Communications Agency. This does not directly limit the total power emitted but does so indirectly by fixing the maximum intensity that an antenna can transmit into the main beam. This is done by defining the maximum equivalent isotropically radiated power (EIRP) that can be transmitted. The EIRP is the power that would have to be emitted equally in all directions to produce a particular intensity. In fact, as already noted, the antennas used are very far from isotropic, with most of the power being emitted into the main beam, and the ratio of the EIRP to the total power output is called the gain of the antenna. For a 120° sector antenna the gain is usually between about 40 and 60W.Geographically, the study area is the South-South region of Nigeria, comprises the area covered by the natural delta of the Niger River defined by its geology and hydrology. Its approximate northern boundaries are located close to the bifurcation of the Niger River at Aboh, while the western and eastern boundaries are around the Benin River and the Imo River, respectively. The area is approximately 25,900 square kilometers with longitude (5°0′0″E – 9°0′0″E) and latitude (4°0′0″N – 7°0′0″N). It consists of six States; Akwa-Ibom, Bayelsa, Cross River, Delta, Edo, and Rivers. The region is extremely important due to its oil reserves and biological diversity.
2. Materials and Method
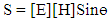
This research involves site specific measurement of power density (up link and down link), electric and magnetic field strength from GSM base stations of selected States in South-South Nigeria. The distance from the foot of the BSA to point of interest (POI) was measured by means of a tape rule (50 m long).A broadband survey Meter (Cornet Electrosmog Radiofrequency Meter) with the following specifications was used to measure the power density, electric and magnetic field strength around the BSA. Model: ED-78S, Frequency range: 100 MHz -8 GHzThe microcell base stations studied cover the four major network provider (MTN, GLO, Airtel and Etisalat) base stations in Nigeria. Selection of base station was done base on transmission frequency (1800 MHz), residential area, office area, open market area and nearness to other radiofrequency antennas (e.g. TV and Radio antennas). Wherever possible, measurements were made in axis that permits measurements in line of sight to the directional antennas or antenna main lobe. The power density at each of the sites in far field was measured at 25 m interval from the foot of the mast at the front direction (main lobe) of the sector antenna (Fig. 1c for typical sectorial antenna) and at about 1.67 m above ground i.e height of an average man. The electrosmog meter was used vertically as recommended in the user’s manual. The readings were taken after every minute of scanning by the equipment at the various points (25 m, 50 m, 75 m, 100 m, 125 m and 150 m) from the foot of the base station. The broadband survey meter is frequency dependent; it therefore provides relatively simple and convenient means for measuring power density in microcell base stations sites where space is limited and in busy towns and city centres where many microcells and Picocells base stations are sited. This data was recorded for sixty (60) base stations in the study area. In far field the only dosimetric/analytical parameter that was considered is power density (flux) in (mW/m2), and distance from BTS foot.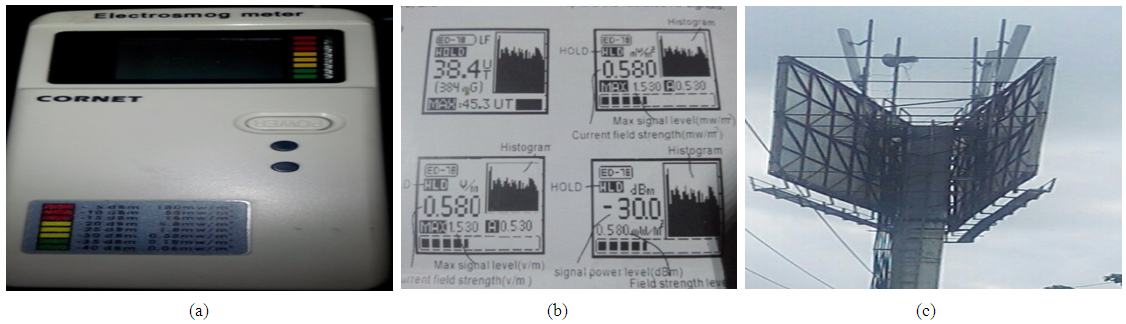 | Figure 1. (a) Electrosmog Meter ED-78S (b) Display mode after survey and (c) A typical BTS in Port Harcourt |
3. Results
In this study, the power density as measured from the various States is presented in Figs. 2(a-d). Also from a known Maxwell’s equation, power density was calculated using measured values of Electric (E) and magnetic (H) fields for comparison as presented in Tables 3-4 and Figs. 3-4.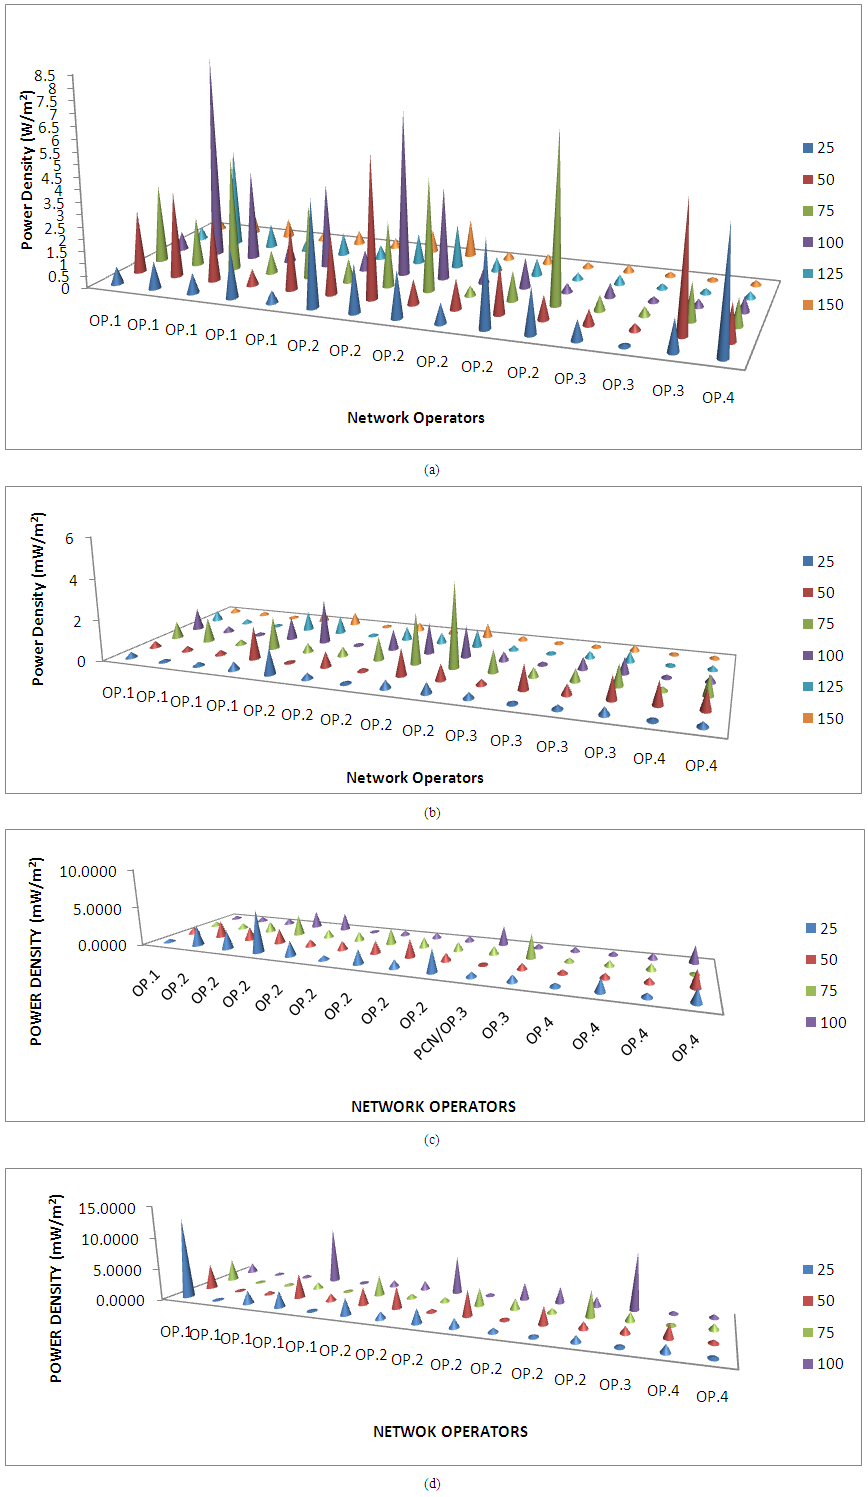 | Figure 2. A 3D Plot of the distribution of power density as measured from selected BTS defined by ICNIRP limit in (a) Benin City (b) Calabar (c) Port Harcourt and (d) Yenagoa |
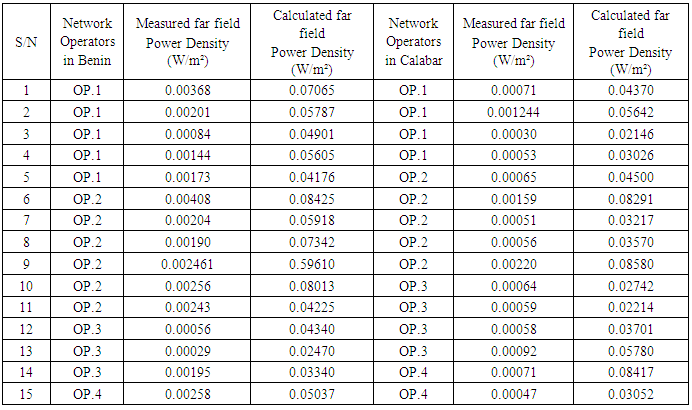
Table 3. The measured and calculated far field power density in Benin City and Calabar
 |
| |
|
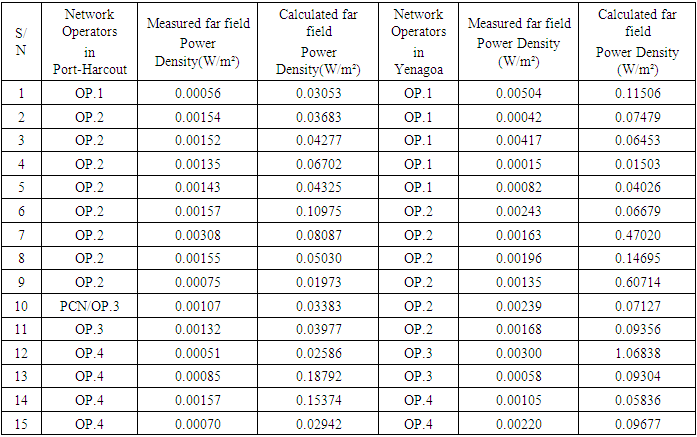
Table 4. The measured and calculated far field power density in Port Harcourt and Yenagoa
 |
| |
|
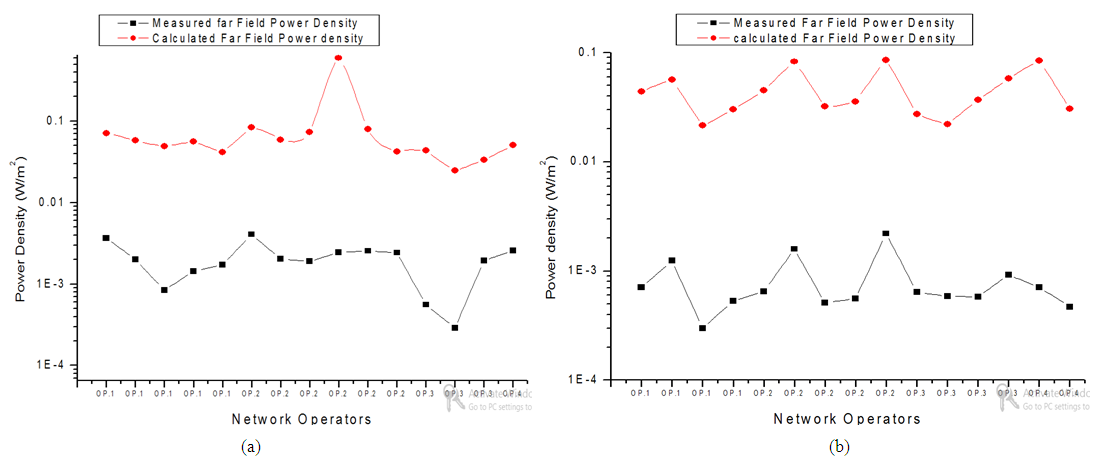 | Figure 4. Measured and Calculated far field power density versus network operators in (a) Benin City and (b) Calabar |
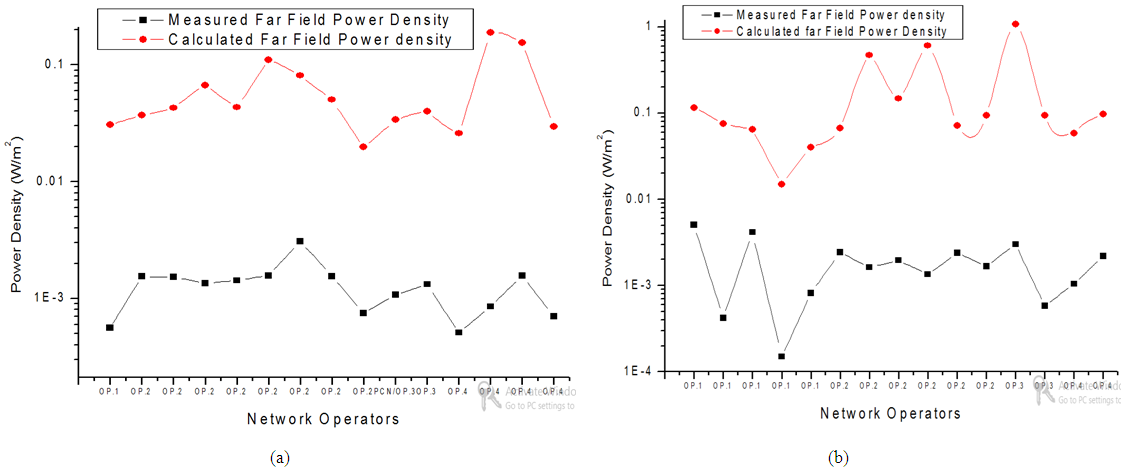 | Figure 5. Measured and calculated far field power density versus Network Operators in (a) Port Harcourt and (b) Yenagoa |
4. Discussion
The results show that the highest observed Power density values are 8.411 mW/m2 in Benin, 4.168 mW/m2 in Calabar, 5.520 mW/m2 in Port Harcourt and 12.940 mW/m2 in Yenagoa, though less than 9000 mW/m2 ICNIRP limit (1998) [6] for the public. However, all the BTS operates far above 0.1 mW/m2 as recommended by the EU (1999) [4]. The maximum values were equally observed between 75 m and 100 m from the foot of the BTS. This indicates that the main lobe of the kind of antenna used in Nigeria (directional antenna) falls at 75 m and 100 m from the antenna base. The peak emission by network operator two (2) at 25 m in Port Harcourt and network operator one (1) at 25 m in Yenagoa is possibly influenced by the distance between the masts. During field survey it was observed that two masts were mounted less than 10 m (few centimeters) from each other. Also, peak emission by operator four (4) at 25 m from the foot of the BTS in Benin could be due to its location in an automobile workshop. That particular mast is sited in an automobile (mechanic) workshop; this is in agreement with literature that RF radiation around metal dump sites generates hot spots [11].Generally, this show at what distance from the BTS the highest field induced effect of power density was observed within the study area.Referring to Eq.(3b), for manual calculation of far field power density from the electric and magnetic field measurement. The far field measured power density and the calculated power density were compared as presented in Figs. 4 and 5. These show good correlation between the far fields measured power density and the calculated far field power density. It further confirms the point of beam fall or maximum lobe from the BTSs since E and H were all measured at the same points and conditions. Though the study specifically looked at distance of beam fall from the foot of the BTS, nevertheless a difference of over 30% was observed between the measured and calculated values of the power density. This might be due to the fact that direct power density values from RF field can be influenced by transmitter power output, AM/FM/TV antennas, wireless Networks etc; but Electric and Magnetic field values that was used to calculate power density can be influenced by different field conditions like EMF created by power Transformers, high Voltage power lines, power generating systems etc. this different field conditions might be responsible for the error observed between measured and calculated power density in the far field.
5. Conclusions
From this study, it could be inferred that outside field influence factors (like BTS distance from each other and nearness to metal dump sites), the maximum values of far field power density were observed at 75 and 100 m from the foot of the BTS. This indicates that the main lobe of the kind of antenna used in Nigeria (directional antenna) falls between 75 m and 100 m from the antenna base, the finding is similar to that of Ronald (2001) [10]. This was further confirm by calculating the power density from known Maxwell’s equation and compared with the measured values which presented good relationship between them (measured and calculated values). This power density observed between 75 and 100 m from a BTS indicate high hot spot of RF radiation, therefore more precautionary measure is advice at such point. Long term exposure at such spots should be monitored more often than other points within the same RF field.
References
| [1] | Ajiboye, Y., Farai, I.P., Ayinmode, B.O. and Alao, O.A. (2014). Hazard estimation from Radiofrequency Radiation in a Nigerian Teaching Hospital from nearby GSM Base-Stations. IOSR Journal of Applied Physics (IOSR-JAP), Vol. 6(5), P. 40-44. |
| [2] | Bergqvist, U., Friedrich, G. and Hamnerius, Y. (2001). Mobile telecommunication base stations exposure to electromagnetic fields, Report of a Short Term Mission within COST. Vol. 22(3), P. 304-315. |
| [3] | Bio-initiative Report (2007). A Rationale for a Biologically-based Public Exposure Standard for Electromagnetic Fields (ELF and RF). P. 610. |
| [4] | EU-Parliament: Council Recommendation of 12 July 1999 on the limitation of exposure of the general public to electromagnetic fields (0 Hz to 300 GHz) 1999/519/EC, Official J. European Communities, Luxembourg, 1999. http://eur-lex.europa.eu/legal-content/EN/TXT/?uri=uriserv%3Ac11545. Retrieved January, 2015. |
| [5] | Girish K. (2010). Report on cell tower radiation, Electrical Engineering Department IIT Bombay, Delhi. India. P. 3-32. |
| [6] | ICNIRP (1998). International Commission on Non-Ionizing Radiation Protection - Guidelines for limiting exposure to time-varying electric, magnetic, and electromagnetic fields (up to 300 GHz), Health Physics. Vol. 74(4), P. 1-32. http://www.icnirp.org/cms/upload/publications/ICNIRPemfgdl.pdf. Retrieved December, 2013. |
| [7] | Joseph, K. (2008). ‘Electromagnetic radiation from mobile phones and their base stations; health effect’. Ghana atomic energy commission. www.gifec.gov.gh/index.php. Retrieved May, 2015. |
| [8] | Kumar, N. and Kumar, G. (2009). Biological effects of cell tower radiation on human body. ISMOT, Delhi, India, P. 678-679. |
| [9] | Mann, S. M., Cooper, T. G., Allen, S. G., Blackwell, R. P., Lowe, A. J. (2000). Exposure to radio waves near mobile phone Base station. Chilton, Dtdcott, P. 9-10. |
| [10] | Ronald, K. (2001). RF and Microwave Radiation Safety Handbook. 225 Wildwood Avenue, Woburn, A division of Reed Educational and Professional Publishing Ltd. P. 56. |
| [11] | Sage Associate and Santa Barbare (2011). Assessment of Radiofrequency microwave Radiation emission from smart meter. CA USA. P. 11. |
| [12] | STOA (Scientific and Technological Option Assessment) (2001). The Physiological and environmental effect of non- ionizing electromagnetic radiation Retrieved June, 2015, from http://www.europarl.europa.eu/stoa/publications/studies/20000703en.pdf. |
| [13] | The INTERPHONE Study Group (2010). Brain tumour risk in relation to mobile telephone use. Results of the INTERPHONE international case-control study. International Journal of Epidemiology, P. 43-66. |

 Abstract
 Reference
 Full-Text PDF
 Full-text HTML