-
Paper Information
- Paper Submission
-
Journal Information
- About This Journal
- Editorial Board
- Current Issue
- Archive
- Author Guidelines
- Contact Us
International Journal of Biophysics
p-ISSN: 2168-4979 e-ISSN: 2168-4987
2012; 2(4): 53-67
doi: 10.5923/j.biophysics.20120204.01
A Comparative Study of the Transmission Parameters of the Sound of Mosquito Predators and EMR
 Abstract
 Reference
 Full-Text PDF
 Full-Text HTML
Mang’are P. A. 1, Maweu O. M. 2, Ndiritu F. G. 3, Vulule J. M. 3
1Physics Department, Egerton University. P. O Box 536, Egerton, Njoro. Kenya
2Physics Department, SEUCO , University of Nairobi. P. O Box 170-90200, Kitui. Kenya
3Entomology Department, Kenya Medical Research Institute Centre for Global Health Research. P. O Box 1578, Kisumu. Kenya
Correspondence to: Mang’are P. A. , Physics Department, Egerton University. P. O Box 536, Egerton, Njoro. Kenya.
| Email: |  |
Copyright © 2012 Scientific & Academic Publishing. All Rights Reserved.
The wide bandwidth EMR ultrasound, exploited in mosquito repellency, yielded only 20 % effectiveness. Due to this wide bandwidth, ultrasound from Amolops tormotus and Coleura afra, mosquito predators, was investigated. The sound was recorded, filtered and anaysed by Avisoft software; transmission parameters determined and compared with those of EMR. Spectrogram analysis showed harmonics, FM and CF components. The fundamental frequency of A. tormotus and C. afra sound was 5.371 kHz and 6.836 kHz respectively. The bandwidth of unfiltered sound of A. tormotus and C. afra was 10.98 kHz and 17.71 kHz respectively. The maximum peak amplitude of unfiltered sound of A. tormotus and C. afra was 135.19 dB SPL and 134.97 dB SPL; maximum acoustic energy was 19.57 Pa2s and 35.80 Pa2s respectively. Maximum acoustic energy of A. tormotus and C. afra sound was 10.843 Pa2s and 14.857 Pa2s recorded in 35-60 kHz and 10-34 kHz ranges respectively. Optimum acoustic parameters included 58.5 kHz peak frequency, 12.32-10.84 Pa2s acoustic energy, 19.40-19.85 kHz bandwidth, 55.13-55.48 kHz and 34.66-44.26 kHz as mean maximum and minimum frequency respectively, 134.08-134.28 dB SPL peak amplitude and 132.06-133.27 dB SPL minimum peak amplitude; bandwidth significantly narrowed from EMR. These parameters are critical in realizing effective EMR.
Keywords: Peak Amplitude, Signal Power, Bandwidth, Malaria, Electronic Mosquito Repellent, Acoustic Energy, Fundamental Frequency
Cite this paper: Mang’are P. A. , Maweu O. M. , Ndiritu F. G. , Vulule J. M. , "A Comparative Study of the Transmission Parameters of the Sound of Mosquito Predators and EMR", International Journal of Biophysics , Vol. 2 No. 4, 2012, pp. 53-67. doi: 10.5923/j.biophysics.20120204.01.
Article Outline
1. Introduction
- The African sheath tailed bat, C. afra belongs to order Chiroptera and inhabit in caves feeding on mosquitoes and other insects. Bats produce sound which fall in the frequency range of 20-100 kHz which is used for communication and navigation purposes[10, 11, 15]. This sound is produced by tongue clicks or vocalization and occurs as paired clicks[27, 29]. Aerially hawking bats emit these ultrasonic probes and detect flying insect prey by the echoes that return from their bodies[23]. The African bat points the sound beam alternately on either side of the target. Ultrasonic signals from bats are categorized as short clicks, frequency swept pulses and constant frequency pulses[9, 21, 29]. The echoes of high intensity ultrasonic pulses are used to locate and track flying prey. Bats sophisticated echolocation enables them distinguish between mosquitoes and other objects[17]. Bat signals are transmitted in the air as vibrations and its pitch is determined by frequency. Echolocating bats produce ultrasonic signals and analyze the returning signal in order to determine the distance from the object, its speed besides identifying the type of object[15]. Bats alternate the production of sound and listening to the incoming sound. Bats change their echolocation based on situation[21]. This approach maximizes their ability to detect mosquitoes and other fast moving insects that serve as food[18].The Chinese frog, A. tormotus belongs to the sub-order neobatrachia of the animal kingdom and produces countless vocalizations calls of ultrasonic frequency components[3]. However, most amphibians do not hear sound whose frequency is greater than 12 kHz. Some frog species have special muscles in the larynx hence produce longer glottal pulses giving time for frequency modulation (FM) of the carrier frequency which is simple. Frame-by-frame video analysis of the frog's calling behaviour has suggested the presence of two pairs of vocal sacs that contributed to the remarkable call-note complexity[6]. The A. tormotus are found in hill streams and the surrounding habitats, and breeds in streams and use ultrasound up to 128 kHz for communication[3, 7, 22, 28]. Ultrasonic communication was observed in the Chinese frog from Huangshan Hot Springs, China and whose males generate diverse bird-like melodic calls[20, 26]. The A. tormotus generated ultrasound could be useful in developing new treatment for hearing loss[26]. They feed on a wide range of terrestrial and aquatic animals of which insects form the greater part[4]. The noise from running water where sound of A. tormotus was recorded was broadband with a peak near 100 Hz decaying by 19 dB at 2 kHz and by 63 dB at 28 kHz. Investigation into sounds of A. tormotus was conducted under dynamic range of 90 dB[19].Ultrasound from male mosquitoes and predators has been exploited as a safe and a possible effective measure to repel female mosquitoes seeking blood meals from humans. Electronic mosquito repellents which imitate the sounds of male mosquitoes, currently in use, produce 38 kHz to repel the female mosquitoes[16]. The African bat, C. afra and the Chinese frog, A. tormotus which are both insectivorous generate ultrasound, inaudible to human ear, through their vocalizations[3, 7]. However, earlier experiments with functioning electronic mosquito repellents mimicking calls from bats and male A. gambiae in the frequency range of 125 Hz to 74.6 kHz showed that 12 out of 15 field experiments yielded higher landing rate on the human bare body parts than the control experiments, translating to 20 % effectiveness, hence, considered insignificant to justify their use[5]. This is due to a wide bandwidth of the sound rendering it less intense and ineffective. Investigation into the startle response of the female A. gambiae to recorded sound of A. tormotus and C. afra, showed that the 35-60 kHz frequency range had optimum startle for both sounds, evoking evasive responses in an average of 46 % and 23 % of the mosquitoes, higher than the reported 20 % effective repulsion of EMR sound[13]. The current study was undertaken to determine acoustic transmission parameters of predator sounds of C. afra and A. tormotus with a view to determine reduction in bandwidth. These parameters included peak frequency, peak amplitude, fundamental frequency of the call, maximum and minimum frequency, bandwidth, acoustic energy and means of the parameters through the automatic parameter or manual measurements for individual sound of the C. afra and the A. tormotus. The results of this study are expected to provide factual ultrasound parameters for designing an effective electronic mosquito repellent.
1.1. Statement of the Problem
- Electronic mosquito repellents (EMR) that mimic ultrasonic calls from bats and male mosquitoes, A. gambiae have been designed and used in startling the female mosquitoes, A. gambiae. Earlier studies showed that the electronic mosquito repellents yielded only 20% significant repulsion on the female A. gambiae, due to a wide bandwidth of the sound rendering it less intense and ineffective. Sounds of A. tormotus and C. afra, showed that the 35-60 kHz frequency range had optimum startle for both sounds, evoking evasive responses in an average of 46 % and 23 % of the mosquitoes, higher than the reported 20 % effective repulsion of EMR. Hence, there was need to determine the optimum transmission parameters of the predator sounds. The bandwidth of predator sounds was also expected to be narrowed, yielding high intensify sound, thus improving on the effectiveness EMR.
1.2. Objectives
1.2.1. General Objective
- To determine and compare the acoustic transmission parameters of the sound of A. tormotus, C. afra and electronic mosquito repellent.
1.2.2. Specific Objectives
- i. To determine the transmission parameters of the sound of A. tormotus.ii. To determine the transmission parameters of the sound of C. afra.iii. To show the difference between the acoustic transmission parameters of the sound of C. afra and A. tormotus with the parameters of EMR sound.
1.3. Justification
- Electronic mosquito repellents which mimic ultrasound from animal species are currently being used to repel mosquitoes. However, these electronic mosquito repellents which generated wide bandwidth sound, yielded only 20% startle response in the female A. gambiae rendering them less effective. The African bat C. afra and the Chinese frog A. tormotus, which predate on mosquitoes generated ultrasound naturally through vocalisation. Investigation into the startle response of the female A. gambiae to recorded sound of A. tormotus and C. afra, showed that the 35-60 kHz frequency range recorded optimum response to both sounds, evoking evasive responses in an average of 46 % and 23 % of the mosquitoes, higher than the reported 20 % effective repulsion of EMR sound. Detection of these sounds effectively startled the female A. gambiae due to natural fear of predation and stress on the nervous system. Therefore, there was need to determine acoustic transmission parameters of the sound of C. afra and A. tormotus; compare with EMR sound. The optimum parameters determined from the current research were critical to electronic mosquito repellents designers since effective devices could be realized. Thus, the results provide an additional tool in mosquito control which is environment friendly.
1.4. Hypotheses
- • The acoustic transmission parameters of the sound of C. afra and A. tormotus did not deviate significantly.• The bandwidth of the sound of C. afra and A. tormotus did not deviate significantly from the mean bandwidth of EMR sound.
2. Materials and Methods
2.1. Materials
2.1.1. Sound of A. tormotus and C. afra
- Sound samples of A. tormotus were recorded individually using the 702 digital recorders from the Huangshan Hot springs, Anhui Province; China at a sampling frequency of 192 kHz and converted to 500 kHz. Also, sound samples of C. afra were recorded from a colony in Kit-Mikayi caves, Kisumu; Kenya using the Avisoft recorder which consisted of the Avisoft Ultrasound Gate (Model 112) individually at a sampling frequency of 500 kHz.
2.1.2. Equipment
- A computer running on Windows XP and office 2007 mounted with a sound card, hardlock key and sound output ports was used together with the Avisoft recorder during the first stage of the study. The Avisoft recorder consisting of the Avisoft Ultrasound Gate (model 112) running on specific software RECORDER USG (rec_usg.exe), ultrasound microphone with high pass filter with cut-off frequency of 10 kHz was used in the recording of ultrasounds from the African bat, C. afra.
2.2. Methods
2.2.1. Recording, Combining and Filtering of Sounds
2.2.1.1. Recording of the Sound of Coleura Afra
- The sound of C. afra was recorded by Avisoft recorder. The condenser microphone capsule (CM16) that consisted of a thin metallized polyester film and a metal black plate was used in the study. The condenser microphone was connected to the Avisoft Ultrasound Gate (model 112) which was then connected to the computer through a USB port. The omnidirectional microphone was set as a default microphone from the voice recording settings in the computer. In the time domain filter, the Finite Impulse Response (FIR) was set to zero for both upper cut-off frequency (fuco= 0 kHz) and lower cut-off frequencies (flco= 0 kHz). Also, the Fast Fourier transform (FFT) was also set to 512 and the Hamming window selected for the display. The temporal resolution overlap was set to 50% with the colour palette set to graypal. The frame size was 100% for real time spectrogram parameters and the black and white box (B/W) display option was checked. The Avisoft-SAS LAB Pro, Version 5.1 software was open and the microphone directed to the source of sound ready for recording. The gain on the Avisoft Ultrasound Gate (model 112) was adjusted to an appropriated level and the recording level in the computer set to 20 dB in order to avoid over modulation. The record button on the Avisoft Ultrasound Gate (model 112) was pressed to start recording of the nine sound samples of C. afra at a sampling frequency of 500 kHz. The sound samples were recorded separately and saved in the hard disc. The sound sample for the study was obtained by appending four quality sound samples and gave a 1754.07 s playback duration and was saved as “Coleura Sample 2.wav” hard disc.
2.2.1.2. Recording of the Sound of A.
- Six sound samples of A. tormotus were recorded individually using the 702 digital recorder from the Huangshan Hot springs, Anhui Province; China at a sampling frequency of 192 kHz. The sound samples were appended in order to increase playback duration using the Avisoft SASLab Pro Version 5.1. The sounds were appended further to increase playback time to 1754.07 s and saved as “A. tormotus.wav” in the hard disc; sampling frequency converted from 192 kHz to 500 kHz using Avisoft SASLab Pro Version 5.1 for compatibility.
2.2.1.3. Filtering of sounds samples
- The high pass filter, band pass filter and low pass filter, inbuilt in the Avisoft SASLab analysis software, were used to segment the appended sounds 10-34 kHz, 35-60 kHz and 61-90 kHz frequency ranges essential for the study. The sound of C. afra and A. tormotus was subjected to a high pass filter at a cut-off frequency fco = 10 kHz in order to attenuate noises and a low pass filter with a cut-off frequency fco = 90 kHz. The sounds were subjected to a band pass filter with an upper cut-off frequency, fuco= 34 kHz and a lower cut-off frequency, flco=10 kHz in order to obtain the 10-34 kHz the frequency range segment. Frequencies below 10 kHz and above 34 kHz were attenuated (amplitude = 0 i.e. off); only allowing 10-34 kHz (amplitude = 1, or on).Similarly, band pass filter with flco= 35 kHz, fuco= 60 kHz and flco= 61 kHz, fuco= 90 kHz settings yielded the 35-60 kHz and 61-90 kHz frequency ranges respectively. These settings were made from the time domain filter (FIR). These sound segments were saved separately in the hard disc.
2.2.2. Determination of Acoustic Transmission Parameters of Predator Sounds
- The spectrogram parameters were set to FFT: 512, Window: Hamming, Frame size: 100% and Overlap: 50% with the sound card sampling frequency of 500 kHz. Also, the sound card was set to 16 bits with a down sampling of 1. The saved predator sounds were analysed using the Avisoft SASLab Pro Version 5.1 and the Batsound software, the later generating power spectrum and oscillograms of the sounds. The parameters which included peak frequency, peak amplitude, fundamental frequency, maximum frequency, minimum frequency, bandwidth, acoustic energy and their means were automatically generated using Avisoft SASLab Pro Version 5.1 software through Fourier transforms. Manual parameter measurement was also employed. In order to generate amplitude and energy, the calibration method was set to SPL with reference sound for Channel 1and at a /gain (dB) set to zero. These settings were made in the Avisoft SASLab software under the tools menu. The acoustic pressure level referenced to 20 µPa, which is the threshold. The acoustic energy whose SI unit is Pa2s is a product of the square of amplitudes by sample time, depending on calibration. The energy generated is the sum of the squared amplitudes multiplied by time. Also, 1 Pascal pressure is equal to SPL of 94 dB. The sound was recorded at 2.5 m away from the sound source, a distance essential in determining the sound power. The data obtained was then transferred into an excel worksheet through copying and pasting of the data. The envelope and pulse detection were set to original waveform and gate function respectively. The predator signal was internally amplified and then externally amplified before getting into the external speakers, placed 5 cm from the cage from side A to enable ordinary moving coil speakers to play them. The amplitude modulation constant of the sound of A. tormotus was set to n = 0.8 i.e. normalize at 80% for the entire duration for the A. tormotus signal. Also, the sound of C. afra was internally amplified by setting the 10-34 kHz to volume = 150 %, 35-60 kHz to volume = 130 % and the 61-90 kHz was set to 600 %.
2.2.3. Statistical Analysis
- The data for the acoustic transmission parameters was automatically generated using the Avisoft SASLab software. The software generated the mean, maximum, minimum, and standard deviation values of the parameters. In order to determine the significance level, the data was subjected to T-test and one way ANOVA test using the SPSS software. The bandwidth (maximum entire) for all sounds under study generated from the Avisoft SASLab were subjected to T-test using SPSS version 16.0 software in which the mean bandwidths (maximum entire) were compared by 77.24 kHz, the mean of the reported bandwidths of EMR. This comparison was determined at a 95 % confidence and the significance level of 0.05 establishing a two-tailed significance.
3. Results and Discussion
3.1. Determination of Transmission Parameters of Unfiltered Sounds of C. afra and A. tormotus
3.1.1. Generation and Modulation of Sounds of C. afra and A. tormotus
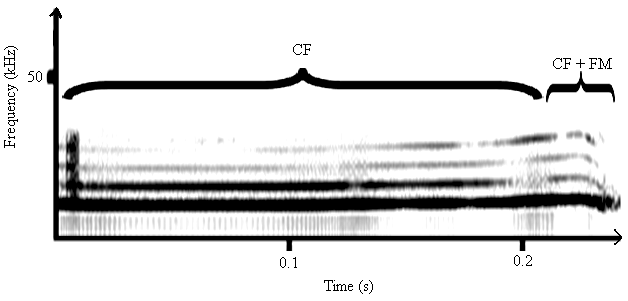
- The spectrograms shown in Fig. 1 and Fig. 2 revealed existence of frequency modulation and constant frequency modulation, labelled as FM and CF respectively. The spectrogram for FM calls showed variation in frequency with time. A varying degree of frequency modulation with abrupt onset and disappearance of harmonic components was noted in all the sounds studied. The frequency modulation for both the short and long duration calls prominently swept downwards and also upwards with no evidence of the carrier frequency in the predator sounds. The bats in the colony generated sound through tongue clicks or vocalization, an observation also reported in recent studies.Generation of sound through tongue clicks or vocalization in bats and A. tormotus had been reported in recent studies[3, 4, 7, 23]. Also, the existence of the FM and CF calls was in agreement with recent findings by[6] and[19]. The FM sound waves were reported to activate the mosquito antennae[14]. The sounds were detected by mosquito antennae and initiated avoidance response[16]. These research results therefore provide proof of the existence of both FM and CF calls in the sound of A. tormotus and C. afra as reported in recent findings[3, 6, 17, 19]. However, the presence of CF modulation had not been reported in the sound of A. tormotus. The ultrasound from both A. tormotus and C. afra are used for communication purposes[3, 7, 10, 15, 17, 22, 28]. The CF components of sound in bat are used for detecting both target velocity and fluttering of target wings as Doppler shifted frequencies and are suited for bats flying in open during hunting. The FM components are suited for close and cluttered environment due to precise target localization[25]. The production of the FM components in A. tormotus was generally described indicating communication as a major use of the ultrasound[6]. The specific use of the FM in A. tormotus had not been reported.
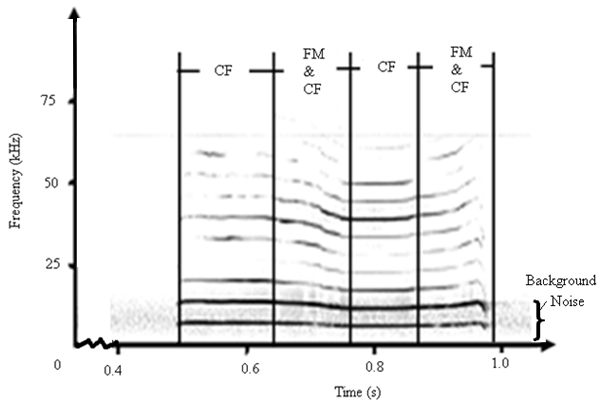 | Figure 1. A sound spectrogram for the appended sound of A. tormotus |
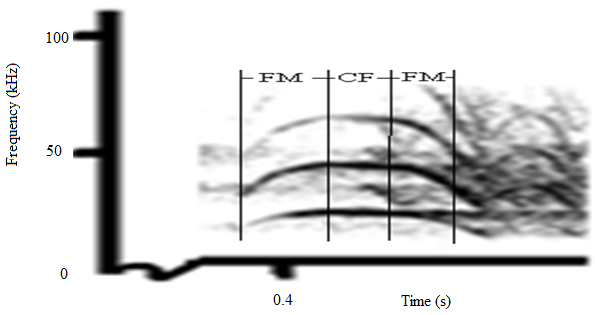 | Figure 2. A section of the spectrogram of sound calls of C. afra |
3.1.2. Acoustic Transmission Parameters for the Unfiltered Original Sounds of C. afra and A.
3.1.2.1. Fundamental Frequency and Harmonics
- The spectrograms in Fig. 3 and Fig. 4 show part of the original and unfiltered appended sound signals of A. tormotus and C. afra respectively, which have been found to be major acoustic features in sound signals[12]. The formants, representing harmonics in the signal of A. tormotus extended from 5.371 kHz to 55.34 kHz, the fundamental frequency being 5.371 kHz as shown in Fig. 6. Such formants which represent harmonics had also been reported in other animal calls[11]. Recent findings by[19] showed distinct formants in the ultrasonic ranges, with harmonics of up to 54 kHz; a deviation of 1.34 kHz from the value determined in this study. The difference in harmonic frequency was attributed to sound quality, analysis system and software difference. The fundamental frequency in the sound of C. afra; shown in Fig. 4, was 6.836 kHz and stretched beyond 68.359 kHz in the ultrasonic range. There were several tone calls of both the sonar and social calls in the recorded sound of C. afra. Similar results, with slight difference had been reported by[19]. There were at least eleven different frequency emissions from the sound of A. tormotus simultaneously, constituting the harmonics. The harmonics of the sounds are multiples of the fundamental frequencies[24]. Ultrasonic and audible sounds had been reported to exist in sounds of A. tormotus and bats[3, 6, 7, 10, 11, 15, 20, 26]. These findings show the existence ultrasonic calls in the sound of African sheath tailed bat, C. afra.
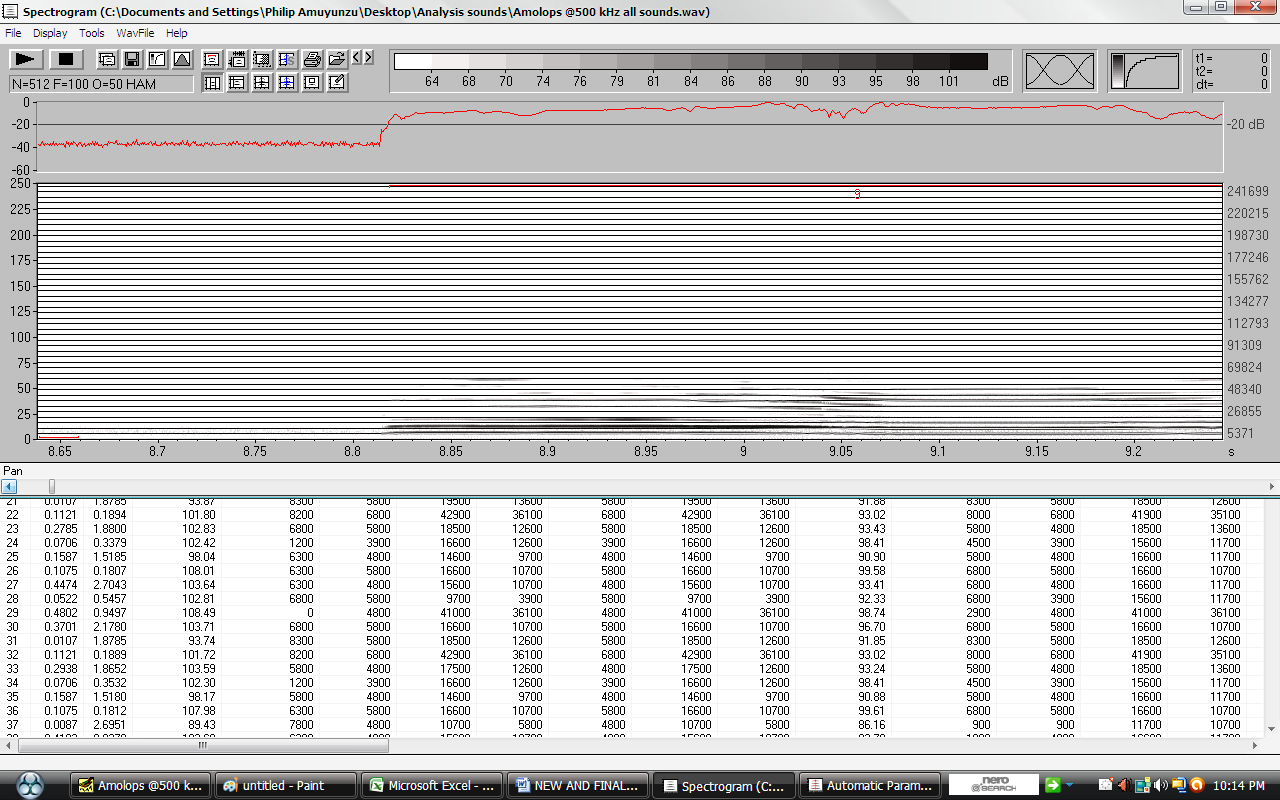 | Figure 3. Harmonics distribution in the original sound signal of A. tormotus |
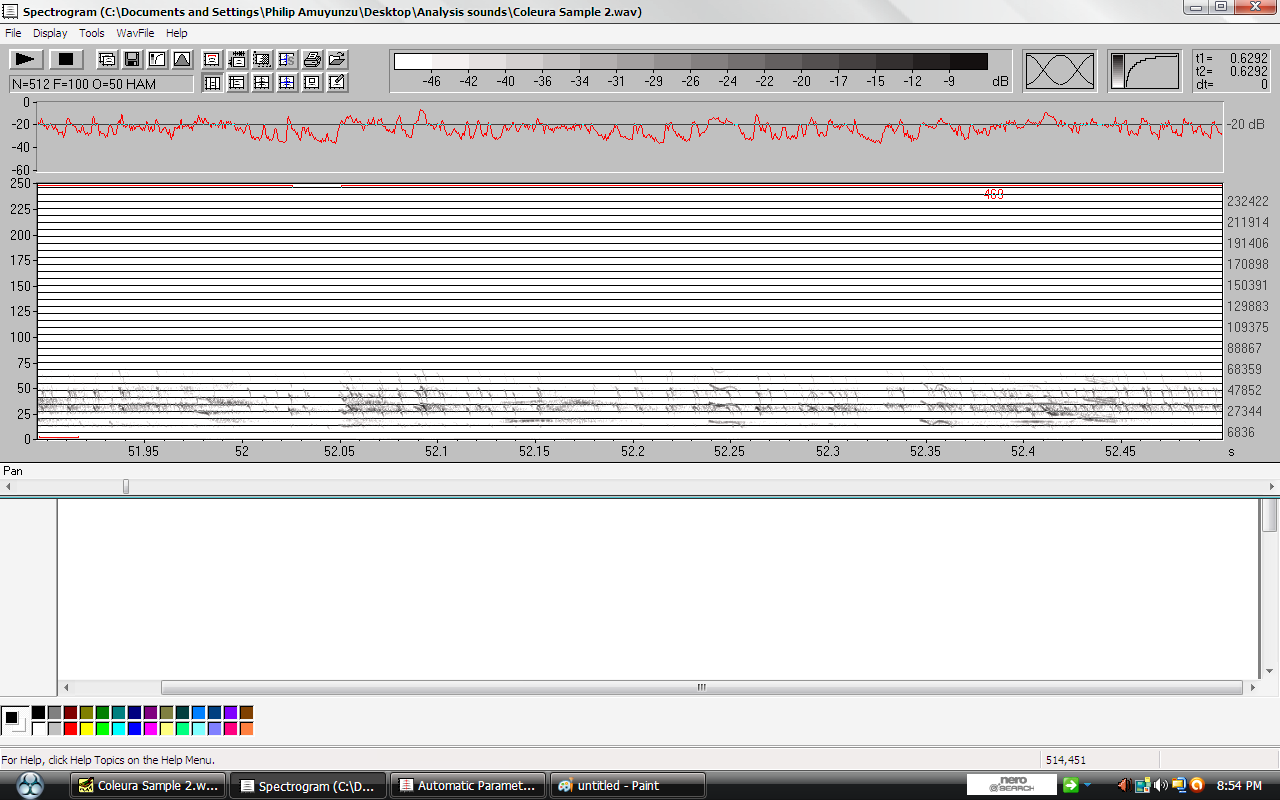 | Figure 4. Harmonics distribution in the original sound signal of C. afra |
3.1.2.2. Minimum Frequency and Maximum Frequency
- The automatically generated minimum frequency for C. afra and A. tormotus were 900 Hz and 3.90 kHz respectively. However, these values differed from the manually determined fundamental frequencies and the previously reported findings[1, 5, 10, 11, 15]. The difference in minimum frequency was due to background noise since the sounds were reported to have been recorded near running water in the streams and wind blowing through the caves for the sounds of A. tormotus and C. afra respectively[3, 7, 22, 28]. The minimum frequency (minimum entire), which is the fundamental frequency, for C. afra and A. tormotus was 6.836 kHz and 5.371 kHz respectively. Similarly, the overall maximum frequency for the sound of C. afra and A. tormotus was 97.60 kHz and 65.40 kHz respectively. The reported EMR sound frequency ranges were 125 Hz to 74.6 kHz and 20 kHz to 100 kHz[1, 5]. The sound of A. tormotus recorded slightly lower minimum frequency (minimum entire), maximum frequency (maximum entire) and mean minimum frequency (minimum entire) than the values in the sound of C. afra. The one-way ANOVA comparison of the maximum frequency (maximum entire) of sound of A. tormotus by the sound of C. afra, shown in Table 1, resulted to significant value, p = 0.537 > 0.05. Similar comparison of the maximum frequency (maximum entire) in the sound of C. afra by that of the sound of A. tormotus resulted to p = 0.748 > 0.05 also shown in Table 1. At 5 % level of significance, there was no evidence to show significant deviation in the maximum frequency (maximum entire) for the sound of A. tormotus and C. afra.
3.1.2.3. Bandwidth
- The mean bandwidth (maximum entire) for the sound of A. tormotus and C. afra are 23.68 kHz and 46.26 kHz respectively. The bandwidth in sounds of A. tormotus and C. afra was narrowed by 53.56 kHz and 30.98 kHz from the reported mean bandwidth of the EMR of 77.24 kHz respectively. The significance values shown in Table 2, which were equal for the bandwidth (maximum entire) of the sound of A. tormotus and C. afra compared by 77.24 kHz on a one-sample T test, was p = 0.000 < 0.05. Similarly, the one-way ANOVA comparison of the bandwidth (maximum entire) of A. tormotus by C. afra, shown in Table 3, resulted to significant value, p = 0.046 < 0.05.
|
|
3.1.2.4. Peak Amplitude
- Acoustic energy, which is a product of the square of the amplitude with time, is determined by amplitude. The maximum peak amplitude (maximum entire) for the sound of A. tormotus and C. afra are 114.91 Pa (135.19 dB SPL) and 112.07 Pa (134.97 dB SPL) respectively referenced to 20 µPa (0 dB SPL). Also, the mean peak amplitude (maximum entire) of A. tormotus and C. afra are and 108.12 Pa (134.66 dB SPL) and 97.37 Pa (133.75 dB SPL) respectively. The one-way ANOVA comparison of peak amplitude (maximum entire) of the sound of C. afra by that of A. tormotus, shown in Table 4, yielded a significance value, p = 0.507 > 0.05; whereas the comparison of peak amplitude (maximum entire) of the sound of A. tormotus by that of C. afra resulted to p = 0.884 > 0.05, as indicated in Table 4.
|
3.1.2.5. Acoustic Energy
|
3.1.2.6. Peak Frequency
- Peak frequencies for the sound of A. tormotus and C. afra were determined through the Avisoft SASLab analysis software provided frequencies for pulses at various amplitudes. Frequency is essential in acoustic energy determination. The maximum peak frequency (maximum entire) for the sound of A. tormotus by C. afra was 40.00 kHz and 41.19 kHz respectively. The one-way ANOVA comparison of the peak frequency (maximum entire) of the sound of C. afra by that of the sound of A. tormotus, shown in Table 6 yielded the significance value, p = 0.067 > 0.05 whereas the comparison of peak frequency (maximum entire) of the sound of A. tormotus by that of the sound of C. afra resulted to p = 0.031< 0.05 as shown in Table 6.
|
3.2. Determination of the Transmission Parameters of Filtered Sounds of C. afra and A.
3.2.1. Generation and Modulation of Sounds of C. afra and A. tormotus
 | Figure 5. The signal spectrogram for the 10-34 kHz band for the sound of A. tormotus |
 | Figure 6. A spectrogram for the sound of C. afra in the frequency range of 10-34 kHz |
3.2.2. Acoustic Transmission Parameters of Filtered Sounds of C. afra and A. in the 10-34 kHz Range
3.2.2.1. Fundamental Frequency and Harmonics
- The fundamental frequency being the lowest frequency sound was determined from the original unfiltered sounds of A. tormotus extended was 5.371 kHz whereas the fundamental frequency of C. afra being 6.836 kHz.
3.2.2.2. Minimum Frequency and Maximum Frequency
- The mean of the maximum frequency (maximum entire) for A. tormotus and C. afra was 22.57 kHz and 33.67 kHz respectively. These frequencies fall in the frequency ranges earlier investigate in EMR. However, the minimum frequencies of predator sounds differed considerably from the investigated and reported minimum frequencies due to the band pass filtration[1, 5, 10, 11, 15]. Similarly, the mean of the minimum frequency (minimum entire) for A. tormotus and C. afra was 10.73 kHz and 14.80 kHz respectively. These frequency values were limited by the band pass filters. The one-way ANOVA comparison of the minimum frequency (minimum entire) of the sound of A. tormotus by that of the sound of C. afra resulted to p = 0.313 > 0.05. Similar comparison of the minimum frequency (minimum entire) in the sound of C. afra by that of the sound of A. tormotus sound resulted to p = 0.634 > 0.05.The comparison of maximum frequency (maximum entire) for the sound of A. tormotus by that of the sound of C. afra resulted to p = 0.563 > 0.05. Similarly, the comparison of the maximum frequency (maximum entire) in the sound of C. afra by that of the sound of A. tormotus resulted to p = 0.494 > 0.05. All the F and p values determined through one-way ANOVA comparison of the minimum frequency (minimum entire) and also maximum frequency (maximum entire) are shown in Table 7.At 5 % level of significance, there was no evidence to show that the minimum frequency (minimum entire) for C. afra sounds in the 10-34 kHz frequency range differed significantly from the minimum frequency (minimum entire) of A. tormotus. Similar results were obtained when the sound of A. tormotus was compared by C. afra. The difference in mean minimum frequency (minimum entire) for the predator sounds was 4.067 kHz, considered highly insignificant. Also, at 5 % level of significance, there was no enough evidence showing that the maximum frequency (maximum entire) in the sound of A. tormotus and C. afra differed significantly high. The maximum frequency (maximum entire) and minimum frequency (minimum entire) for C. afra were slightly higher than those of A. tormotus.
|
3.2.2.3. Bandwidth
- The mean bandwidth for the sound of electronic mosquito repellents was 77.24 kHz[1, 5, 16]. The mean bandwidth (maximum entire) for A. tormotus and C. afra was 10.98 kHz and 17.71 kHz respectively were less compared to the average EMR bandwidth of 77.24 kHz observed by[1, 5]. The bandwidth of the sounds of A. tormotus and C. afra was highly narrowed from the reported mean bandwidth of EMR by 66.26 kHz and 59.53 kHz respectively. The mean bandwidth (maximum entire) for the sound of C. afra and that of the sound of A. tormotus differed by only 6.726 kHz. The significance values for the bandwidth (maximum entire) of the sound of A. tormotus and C. afra compared by 77240 Hz as a test value on one-sample T test were p = 0.000 < 0.05 and p = 0.000 < 0.05 respectively as shown in Table 8.
|
|
3.2.2.4. Peak Amplitude
- The sound of A. tormotus and C. afra yielded a mean peak amplitude (maximum entire) of 103.244 Pa (134.26 dB SPL) and 99.825 Pa (133.96 dB SPL) respectively. The maximum amplitudes for the sound pulses in both predators are illustrated in Fig. 7 and Fig. 8, with amplitudes expressed as percentage, referenced to 0 dB SPL (20 µPa). The maximum peak amplitude (maximum entire) for the sounds of A. tormotus and C. afra was 112.739 Pa (135.02 dB SPL) and 113.129 Pa (135.05 dB SPL). The maximum peak amplitude (maximum entire) for the sounds of A. tormotus was higher in the filtered sound by 2.171 Pa compared to the results for unfiltered sound. However, the maximum amplitude in the sounds of C. afra reduced in the filtered sound. Investigation into insects startle response to ultrasounds of 50±55 dB SPL yielded effective response in beetles[30]. Comparison of the peak amplitude (maximum entire) of the sound of A. tormotus by that of the sound of C. afra yielded significance value as p = 0.398 > 0.05 whereas the comparison of the sound of C. afra by that of the sound of A. tormotus yielded significance value as p = 0.996 > 0.05 respectively as shown in Table 10.
|
 | Figure 7. The sound spectrogram and oscillogram for A. tormotus in the range of 10-34 kHz |
 | Figure 8. The sound oscillogram of C. afra in the 10-34 kHz range |
3.2.2.5. Acoustic Energy and Power
|
 | Figure 9. The power spectrum for the sound signal of C. afra in the range of 10-34 kHz |
 | Figure 10. The power spectrum for the sound of A. tormotus in the 10-34 kHz range |
3.2.2.6. Peak Frequency
- The mean peak frequency (maximum entire) for the sound of A. tormotus and C. afra was 16.18 kHz and 30.846 kHz respectively. The maximum frequency of the signal peaks for all predator sounds was considered. The peak frequency (maximum entire) in the sound of C. afra differed by 14.666 kHz from the peak frequency (maximum entire) of the sound from A. tormotus. The one-way ANOVA comparison of the peak frequency (maximum entire) for the sound of C. afra by that of the sound of A. tormotus at a significance level of 5 % yielded significance value, p = 0.041< 0.05, shown in Table 12.
|
3.3. Acoustic Transmission Parameters of Filtered Sounds of C. afra and A. in the 35-60 kHz Range
- The 35-60 kHz frequency range of the sound of A. tormotus and C. afra had been reported to optimally startle the female A. gambiae mosquitoe, a malaria vector[13]. The ultrasound generated from EMR had also been reported to startle mosquitoes in this frequency range[16].
3.3.1. Fundamental Frequency and Harmonics
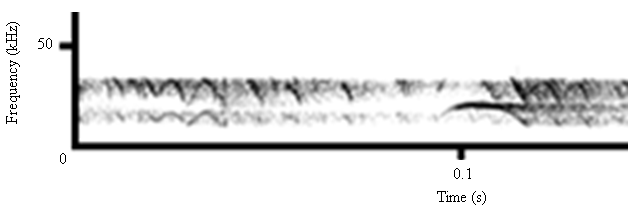
- The fundamental frequency was determined from the original unfiltered sounds of A. tormotus extended was 5.371 kHz whereas the fundamental frequency of C. afra being 6.836 kHz. There existed formants within this frequency range as shown in Fig. 11 and Fig. 12 indicating presence of harmonics which stretched above 50 kHz in the ultrasonic range, as reported in recent findings[11, 19]. Layers of harmonics were observed between 0.1 s to 0.2 s in Fig. 12, which range from 35 kHz up to 50 kHz. However, the calls of C. afra take short duration than those of A. tormotus. The FM calls are pronounced due to changes in frequency. Also, the CF exists in this range for both predator sounds.
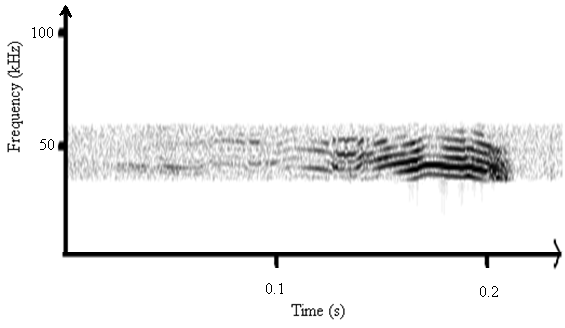 | Figure 11. A spectrogram for the sound of A. tormotus in the range of 35-60 kHz |
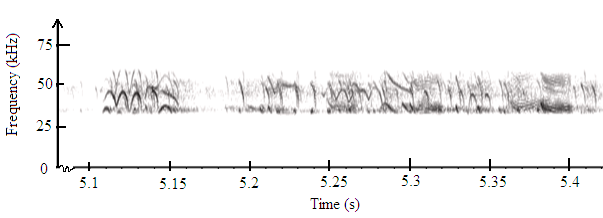 | Figure 12. A spectrogram for the sound of C. afra in the frequency range of 35-60 kHz |
3.3.2. Peak Amplitude
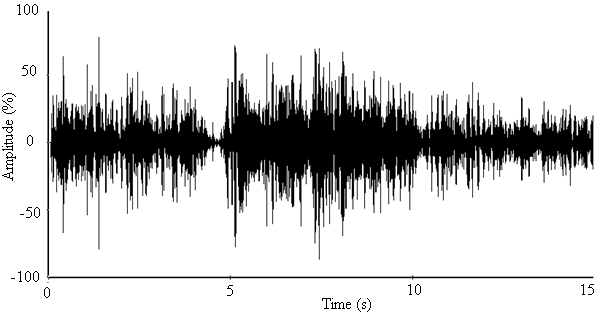
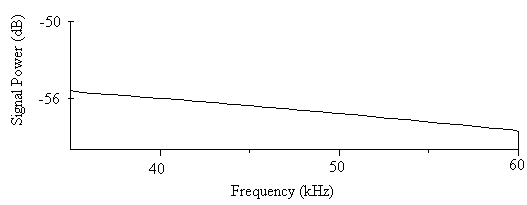
- The oscillograms for the sound signals of the A. tormotus and C. afra are shown in Fig. 13 and Fig. 14 respectively. The mean peak amplitude (maximum entire) for A. tormotus and C. afra was 103.475 Pa (134.28 dB SPL) and 101.141 Pa (134.08 dB SPL) respectively. The peak amplitudes for both sound signals exceeded 50 % of the maximum amplitude at -20 dB threshold as indicated in Fig. 13 and Fig. 14.The minimum peak amplitude (mean) for the entire sound was found to be 80.14 Pa (132.06 dB SPL) and 92.12 Pa (133.27 dB SPL) for the sound of A. tormotus and C. afra respectively. The peak amplitude (maximum entire) and peak amplitude (minimum entire) of the sound of A. tormotus by the sound of C. afra differed by 0.20 dB SPL and 1.21dB SPL respectively. Comparison of the peak amplitude (maximum entire) of the sound of A. tormotus by C. afra yielded significance value as p = 0.904 > 0.05 and the comparison of the sound of C. afra by A. tormotus yielded significance value as p = 0.743 > 0.05 respectively as shown in Table 13.
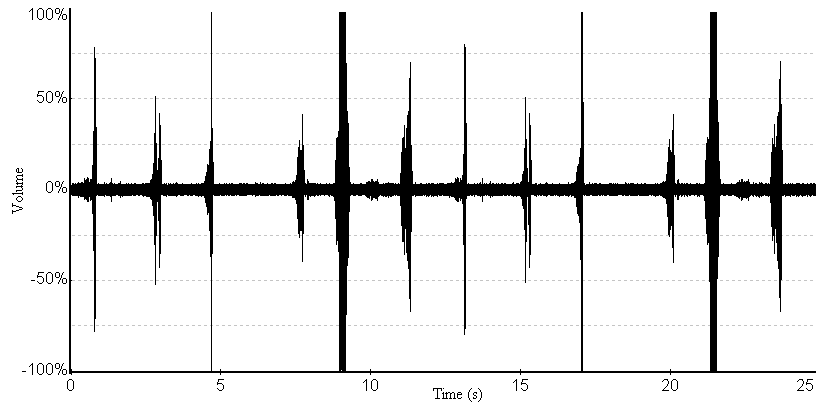 | Figure 13. A section of the sound oscillogram for A. tormotus for the range 35-60 kHz |
 | Figure 14. A section of the sound oscillogram for C. afra for the range 35-60 kHz |
|
3.3.3. Minimum Frequency and Maximum Frequency
- The mean maximum frequency (maximum entire) and mean minimum frequency (minimum entire) for the sound of A. tormotus was 55.1353 kHz and 34.6588 kHz respectively. Similarly, the mean maximum frequency (maximum entire) and the mean minimum frequency (minimum entire) for the sound of C. afra was 55.4766 kHz and 44.2581 kHz respectively. The minimum frequencies (minimum entire) fell slightly outside the 38-44 kHz effective startling frequency range produced by EMR[15]. The mean minimum frequency (minimum entire) and the mean maximum frequency (maximum entire) in the predator sounds differed by 9.5993 kHz and 0.3413 kHz respectively. The one-way ANOVA comparison of the minimum frequency (minimum entire) of A. tormotus sound by the sound of C. afra resulted to p = 0.807 > 0.05. Similar comparison of the minimum frequency (minimum entire) in the sound of C. afra by A. tormotus sound resulted to p = 0.659 > 0.05. The comparison of maximum frequency (maximum entire) for the sound of A. tormotus by C. afra resulted to p = 0.919 > 0.05. Similar comparison of the maximum frequency (maximum entire) in the sound of C. afra by the sound of A. tormotus resulted to p = 0.832 > 0.05. These comparison results are given in Table 14.
|
3.3.4. Bandwidth
- The mean bandwidth (maximum entire) for A. tormotus and C. afra was 19.396 kHz and 19.848 kHz respectively. The mean bandwidth in sound of C. afra exceeded the mean bandwidth of the sound from A. tormotus. The mean bandwidth (maximum entire) deviated in the sounds of C. afra and A. tormotus by 0.4522 kHz. Similarly, the bandwidth (maximum entire) of the predators was highly narrowed from the reported mean bandwidth of EMR sounds.The significance values for the bandwidth (maximum entire) of the sound of A. tormotus and C. afra compared by 77240 Hz as a test value on one-sample T- test were equal to p = 0.000 < 0.05 shown in Table 15. The one-way ANOVA comparison of the bandwidth (maximum entire) of the sound of A. tormotus by C. afra yielded a significance value, p = 0.593 > 0.05 whereas the comparison of the bandwidth (maximum entire) of the sound of C. afra by A. tormotus yielded a significance value, p = 0.570 > 0.05 as indicated in Table 16.
|
|
3.3.5. Acoustic Energy and Power
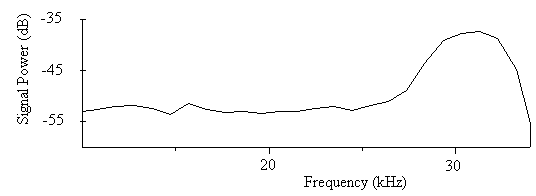
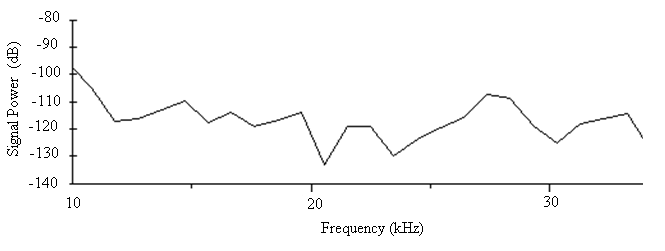
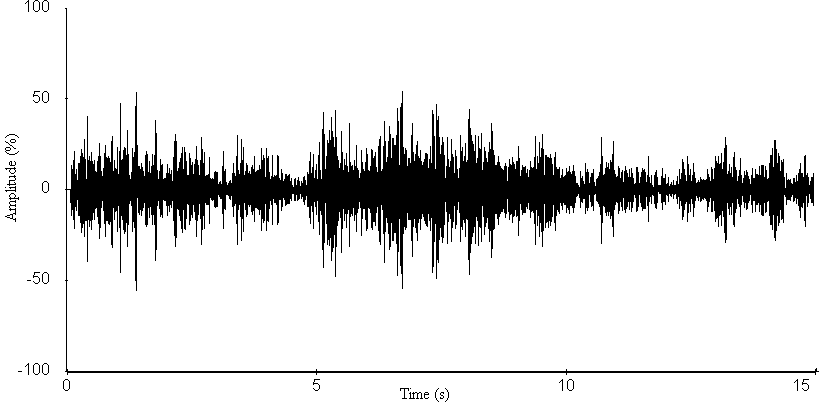
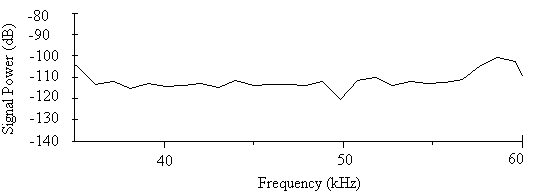
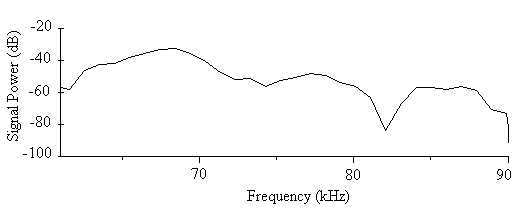
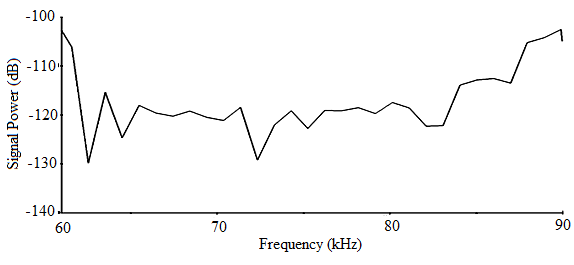
- The minimum total energy for the sound of A. tormotus and C. afra was 0.00521 Pa2s and 0.00033 Pa2s whereas the maximum total energy was 10.8434 Pa2s and 12.3229 Pa2s respectively. Though the greatest energy recorded in this frequency range was from the sound of C. afra, there was a decline in energy recorded in the range of 10-34 kHz. Similarly, the minimum energy was less than that of A. tormotus. The sound of A. tormotus recorded a progressive increase in energy from 8.85674 Pa2s to 10.8434 Pa2s though the minimum energy reduced from 0.01463 Pa2s to the current value. The mean total energy of the sound of A. tormotus and C. afra was 1.3391 Pa2s and 0.0591 Pa2s respectively. The mean acoustic energy for A. tormotus increased by 0.1194 Pa2s whereas that of C. afra reduced by 0.0532 Pa2s from the energy in the 10-34 kHz. The mean and maximum acoustic energy in predator sounds differed by 1.2800 Pa2s and 1.5795 Pa2s respectively.The comparison of the total energy of the sound of A. tormotus by C. afra yielded a significance value as p = 0.934 > 0.05 as indicated in Table 17. Similarly, comparison of the total energy of the sound of C. afra by A. tormotus yielded a significance value as p = 1.000 > 0.05 also shown in Table 17.At 5 % significance level, there was no significance difference in acoustic energy in the two predator sounds.The signal power of A. tormotus fluctuated between -100 dB and -120 dB as shown in Fig. 15. However, it was maintained at -110 dB between 37 kHz and 57 kHz, with a slight dip to -120 dB at the 50 kHz frequency. The signal intensity for A. tormotus in 35-60 kHz was therefore greater than that of the 10-34 kHz frequency range. The signal power for C. afra declined uniformly from -55 dB and -59 dB as indicated in Fig. 16 rendering it weak compared to the constant power of A. tormotus. The sound signal of A. tormotus in the 35-60 kHz was considered to have the greatest intensity compared to that of C. afra in the same frequency range due to the steadiness in signal power.
|
 | Figure 15. The power spectrum for the sound of A. tormotus in the 35-60 kHz range |
 | Figure 16. The power spectrum for the sound of C. afra in the 35-60 kHz range |
3.3.6. Peak Frequency
- The sounds of A. tormotus and C. afra recorded equal maximum peak frequency (maximum entire) of 58.50 kHz. The mean peak frequency (maximum entire) for sounds of A. tormotus and C. afra was 47.626 kHz and 45.923 kHz respectively. The difference in the maximum peak frequency (maximum entire) in the predator sounds was 0.000 kHz whereas the difference in the mean peak frequency was 1.703 kHz. The one-way ANOVA comparison of the peak frequency (maximum entire) for the sound of A. tormotus by the sound of C. afra yielded significance value, p = 0.940 > 0.05 whereas the comparison of by C. afra the sound A. tormotus resulted to p = 0.845 > 0.05 , shown in Table 18. At a statistical significance level of 0.05, the deviation in peak frequency (maximum entire) in the two predator sounds was highly insignificant.
|
3.4. Acoustic Transmission Parameters of Filtered Sounds of C. afra and A. in the 61-90 kHz Range
3.4.1. Peak Amplitude
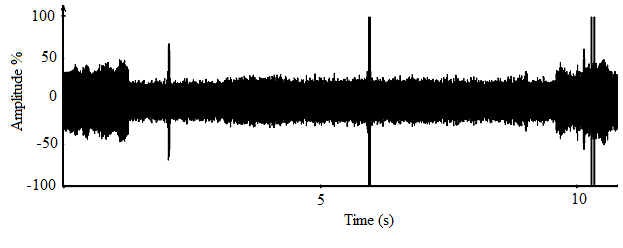
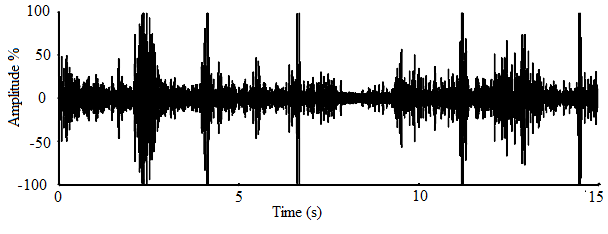
- The oscillograms for calls of A. tormotus and C. afra shown in Fig. 17 and Fig. 18 respectively represent amplitude variation over 11.00 s and 15.00 s duration respectively. Most pulses in A. tormotus and C. afra recorded amplitudes less than 25 % and 50 % respectively referenced to -20 dB in both oscillograms. The amplified mean peak amplitude (maximum entire) for A. tormotus and C. afra was 96.503 Pa (133.67 dB SPL) and 99.07 Pa (133.90 dB SPL) respectively referenced to 0 dB SPL (20µPa). Comparison of peak amplitude (maximum entire) of the sound of A. tormotus by C. afra yielded significance value, p = 0.574 > 0.05 and the comparison of the sound of C. afra by A. tormotus yielded significance value, p = 0.869 > 0.05 respectively as shown in Table 19.
 | Figure 17. A section of the oscillogram for A. tormotus for the range 61-90 kHz |
 | Figure 18. A section of the sound oscillogram for C. afra for the range of 61-90 kHz |
|
3.4.2. Minimum and Maximum Frequency
- The difference in the mean of the maximum frequency (maximum entire) for the sound of A. tormotus from that of the sound of C. afra was 15.473 kHz. Similarly, the difference in the mean of the minimum frequency (minimum entire) in the predator sounds was 0.053 kHz. The mean of the maximum frequency (maximum entire) and mean of the minimum frequency (minimum entire) in this frequency range were above the reported optimal startle range for insects. However, sound in this range had been reported to substantially startle lizards and rats[15].The one-way ANOVA comparison of the minimum frequency (minimum entire) of the sound of C. afra by sound of A. tormotus resulted to p = 0.763 > 0.05. The one-way ANOVA comparison of the minimum frequency (minimum entire) of the sound of A. tormotus by sound of C. afra resulted to p = 0.003 < 0.05. The comparison of maximum frequency (maximum entire) for the sound of A. tormotus by C. afra resulted to p = 0.064 > 0.05 whereas the comparison of maximum frequency (maximum entire) for the sound of C. afra by A. tormotus resulted to p = 0.909 > 0.05. All the F and p values determined through ANOVA comparison are shown in Table 20.
|
3.4.3. Acoustic Energy and Power
- The sound signal of A. tormotus in this range recorded minimum, maximum and mean energy of 0.00044 Pa2s, 7.6989 Pa2s and 0.44193 Pa2s respectively. Similarly, the minimum, maximum and mean energy for C. afra was 0.0002 Pa2s, 5.59491 Pa2s and 0.05331 Pa2s respectively. The difference in mean acoustic energy in the predator sounds was 0.38862 Pa2s, which was significantly high. Similarly, the total maximum energy of the predator sounds differed by 2.4040 Pa2s. The sound signal, being in the ultrasonic range it possessed a lot of energy for both predators[3, 6, 7, 10, 11, 15, 19, 20, 26]. The comparison of the total energy of the sound of A. tormotus by C. afra yielded a significance value, p = 0.001< 0.05 whereas the comparison of the total energy of the sound of C. afra by A. tormotus yielded a significance value, p = 0.000 < 0.05 as indicated in Table 21.
|
 | Figure 19. The power spectrum for sound of C. afra in the 61-90 kHz range |
 | Figure 20. The power spectrum for the sound of A. tormotus in the 61-90 kHz range |
3.4.4. Bandwidth
- There was a mean bandwidth (maximum entire) for the sound of A. tormotus and C. afra of 37.169 kHz and 21.584 kHz respectively, narrower than the reported EMR ranges[1, 5]. The mean bandwidth (maximum entire) in sound of A. tormotus exceeded the mean bandwidth (maximum entire) for the sound from C. afra.The significance values for the bandwidth (maximum entire) of the sound of A. tormotus and C. afra compared by 77.24 kHz as a test value on one-sample T test were both equal to p = 0.000 < 0.05 as shown in Table 22. Similarly, the significance values in the one-way ANOVA comparison of the bandwidth (maximum entire) for the sound of A. tormotus by C. afra; and the sound of C. afra by A. tormotus were both equal to p = 0.000 < 0.05 shown in Table 23.
|
|
3.4.5. Peak Frequency
- The mean of the peak frequency (maximum entire) for the sound of A. tormotus and C. afra are 73.607 kHz and 72.433 kHz respectively. The one-way ANOVA comparison of the peak frequency (maximum entire) for the sound of C. afra by the sound of A. tormotus at a significance level of 5 % yielded significance value, p = 0.909 > 0.05 whereas the comparison of A. tormotus by the sound C. afra resulted to p = 0.064 > 0.05 , shown in Table 24.
|
4. Conclusions
- The predator sounds studied were generated through vocalisation, showed existence of FM and CF components accompanied with harmonics evidenced by formants. The fundamental frequency of unfiltered predator sound of A. tormotus and C. afra was 5.371 kHz and 6.836 kHz respectively. The minimum frequency, peak amplitude, acoustic energy and peak frequency of the unfiltered sound of A. tormotus and C. afra did not differ significantly from each other. However, bandwidth of the sound of A. tormotus and C. afra was 10.98 kHz and 17.71 kHz respectively, significantly narrowed from the bandwidth of EMR sound. The maximum peak amplitude of unfiltered sound of A. tormotus and C. afra was 135.19 dB SPL and 134.97 dB SPL. The maximum acoustic energy of unfiltered sound of A. tormotus and C. afra was 19.57 Pa2s and 35.80 Pa2s respectively. Filtering the sounds lowered the maximum acoustic energy.The acoustic energy of the sound of A. tormotus in the 10-34 kHz, 35-60 kHz and 61-90 kHz frequency range was 8.857 Pa2s, 10.8434 Pa2s and 7.6989 Pa2s respectively which was less than that of the unfiltered sound. Similarly, the acoustic energy of the sound of C. afra in the 10-34 kHz frequency range was 14.857 Pa2s which declined to 5.59491 Pa2s in the 61-90 kHz range. The signal power in 10-34 kHz for the sound of A. tormotus was -100 dB varying to -120 dB and maintaining a steady trend up to the 61-90 kHz frequency range. However, the sound of C. afra recorded the greatest signal power of -35 dB in the 10-34 kHz and declined uniformly to -80 dB in the 61-90 kHz range.The optimum acoustic parameters determined from the 35-60 kHz frequency range of filtered predator sounds were critical in designing effective electronic mosquito repellents (EMR). These optimum parameters determined included 58.5 kHz peak frequency, 12.32-10.84 Pa2s acoustic energy, 19.40-19.85 kHz bandwidth, 55.13-55.48 kHz mean maximum frequency, 34.66-44.26 kHz mean minimum frequency, 134.08-134.28 dB SPL mean peak amplitude, 132.06-133.27 dB SPL minimum peak amplitude with steady signal power between -100 dB to -120 dB. The sounds of C. afra and A. tormotus recorded a narrowed bandwidth hence expected to repel mosquitoes more than the EMR sounds. It is recommended that sound of steady signal power above -55 dB be used in the EMR design to realise optimum repellency of mosquitoes.
ACKNOWLEDGEMENTS
- Special thanks go to Prof. Feng, who donated sound samples for the Amolops tormotus from Illinois University, free of charge and continued to offer technical help on interpretation. May I also extend my special and sincere appreciation to Raimund Specht of Avisoft Bioacoustics; Germany, for donating the ultrasound recording system, sound recording and analysis software which were the backbone of this research work. Raimund offered continued support throughout the research period. His wide experience in acoustics helped me come up with logical deductions. This work would not have been possible without their material and technical support besides availing their honest critique of the work. Many thanks go to Pettersson Elektronik AB and Acoustics; Australia, for donating the Batsound software and microphone essential in generating acoustic parameters. I also thank the Kit-Mikayi staff for allowing me record sound samples of Coleura afra. Many thanks are also extended to Mr. Agwanda of National Museums (Nairobi), head of Mammalogy department for classifying the Microbats in Kit-Mikayi caves.
References
| [1] | Ahmad, A., Subramanyam B. and Zurek, L. Responses of mosquitoes and German cockroaches to ultrasound emitted from a random ultrasonic generating device. Entomologia Experimentalis et Applicata. 123: Pp 25–33. (2007). |
| [2] | Ballou, M.G. Handbook for Sound Engineers. (3rd Edition). Focal Press Publisher, Burlington. Pp 1 – 25. (2002). |
| [3] | Barlow, J. Rare Chinese frogs communicate by means of ultrasonic sound. Inside Illinois. 25: P1. (2006). |
| [4] | Berry, P. Y. The food and feeding habits of the torrent frog, Amolops larutensis. Journal of Zoology. 149: Pp 204–214. (1966). |
| [5] | Enayati, A., Hemingway, J. and Garner, P. Electronic mosquito repellents for preventing mosquito bites and malaria infection. The Cochrane Library Journal . 3: Pp 1-16. (2010). |
| [6] | Feng, A.S., Narins, P.M. and Xu, C.H. Vocal acrobatics in a Chinese frog, Amolops tormotus. Naturwissenshaften Journal. 89: Pp 352 - 356. (2002). |
| [7] | Feng, A.S., Narins, P.M., Xu, C.H., Lin, W.Y., Yu, Z.L., Qiu, Q., Xu, Z.M. and Shen, J.X. Ultrasonic communication in frogs. Nature, International Weekly Journal of Science. 440: Pp 333-336. (2006). |
| [8] | Gupta, M. I. Electronics and radio engineering. J. C. K Apoor Publishers, Delhi. Pp 611- 635. (1989). |
| [9] | Habersetzer, J and Marimuthu, G. Ontogeny of Sounds in the Echolocating bat, Hipposideros speoris. Journal of Comparative Physiology A. 158: Pp 247-257. (1986). |
| [10] | Hoy, R., Nolen, T and Brodfuehrer, P. The neuroethology of acoustic startle and escape in flying insects. The Journal of Experimental Biology. 146: Pp 287-306. (1989). |
| [11] | Khanna, D. R. and Bedi, R.S. (1988). A textbook of sound with theory of oscillations and waves. Atma Ram and Sons, Delhi. Pp 1-231. |
| [12] | Kingston, T., Gareth, J., Zubaid, A. and Kunz, T.H. Alternation of echolocation calls in 5 species of aerial-feeding insectivorous bats from Malaysia. Journal of Mammalogy. 84: Pp 205–215. (2003). |
| [13] | Mang’are, P. A., Maweu, O. M., Ndiritu F. G. and Vulule, J. M. The Startling Effect of the Sound of C. afra and A. tormotus on the Female A. gambiae. International Journal of Biophysics. 2(3). Pp 40-52. (2012). |
| [14] | Maweu, O. M., Deng, A. L. and Muia, L. M. A Comparative study of A. gambiae male mosquito’s response to frequency modulated[FM] and pulse modulated[PM] waves at different acoustic frequencies and distances. Indonesian Journal of Physics. 20: Pp 81-84. (2009). |
| [15] | Miller, L. A. and Surlykke, A. How some insects detect and avoid being eaten by bats: Tactics and counter tactics of prey and predator. Bioscience Journal. 51: Pp 570-581. (2001). |
| [16] | Mohankumar, D. Ultrasound and insects. Electronics and Animal Science. (2010). http://electroschematics.com/. Accessed on 14-June-10 10:00 AM. |
| [17] | Monto, G. Bats. Current Science Journal. 99: Pp 13-14. (2010). |
| [18] | Moss, F.C., Ulanovsky, N., and Yovel, Y. "Zen" bats hit their target by not aiming at it.(2010).http://esciencenews.com/articles/2010/02/04/Zen.bats.hit.their.target.by.not.aiming.at.it. Accessed on 28-May-10 1:00 PM. |
| [19] | Narins, P. M., Feng, A. S., Lin, W., Schnitzler, H., Denzinger, A., Suthers, A. R. and Xu, C. Old World frog and bird vocalizations contain prominent ultrasonic harmonics. J. Acoust. Soc. Am. 115: Pp 910–913. (2004). |
| [20] | Ngo, A., Murphy, R. W., Liu, W., Lathrop, A. and Orlov, W. L. The phylogenetic relationships of the Chinese and Vietnamese waterfall frogs of genus Amolops.Amphibian. Reptilia Journal. 27: Pp 81-92. (2006). |
| [21] | Neuweiler, G., Metzner, W., Heilmann, U., R bsamen, R., Eckrich, M. and Costa, H. H. Foraging Behaviour and Echolocation in the Rufous Horseshoe Bat (Rhinolophus rouxi). Behav. Ecol Sociobiol. 20: Pp 53-67. (1987). |
| [22] | Penna, M. and Rogoberto, S. Frog call intensities and sound propagation in the South American temperate forest region. (1998). http://www.jstor.org. Accessed on 11-July-10 2:00 PM. |
| [23] | Pollack, G. S. and Martins, R. Flight and hearing: ultrasound sensitivity differs between flight-capable and flight-incapable morphs of a wing-dimorphic cricket species. Journal of Experimental Biology. 210: Pp 3160-3164. (2007). |
| [24] | Ramabhadran, S. Electronics Principles and Techniques. S. Chand. Ram Nagar. New Delhi. Pp 496 -504. (1988). |
| [25] | Schuller, G. Hearing characteristics and Doppler shift compensation in South Indian CF-FM bats. Journal of Comparative Physiology. 139: Pp 349-356. (1980). |
| [26] | Shen, J. New progress on acoustic communication in the concave-eared torrent frog and its revelation. Science Foundation In China. 15: Pp 1-3. (2007). |
| [27] | Simmons, J. A., Kick, A. S. and Lawrence, B. D. Echolocation and Hearing in the Mouse-tailed Bat, Rhinopoma hardwickei: Acoustic Evolution of Echolocation in Bats. Journal of Comparative Physiology A. 154: Pp 347-356. (1984). |
| [28] | Steve, C. Chinese frog that squeaks like a mouse. The Independent. (2006).http://nature.net/forums/load/reptiles/msg0312334716764.html?1. Accessed on 25-April-10 11:20 AM. |
| [29] | Surlykke, A., Pedersen, B. S. and Jakobsen, L. Echolocating Bats Emit a Highly Directional Sonar Sound Beam in the Field. Proc. R. Soc. B. 276: Pp 853-860. (2009). http:// rspb.royalsocietypublishing.org Accessed: 28-May-2012 6:45PM |
| [30] | Yager, D. D., Cook, A. P., Pearson, D. L. and Spangler, H. G. A comparative study of ultrasound-triggered behaviour in tiger beetles (Cicindelidae). J. Zool. 251: Pp 1-14. (2000). |
| [31] | Zwiebel, J. L. and Pitts, R. J. Antennal sensilla of two female Anopheline sibling species with differing host ranges. Malaria Journal. 5: Pp 1-12. (2006). |