-
Paper Information
- Previous Paper
- Paper Submission
-
Journal Information
- About This Journal
- Editorial Board
- Current Issue
- Archive
- Author Guidelines
- Contact Us
International Journal of Biophysics
2012; 2(2): 18-25
doi: 10.5923/j.biophysics.20120202.02
Transcriptional Network Structure Assessment Via the Data Processing Inequality
 Abstract
 Reference
 Full-Text PDF
 Full-Text HTML
Enrique Hernández-Lemus1, 2, 3, 4, 3, 5
1Computational Genomics Department, National Institute of Genomic Medicine, México City, 14610, México
2Complexity in Systems Biology, Center for Complexity Sciences, National Autonomous University of M&
3#233
4xico, Mexico City, 04510, M&
5xico
Correspondence to: Enrique Hernández-Lemus, Computational Genomics Department, National Institute of Genomic Medicine, México City, 14610, México.
| Email: |  |
Copyright © 2012 Scientific & Academic Publishing. All Rights Reserved.
Whole genome transcriptional regulation involves an enormous number of physicochemical processes responsible for phenotypic variability and organismal function. The actual mechanisms of regulation are only partially understood. In this sense, an extremely important conundrum is related with the probabilistic inference of gene regulatory networks. A plethora of different methods and algorithms exists. Many of these algorithms are inspired in statistical mechanics and rely on information theoretical grounds. However, an important shortcoming of most of these methods, when it comes to deconvolute the actual, functional structure of gene regulatory networks lies in the presence of indirect interactions. We present a proposal to discover and assess for such indirect interactions within the framework of information theory by means of the data processing inequality. We also present some actual examples of the applicability of the method in several instances in the field of functional genomics.
Keywords: Gene Regulatory Networks, Inference And Assessment, Data Processing Inequality, Information Theory
Article Outline
1. Introduction
- One important problem in contemporary computational biology and biophysics, is that of reconstructing the best possible set of (physicochemical) regulatory interactions between genes (a so called gene regulatory network -GRN) from partial knowledge, as given for example by means of gene expression analysis experiments. This has turned to be so, since most common pathologies are not caused by the mutation of a single gene, rather they are complex diseases that arise due to the dynamic interaction of many genes and environmental factors. In order to perform GRN inference, we need to understand on a quantitative (or, at least, semi-quantitative) level the functional interplay between thousands of genes and their related proteins.Way too many issues arise in the analysis of whole genome gene expression. Current challenges include the nature of the experimental set-ups, since microarray technology generates highly noisy signals. The so-called high dimensionality problem also arise given the fact that there are far more variables involved (number of genes and interactions among them) than experimental samples. Finally, we must deal with a great complexity due the highly nonlinear character of the biochemical dynamics underlying whole genome translation, RNA processing and regulation.Information theory (IT) offers a powerful theoretical foundation, which is useful to develop algorithms and computational techniques able to deal with network inference problems as applied to real data. In the case of inferring physical interactions from correlation measures, IT even provides a useful (but far from trivial!) analogy with thermal systems and statistical mechanics. There are, however open questions and shortcomings related with the application of IT to transcriptional network inference. The applied algorithms should return intelligible models (i.e. they must result understandable); they should also rely on little a priori knowledge. The methods may be able to deal with thousands of variables and detect non-linear dependencies. Currently, all of these features should be accomplished even when we start with tens (or at most few hundreds) of highly noisy samples. There are several alternate ways proposed in the literature in order to accomplish such a task. In our opinion, after having been consider a number of methods[1-3], the best benchmarking options for the GRN inference scenario, are the use of sequential search algorithms[4] (as opposed to stochastic search; that typically involve finding assignment structures for large constrained datasets, hence have a high computational complexity, even NP-hard -exponentially large search-space-) and performance measures based on IT[1, 5 ], since this made feature selection fast end efficient, and also provide an easy means to communicate the results to non-specialists (e.g. molecular biologists, geneticists and physicians)[6,7].
2. The Gene Network Inference Problem
- Information theoretical measures have been applied to infer gene-gene interactions in transcriptional networks[8,9]. In particular, the family of probability measures that includes mutual information, Markov random fields and Kulback- Liebler divergences, has established itself as a sound and robust alternative for this task[1]. However, due to the fact that conditional probabilities obey a tower property (i.e. if X and Y are random variables with compact support on the same probability space (triple), then the expected value of the conditional expected value of X given Y is the same as the expected value of X), a number of false positive links appear (due to the fact that conditional correlations for chains of events obey the tower property), in some instances as a consequence of indirect correlations[10,11]. For instance, if process A has a high value of conditional information (say, mutual information) with process B, and process B is also highly correlated with process C, most common algorithms would predict also a (possibly non- existent) link between processes A and C. One way to assess and correct for these indirect links is -as we will show later- by use of the Data Processing Inequality (DPI) which is a simple but useful theorem that states that no matter what processing you do on some data, you cannot get more information (in the sense of Shannon[10]) out of a set of data than was there to begin with. DPI then provides a bound on how much can be accomplished with signal processing. We will outline an algorithmic implementation of the DPI within the framework of GRN inference and structure assessment and discuss some of its applications in the contemporary molecular biophysics of gene regulation.
2.1. The Joint Probability Distribution Approach (Guilt by Association)
- A growing number of deconvolution methods (also called reverse engineering methods) for the probabilistic inference of gene regulatory networks, have been proposed[2,3]. In general, the goal of such methods is to provide a defined representation of the cellular network topology of the transcriptional interactions as it is revealed by, for instance, gene expression measurements, either by means of whole genome microarray expression data or, more recently by means of RNA-sequencing experiments (RNA-seq) aimed also at determining cellular gene expression patterns. Expression levels are then treated as samples taken from a joint probability distribution. Deconvolution methods look to discover GRNs based on statistical dependence structure within this joint distribution[4]. The central aim is to develop a methodology to decompose the Statistical Dependency Matrix into a series of well defined contributions coming from interactions of several orders of complexity.There are two major challenges related to the feature selection and network inference procedures: i) non-linearity and ii) large number of variables. Information theoretical methods are often efficient techniques to deal with such drawbacks[5-9]. Most of these methods rely on some form of mutual information (MI) metric. MI is a model independent information-theoretic measure of dependency which has been used to define (and also to quantify) relevance, redundancy and interaction in large noisy datasets.If we resort to the standard practice of defining mutual information in terms of information-theoretical entropies (or uncertainties), then for two random variables X and Y, MI can be understood just as the amount of uncertainty in X which is removed by knowing Y, that corresponds with the accepted meaning of mutual information as the amount of information (that is, reduction in uncertainty) that knowing either variable provides about the other[1].In fact, it is easy to see, that the mutual information is just the Kullback-Leibler distance between the joint distribution, PXY(x,y), and the product of the independent –marginal- distributions, PX(x) PY(y), thus, MI is an extended measure of statistical dependency[1]. MI is also able to capture non-linear dependencies[8,9] and it is also rather fast to compute. For such reasons, it can be calculated a high number of times in a still reasonable amount of time, an explicit requirement in whole-genome transcription analysis[9].Deconvolution of a GRN based on maximum entropy optimization of the JPD of gene-gene interactions as given by gene expression experimental data is implemented as follows[9]. The Joint Probability Distribution (JPD) for the stationary expression of all genes
 could be written as follows[8]:
 | (1) |
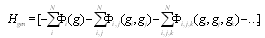 | (2) |
 's are interaction potentials. A set of variables (genes)
  , interacts with each other if and only if the potential
  between such set of variables is non-zero. The relative contribution of
  is taken as proportional to the strength of the interaction between this set.Equation 2 does not define the potentials uniquely, thus, additional constraints should be provided in order to avoid ambiguity. A usual approach to do so is specify
  's using maximum entropy (MaxEnt) approximations consistent with the available information on the system in the form of marginals. In the case of the gene network inference problem, the use of marginals is closely related with a class of methods, commonly termed hidden Markov models (HMMs)[1]. As in the case of HMMs the rationale behind marginals is in recognizing that, eventhough some priors are given, there remains a (probably quite large) set of unknown parameters that may affect the inference process and should be taken into account even if by an indirect treatment. Hidden Markov models and MaxEnt approaches differ in the marginalizing procedure, since in HMMs the hidden states take the place of the unknown variables, whereas in MaxEnt approximations these are marginalized instead. A common way to do so, is by considering that interaction potentials (already marginalized, or to use the language of statistical physics, coarse-grained) are in some sense equivalent to correlation measures. To be more precise; two highly correlated genes (say in their mRNA expression levels) are believed to be physically interacting (by means of some still undisclosed -but probably physically complex-mechanisms) in the transcriptional regulation network[9]. Hence, the interaction potentials
  are approximated by correlation measures, say mutual information, i.e.
  .
.2.2. Direct and Indirect Interactions: How to tell? the Data Processing Inequality
- As stated before, DPI provides a bound on how much can be accomplished with signal processing[11]. More quantitatively speaking, let us consider two random variables,
 and
and  , whose mutual information is
  . Now consider a third random variable,
  , that is a (probabilistic) function of
  only. It can be shown that
  , which in turn implies that
  , as follows from Bayes' theorem.The DPI simply states that
  cannot have more information about
  than
than  has about
  ; that is
  . This inequality, which is a property of 's information, can be proved. The inequality follows because conditioning on an extra variable (in this case
  as well as
  ) can only decrease entropy (in a similar way to what occurs in statistical physics when adding constraints to a thermal system thermodynamic entropy can only decrease, conversely when removing constraints, say by allowing an irreversible process to take place, thermodynamic entropy can only increase), and the second to last equality follows because
  [8,12]. More formally,Definition 1 Three random variables
  ,
,  and
and  are said to form a Markov chain (in that order) denoted
  , if the conditional distribution of
  depends only on
  and is independent of
  . That is, if we know
  , knowing
  does not tell us any more about
  than if we know only
  .If
.If  ,
,  and
and  form a Markov chain, then the Joint Probability Distribution can be written:
 | (3) |
 ,
,  and
and  form a Markov chain, then
  | (4) |
 By the Markov property, since
  and
and  are independent, given
  ,
,  , then, since
  we have:
  c.q.d.In reference[8] the application of DPI has shown that if genes
  and
and  interact only through a third gene,
  within a given GRN; we have that
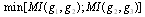 .Hence, the least of the three MIs can come from indirect interactions only so that the proposed algorithm examines each gene triplet for which all three MIs are greater than some threshold value
  and removes the edge with the smallest value. DPI is thus useful to quantify efficiently the dependencies among a large number of genes. The DPI algorithm eliminates those statistical dependencies that might be of an indirect nature, such as between two genes that are separated by intermediate steps in a transcriptional cascade. Such genes will very likely have non-linear correlated expression profiles which may result in in high MI, and otherwise would be selected as candidate interacting genes. In fields such as developmental biology and cancer genetics, there is a growing need to place the vast number of newly identified gene variants into well-ordered genetic and molecular pathways. This will require efficient methods to determine which genes interact directly and indirectly. In this sense a methodology such as DPI-characterization will result extremely useful indeed. For instance, the role of transcriptional cascades in development is becoming evident. Well-known examples may include, the hierarchical interactions underlying hematopoiesis and adipogenesis in vertebrates and the ecdysone and segmentation gene pathways in Drosophila[25]. In such cases, “...gene expression in such cascades is predominantly controlled at the level of transcript initiation, and is based on interactions between sequence-specific transcription factors and their cis-acting response elements.Two types of regulatory relationships, direct and indirect, can be defined. Direct interactions occur independently of intermediary gene regulation but need not involve direct molecular contact between the regulator and its target gene promoter. Indirect interactions require the activation or repression of intermediary genes, the products of which acton the target gene in question....¨[25]. This is precisely the scenario in which a methodology such as DPI-prunning becomes relevant to distinguish between these two different (but often indistinguishable) conditions with aims to discern the actual functional mechanisms behind them. For instance, intron-regulation of transcription has been elucidated. Introns are able to affect gene expression significantly, both in plants and also in many other eukaryotes in a variety of ways. Some introns may contain enhancer elements or other types of promoters, whereas others function by elevating mRNA accumulation by a process called intron-mediated enhancement (IME). The intron-regions causing IME must be inside transcribed sequences near the start of a gene and in their natural orientation in order to increase expression. Detection of IME activity by sequencing is not easy, however by observing DPI-curated networks, we may be able to infer some candidate genes, and perform deeper studies just in this reduced set.
2.3. Sufficient Statistics and Minimal Networks
- The data processing inequality lies also behind some minimal representations. In particular DPI is the foundation behind the idea of sufficient statistics.Definition 2 Suppose that you have observations
 for a random variable
  distributed according to some empirical distribution
  . A statistic
  extracts some of the information in your observed sample
  , by the DPI,
 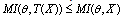 . In the cases in which equality holds, we call
  a sufficient statistic for
  . That is to say, a sufficient statistic for some distribution
  extracts all of the information within your data (samples)
  about the value of
  .
. | (5) |
 and
and  non-negative functions,
  . We call equation 5 a factorization theorem[13] and it is a necessary and sufficient condition for sufficient statistics. If no such factorization exists for
  (in the support under consideration), then
  is not a sufficient statistic (in that support). Factorization theorems are important in minimal network estimation since they provide a somehow independent way of sufficient statistics assessment to DPI inference.With this in mind, we can see that DPI (via the sufficient statistics argument) may be useful to infer Minimal networks, i.e. the smaller GRNs that are able to capture
  -almost all information content of the correlation structure of the actual (larger) biological network.
3. Applications
3.1. Minimal networks
- Definition 3 A minimal network in the context of transcriptional regulation, is the GRN that spans the statistically significant pathways -defined by a threshold in, say, a hypergeometric test of known pathways- with the minimum number of nodes and links. It is thus a concept informally related with network navigability, but instead of being defined by its topology, it refers to biological functional features.Minimal networks are important due to economic, logistical and analytical constraints. Nowadays, it is possible to infer extremely large and comprehensive gene regulatory networks with a certain degree of reliability for a number of cellular conditions. Such networks have been, of course, studied in their global topological features[14] and have been also the object of statistical and data mining analyses to search for biological functions and pathways[15-18]. However, detailed functional studies about the biological behavior of such large GRNs is not plausible neither experimentally nor by means of simulations. For that reason, research in functional genomics in terms of GRNs should be bounded to the minimum sized networks that one can find[9].In order to exemplify the biological relevance of the use of the DPI to find out minimal networks, let us consider the gene regulatory network related with papillary thyroid cancer (PTC-GRN)[9]. In Figure 1 we can see two different instances of PTC-GRN. Panel A displays a GRN with 134 genes and 384 regulatory interactions. DPI was not applied in the inference of this network. Panel B displays the same GRN as panel A, however DPI was applied in this case to prune-off for indirect regulatory interactions. The network in panel B consists in 75 genes and 170 regulatory interactions among them[9].
 | Figure 1. Gene regulatory networks associated with papillary thyroid cancer. Panel A corresponds to a network consisting in 134 genes and 384 interactions as inferred in[9] with no use of the DPI. Panel B corresponds to a network consisting in 75 genes and 170 interactions, panel B is the same network as in panel A except that DPI has been applied to prune-off indirect interactions |
 , whereas the lower FDR-corrected p-value for network B is
  . DPI thus improved p-value performance by almost two orders of magnitude. DPI assessment also prompted new significant biochemical pathways, some of the more important are: urokinase plasminogen activation and the related plasmin synthesis and activation; innate immune system, cell junction organization and HNP1-4/CD4/Defensin signaling.As we can see, global topological features pointing out to greater modularity –hence robustness-; clearer functional mechanisms related to inflammation and growth receptor signaling (two hallmark processes in Cancer); as well as stronger statistics were attained after careful DPI-prunning of the network. This means that, at least in this case DPI methodology presents itself as an efficient tool for the analysis (both functional and modular) of biological networks.
3.2. Master Regulators Discovery: DPI+ non-DPI
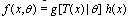
- DPI is also a useful method when looking to discover genes coding for transcription factors that are acting as Master Regulators[19]. Master regulator (MR) genes control a multitude of specific cellular processes and transcriptional regulation of proteins in large complexes in so-called context-dependent manner. Once we located the most highly connected genes -hubs- in this non-DPI pruned network, we proceeded to look up for these genes in a DPI-version of the same network. Transcription factors acting as Master Regulators (i.e. TFs that are at the top of the transcriptional cascade) are known to display many indirect correlations with other genes. For instance, if a Master Regulator (say gene A) is a TF for another gene (B) that in turn is a TF for a third gene (C); non-DPI network will display a link between A and C whereas DPI-network will not. By analyzing both versions of a network alongside with topological parameters such as connectivity degree distributions, it is possible to look up for genes that may be Master Regulators.If we refer to Figure 2 (which displays a non-DPI version of the GRN for the root of Arabidopsis thaliana) in panel A we can see a non-DPI pruned version of the complete transcriptional regulatory network, whereas in panel B we can observe a zoom-in rendering of a small region of the network in panel A in which bigger red genes are highly connected while smaller green ones have lesser number of connections.
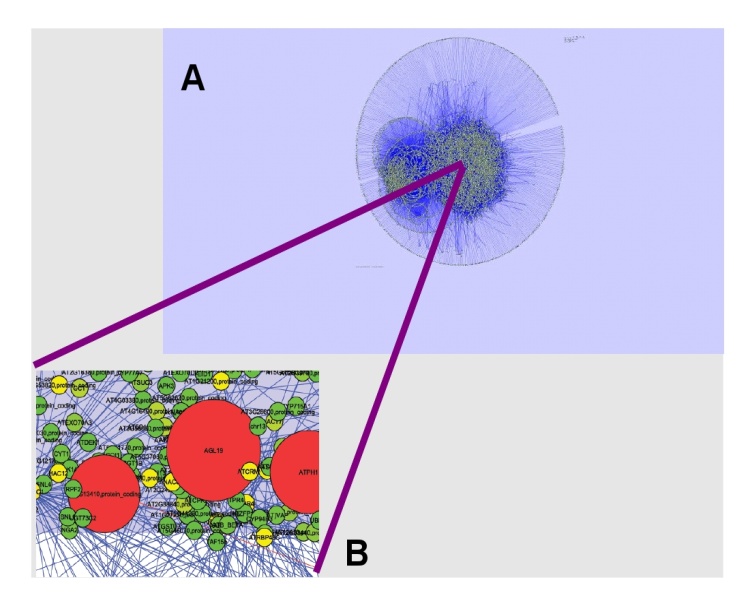 | Figure 2. Gene regulatory network in Arabidopsis thaliana. Panel A displays the complete transcriptional network for the root of Arabidopsis thaliana with no-DPI implemented. Panel B shows a zoom-in of a small region of that network displaying genes color-coded and size coded according to their connectivity degree. Bigger red genes are highly connected while smaller green ones have lesser number of connections |
3.3. Transcription Factor Interactions in Large Networks
- Given a transcription factor, application of the DPI will generate predictions about other genes that may be its direct transcriptional targets or its upstream transcriptional regulators[22,23]. The use of the DPI may result not only in a greater assessment of the results but also in a significant reduction of the computational burden associated with network inference. Zola, et al.[24] presented a parallel method integrating mutual information, data processing inequality, and statistical testing to detect significant dependencies between genes, and efficiently exploit parallelism inherent in such computations. They developed a method to carry out permutation testing for assessing statistical significance of interactions, while reducing its computational complexity by a factor of
 , where
  is the number of genes. The problem of inference (usually consuming thousand of computation hours) at the whole genome network level by constructing a 15,222 gene network of the plant Arabidopsis thaliana from 3,137 microarray experiments in 30 minutes on a 2,048-CPU IBM Blue Gene/L, and in 2 hours and 25 minutes on a 8-node Cell blade cluster[24].
4. Conclusions and Perspectives
- In this work we have shown the relevance of the use of a theorem form information theory, the data processing inequality (Theorem 1) in the context of primary assessment of gene regulatory networks. Due to the many challenges – both, experimental and computational- involved in whole genome gene regulatory networks. Assessment methods and validation procedures are required steps in any GRN analysis. Machine learning and statistical bootstrapping techniques are commonly used, as is Montecarlo modeling and Expectation-Maximization algorithms. However, all these methods validate all genes treating them in an equivalent way, without taking into account a priori information about their function or their role in network topology.In contrast, we are presenting an alternative (and additional) validation tool developed in information theoretical grounds and based in the tenets of signal analysis. DPI is one of several probability bounds on the limits in signal processing. As such it applies equally to artificial signal processing as well as to, for instance biosignals. The mathematical applicability requirements are extremely general (integrability, compact support, etc.) and are thus, almost always met in biological data such as, for instance, gene expression experiments.If we consider whole genome gene expression patterns as signals (as we do when we reverse-engineer GRNs from expression data), then DPI states a bound on the mutual information measures between two genes. In this way, DPI enables us to distinguish -with a certain inference error- between direct and indirect transcriptional interactions (or more properly between highly correlated and correlated sets of gene expression measurements). As we have just stated, this distinction happens to be quite an important one in functional genomics studies.As we have shown, DPI is useful in many instances in the field of GRN inference and analysis as it can be applied to large as well as to small and medium sized networks. We also show its applicability in three different problems. Modularity studies in small sized networks via sufficient statistics, as well as master regulator search and transcription factor interactions in large networks.These are just a handful of examples amidst the broad variety of situations in which the application of so simple an idea as DPI uncovers interesting network properties or helps to assess the validity of the inferred regulatory interactions. If applied with a completely stringent threshold, DPI may render an originally cycle-containing graph into a DAG thus making possible to compare the results of probabilistic models based on Bayesian networks with others inferred by means of information theory or non-Bayesian statistics. Bayesian networks are extremely important tools to evaluate regressive models, often useful in clinical settings. For this very reason, having a computational tool that allows comparison with such Bayesian models results important. Even in those cases in which DPI-asymptotics render incomplete information about the original networks, we can still reach approximate conclusions about the underlying systems.DPI may also become important when analyzing physical interactions such as in protein-protein networks. In such case DPI may provide some bounds on the strength of the interactions. Due to the fact that DPI calculations possess a low algorithmic complexity (i.e. is computationally cheap) it is possible to apply it, in the computational chemistry inference of protein interactions (whose computational burden is high) as some kind of sieve in preliminary results before proceeding to more detailed calculations.In brief, DPI is a useful, easy to implement, computational method for the assessment of the probabilistic inference of complex networks that may become important for the computational analysis of complex biophysical systems.
ACKNOWLEDGEMENTS
- We gratefully acknowledge support by grant:PIUTE10-92 (ICyT-DF)[Contract 281-2010], as well as federal funding from the National Institute of Genomic Medicine (México).We also acknowledge Professor Elena Álvarez-Buylla Roces for access to the transcriptional database for the root of Arabidopsis thaliana.