-
Paper Information
- Paper Submission
-
Journal Information
- About This Journal
- Editorial Board
- Current Issue
- Archive
- Author Guidelines
- Contact Us
American Journal of Bioinformatics Research
p-ISSN: 2167-6992 e-ISSN: 2167-6976
2024; 13(1): 1-7
doi:10.5923/j.bioinformatics.20241301.01
Received: Jan. 18, 2024; Accepted: Jan. 31, 2024; Published: Feb. 22, 2024

SCBAWEB: A Web Application for Basic Analysis of Single Cells (scRNA-seq)
 Abstract
 Reference
 Full-Text PDF
 Full-text HTML
Mohamed Kone, Shulin Wang
College of Computer Science and Electronic Engieering, Hunan University, ChangSha, Hunan Province, China
Correspondence to: Mohamed Kone, College of Computer Science and Electronic Engieering, Hunan University, ChangSha, Hunan Province, China.
| Email: |  |
Copyright © 2024 The Author(s). Published by Scientific & Academic Publishing.
This work is licensed under the Creative Commons Attribution International License (CC BY).
http://creativecommons.org/licenses/by/4.0/

Biology is a dynamic field that constantly requires new tools to advance scientific knowledge. To contribute to this endeavor, We have developed a web application called SCBAWEB, which is capable of analyzing single-cell RNA sequencing (scRNA-seq) data. SCBAWEB aims to simplify the complex process of scRNA-seq data analysis, enabling researchers and biologists to upload, preprocess, reduce, cluster, and analyze their data without requiring in-depth expertise in bioinformatics. ScRNA-seq is a technique that allows scientists to investigate the gene expression and diversity of individual cells, providing an unparalleled resolution for understanding the biology of tissues, organs, and organisms. However, analyzing such complex data can be challenging for researchers who are not specialized in bioinformatics. SCBAWEB addresses this challenge by offering an intuitive and powerful platform for scRNA-seq analysis.
Keywords: Biology, SCBAWEB, scRNA-seq data analysis
Cite this paper: Mohamed Kone, Shulin Wang, SCBAWEB: A Web Application for Basic Analysis of Single Cells (scRNA-seq), American Journal of Bioinformatics Research, Vol. 13 No. 1, 2024, pp. 1-7. doi: 10.5923/j.bioinformatics.20241301.01.
Article Outline
1. Introduction
- How can we uncover the secrets of life at the single-cell level? This is the question that drives the field of single-cell biology, which aims to understand the gene expression and diversity of individual cells within complex biological systems [1]. Single-cell RNA sequencing (scRNA-seq) is a revolutionary technique that enables this goal, by measuring the transcriptome of thousands of cells in parallel [2,3]. However, scRNA-seq data analysis is a challenging task, even for researchers with no bioinformatics skills [4].To overcome this challenge, we develop SCBAWEB, a web application that simplifies and enhances scRNA-seq data analysis. SCBAWEB allows users to upload, preprocess, reduce, cluster, and analyze their data in an intuitive and user-friendly interface, without requiring any prior knowledge of bioinformatics. With SCBAWEB, researchers and biologists can explore the gene expression and diversity of single cells, and gain insights into the biology of tissues, organs, and organisms [5,6].In this article, we describe the key methodology of SCBAWEB, and demonstrate its performance and usability on real scRNA-seq datasets. We show how SCBAWEB can help users to identify and visualize cell clusters, discover differentially expressed genes, and interpret their results in a biological context. We also highlight the advantages of SCBAWEB over existing tools for scRNA-seq data analysis, such as its speed, simplicity, and interactivity [6-9].We conclude by discussing the potential future improvements and extensions of SCBAWEB, to make it a more versatile and comprehensive tool for scRNA-seq data analysis. We envision that SCBAWEB will become a valuable resource for the single-cell biology community, and will facilitate the discovery of new biological phenomena and mechanisms at the single-cell level [6].
2. Methodology
- Key Features of SCBAWEBData Loading: SCBAWEB enables users to seamlessly load their single-cell RNA sequencing (scRNA-seq) data from .mtx files, which are generated by Cell Ranger, a leading software for processing scRNA-seq data [7,10]. These files encompass gene counts for each cell, along with gene and cell names. The application automatically identifies and loads this information into an AnnData object, the data format utilized by Scanpy, a robust Python library for scRNA-seq data analysis [7,11].Data Preprocessing: SCBAWEB automatically performs data preprocessing, which involves cleaning and normalizing the data. This includes:Filtering cells and genes based on quality criteria, such as the minimum number of genes and cells, the total number of counts, and the percentage of mitochondrial counts [7,12,13]. These criteria aid in eliminating noisy or uninformative cells and genes.Annotating mitochondrial genes, which are genes encoded by the mitochondrial genome [14]. These genes are often overrepresented in scRNA-seq data, and can bias the analysis. The application identifies mitochondrial genes based on their name, and marks them in the data.Calculating and visualizing quality metrics, which serve as indicators of the data quality level [15]. These metrics include the number of genes, the number of counts, and the percentage of mitochondrial counts per cell [16]. These metrics are useful for evaluating the effect of filtering and for adjusting the quality thresholds if needed.Dimensionality Reduction: SCBAWEB employs Principal Component Analysis (PCA) and Uniform Manifold Approximation and Projection (UMAP) to reduce the dimensionality of the data [17,18]. Dimensionality reduction is a technique that transforms high-dimensional data (the number of genes) into low-dimensional data (the number of components or coordinates), while preserving as much as possible the structure and variability of the data [7,19,20]. These techniques help to:Reduce noise and redundancy in the data, by eliminating dimensions that do not provide relevant information [17,21].Facilitate data visualization and interpretation, by projecting the data onto a two- or three-dimensional space, which can be represented graphically [7,22,23].Prepare data for clustering, by extracting the essential features that distinguish the cells [24,25]. The application uses PCA to compute the principal components, which are linear combinations of genes that capture the largest share of the variance in the data [26]. The application displays the variance explained by each component, as well as the cumulative variance explained. The application uses UMAP to compute the UMAP coordinates, which are non-linear projections of the data that preserve the local and global structure of the data. The application displays the UMAP coordinates as a scatter plot, which shows the distribution of the cells in the reduced space.Cell Clustering: SCBAWEB uses the Leiden algorithm to cluster the cells into distinct groups based on their similarity [27]. Cell clustering is a technique that partitions the data into homogeneous subsets, which correspond to cell subpopulations. This technique helps to:Identify cell types and subtypes, based on their gene expression profile [28].Characterize cell states and transitions, based on their position in the reduced space [29].Discover genes and pathways involved in biological processes, by comparing the clusters with each other [30]. The application uses the Leiden algorithm, which is a community detection method based on the optimization of the modularity of a graph [31]. The graph is constructed from the reduced data, using the k-nearest neighbors (kNN) method to connect similar cells [32-34]. The Leiden algorithm finds the partition of the graph that maximizes the modularity, which is the density of links within clusters and the sparsity of links between clusters [33,35]. The application displays the clusters as colors on the UMAP scatter plot, which shows the separation of the cells into groups [33].Gene Expression Analysis: SCBAWEB integrates gene expression analysis using the Wilcoxon test, which provides a list of genes differentially expressed between clusters [36,37]. Gene expression analysis is a technique that compares the expression of genes between groups of cells, in order to identify the genes that characterize each group [37-39]. This technique helps to:Validate the clusters, by checking that the differentially expressed genes are consistent with the biological annotations of the cells [4,40]. Explore the functions of the cells, by analyzing the differentially expressed genes using functional annotation tools, such as GO [41] or KEGG [42] term enrichment analysis [40]. Discover new markers, by selecting the differentially expressed genes that are most specific and discriminant for each cluster [40,43].The application uses the Wilcoxon test, which is a non-parametric statistical test that compares the distributions of gene counts between two groups of cells [37,44]. The Wilcoxon test computes a score and a p-value for each gene, which indicate the degree and the significance of the difference between the groups [37]. The application displays the results of the test as tables and plots, which show the most differentially expressed genes for each cluster [37].The SCBAWEB application is developed using the Python programming language [45], renowned for its robust data processing capabilities [46]. The application leverages the Flask framework [47], a lightweight and modular tool for creating web applications in Python [48]. Flask enables the definition of routes, which are functions triggered when a user accesses a specific URL [48,49]. Additionally, Flask supports the use of templates, which are HTML files that can incorporate Python variables and expressions, replaced by their corresponding values when rendering the page [48,50].The application employs the Scanpy library [51], a versatile tool for single-cell RNA sequencing (scRNA-seq) data analysis in Python. Scanpy offers functions to load, preprocess, reduce, cluster, and analyze scRNA-seq data, utilizing AnnData objects [52,53]. These data structures store gene counts, gene and cell names, and annotations of cells and genes [53,54]. Scanpy also provides functions to visualize the data and results, using interactive plots based on the matplotlib library [53,55].The application is structured into three components: index.html, result.html, and app.py. The index.html file contains the HTML code for the application’s home page, displaying a form for the user to input the path of the .mtx file containing the scRNA-seq data to be analysed [48]. The result.html file contains the HTML code for the result page of the application, displaying the success or error message of the analysis, as well as the plots generated by Scanpy [48]. The app.py file contains the Python code for the Flask application, defining the routes for the home page and data processing, and invoking the Scanpy functions to perform the scRNA-seq analysis [48].Comparison with other methods The application, Scanpy, and Seurat are three tools that offer comprehensive workflows for scRNA-seq data analysis, covering steps such as preprocessing, dimensionality reduction, clustering, and differential expression analysis. However, they differ in the specific methods and algorithms they use, as well as in other aspects such as usability, interactivity, scalability, and flexibility. For example, Scanpy and Seurat provide multiple options for dimensionality reduction and clustering, while the application uses a fixed set of methods [56]. The application has an advantage in usability, as it has a user-friendly web interface that allows users to input their data and parameters and receive the results of the analysis, whereas Scanpy and Seurat are libraries that require programming skills in Python and R, respectively [57,58]. The application also offers interactive visualizations that can enhance the user experience and facilitate data exploration, while Scanpy and Seurat have more limited visualization functions [56]. Scanpy, the library that the application is based on, is known for its scalability and can efficiently handle datasets of more than one million cells, which is a crucial factor when dealing with large scRNA-seq datasets [59]. The application, Scanpy, and Seurat all provide a comprehensive workflow for scRNA-seq data analysis, but they may vary in the level of flexibility they offer. For instance, Scanpy and Seurat might allow more customization of the analysis pipeline in terms of the choice of algorithms and parameters, while the application has a more standardized approach [56-58].SCBAWEB and Scanpy
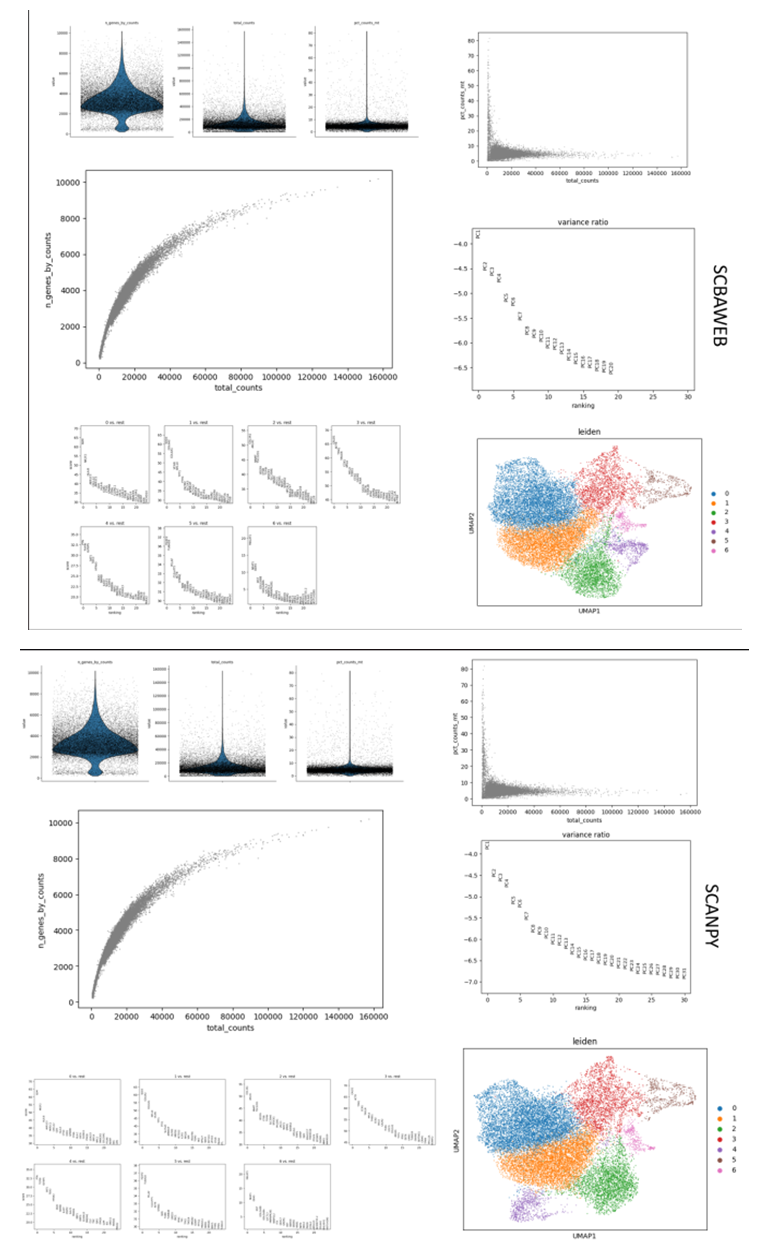 | Figure 1. SCBAWEB draws heavily from Scanpy, exhibiting an impressive similarity of approximately 90% across all stages of the analysis. These stages encompass Data Loading, Visualization of Quality Metrics, Visualization of Scatter Plots, Visualization of the Variance Explained by Principal Components, Visualization of Clusters, and Visualization of Results from Gene Expression Differential Analysis. This high degree of similarity underscores the robustness of our tool, as it leverages the proven methodologies of Scanpy while offering additional features and enhancements |
3. Result
- The application is a robust platform that simplifies the process of scRNA-seq data analysis for users with diverse backgrounds. It converts complex data into interactive and user-friendly plots, enabling users to explore the data and visualize the identified clusters. The application has outstanding interactive capabilities. Users can zoom in or out, reduce complexity, save or download their views, and adjust various parameters. These features give users unprecedented control and flexibility over their data exploration. The application also enhances the user experience by offering a high degree of customization, allowing users to adapt the data analysis to their specific needs. The application integrates sophisticated data analysis and user-centric design, making it an invaluable tool for scRNA-seq data analysis. It is not just an application, but a comprehensive solution that empowers users to unlock the full potential of their data [4,7,60].
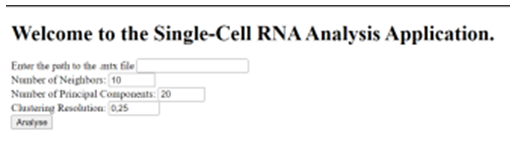 | Figure 2. SCBAWEB interface showcases its versatility by empowering users to customize parameters and algorithms at every stage of the analysis. Users have the flexibility to adjust various factors such as the number of neighbors, the quantity of principal components, and the selection of clustering resolution. This adaptability allows users to tailor their analysis according to their specific requirements, thereby enhancing the user experience and the relevance of the analysis results |
4. Discussion
- We present an innovative web application for the comprehensive analysis of single-cell RNA sequencing (scRNA-seq) data. This application allows users to upload, preprocess, reduce dimensionality, cluster, and analyze their data without extensive bioinformatics expertise. Our results demonstrate the application’s effectiveness in performing the key steps of scRNA-seq data analysis. It provides interactive and insightful visualizations of the data and the identified clusters, making complex data easy to interpret. The application streamlines and accelerates the scRNA-seq data analysis process and enables the exploration of cellular diversity and the identification of differentially expressed genes. The application overcomes the challenges of scRNA-seq data analysis and addresses a major obstacle in the field of cell biology, especially for researchers without a specialized background in bioinformatics. It gives access to advanced data analysis and facilitates new discoveries and insights in cellular biology. The application is not only a tool, but a catalyst for innovation and discovery in scRNA-seq data analysis.
5. Future Enhancements
- SCBAWEB could be enhanced by incorporating advanced features, enabling users to conduct more comprehensive and personalized analyses. For instance, the application could:Support additional file formats for data loading, such as .h5ad [7] or .csv, which are frequently used in scRNA-seq data [61].Empower users to select the analysis parameters, including filtering thresholds, dimensionality reduction methods, clustering algorithms, or cluster resolution [7,18,62,63]. These parameters can significantly influence the analysis results.Facilitate data integration from diverse sources, such as different samples, conditions, or technologies [64-66]. This would aid in identifying biological and technical variations among the data [7,18,61,64,66].
6. Conclusions
- In conclusion, SCBAWEB is an advanced web application that provides a user-friendly and efficient solution for basic scRNA-seq data analysis. Using Flask and Scanpy, the application enables the users to upload, preprocess, reduce, cluster, and analyze their data without requiring in-depth expertise in bioinformatics. The application displays the analysis results as interactive plots, which allow the users to discover the cellular diversity and the differentially expressed genes, opening new perspectives for cell biology research. SCBAWEB is an intuitive and powerful platform for scRNA-seq analysis, which can be enhanced by adding advanced features, such as data integration and automatic cell type annotation.
ACKNOWLEDGEMENTS
- We express our deepest gratitude to all individuals who contributed to the realization of this scientific endeavor. Our sincere appreciation goes to Professor Shulin Wang for his invaluable support, guidance, and collaboration throughout the research process.