-
Paper Information
- Paper Submission
-
Journal Information
- About This Journal
- Editorial Board
- Current Issue
- Archive
- Author Guidelines
- Contact Us
American Journal of Bioinformatics Research
p-ISSN: 2167-6992 e-ISSN: 2167-6976
2023; 12(1): 11-19
doi:10.5923/j.bioinformatics.20231201.02
Received: Sep. 30, 2023; Accepted: Oct. 26, 2023; Published: Dec. 25, 2023

Cancer Gene Identification Using Network Approach
 Abstract
 Reference
 Full-Text PDF
 Full-text HTML
Emmanuel M. Ayodele
Department of Computer Science, Igbajo Polytechnic, Igbajo, Osun State, Nigeria
Correspondence to: Emmanuel M. Ayodele, Department of Computer Science, Igbajo Polytechnic, Igbajo, Osun State, Nigeria.
| Email: |  |
Copyright © 2023 The Author(s). Published by Scientific & Academic Publishing.
This work is licensed under the Creative Commons Attribution International License (CC BY).
http://creativecommons.org/licenses/by/4.0/

A gene network produced by an interactome network, taking a Protein – Protein Interaction as our choice of use, genes that causes similar diseases lie close to each other in a network and produces a high level of interaction among each other. There is a difficulty describing cancer disease with only one gene but this article is interested in introducing the major genes that are involved in causing or suppressing cancer in human through the network approach. This difficulty comes out of the fact that proteins interacts with each others within a cell and those interactions can be represented through a network defined as an abstract representation of nodes and vertices. A human interactome and expression data network was built and the created network was filtered using the fold change variable and new sub networks was created; and finally the genes that stand out in these networks were identified. This article considers the effect of cell fold change on the visual characteristics of the human interactome and acute myeloid and leukaemia cells expression data network. The fold change is a measure of the difference between a normal cell and a cancerous cell. To achieve our objectives, we followed the following methodology: First, we selected the protein-protein network of interest, i.e. the human interactome. Next, we obtained expression data and then layer the gene expression data on the interactome network data using the Cytoscape tool.
Keywords: Human Interactome, Fold Change, Myeloid, Leukemia
Cite this paper: Emmanuel M. Ayodele, Cancer Gene Identification Using Network Approach, American Journal of Bioinformatics Research, Vol. 12 No. 1, 2023, pp. 11-19. doi: 10.5923/j.bioinformatics.20231201.02.
Article Outline
1. Introduction
- One of the central factors promoting the importance of biology is its relationship with medicine. Biology forms the basis or the bedrock of medicine. Meaning that medicine is one of the discipline that exposes the usefulness of biology. Research progress in medicine depends on clarifying some of the mysteries that occurs in the biological sciences in which the gene relationships that constitute a cell that forms an organism is not an exemption. It therefore becomes necessary in medicine to take note of the irregularities of these genes.It was observed that diagnosis of disease and ailment are changing to molecular diagnosis. There is a deep interest in knowing the root cause of all disease even from the molecular level i.e Diagnosis is moving from biochemical to molecular.Discovery of true genes in a complex disease needs to be discovered. Biology tells us that series of genes forms cells that in turn develop to an organism. So, there is a need to develop methods that can expose these disease causing genes from a set of genes [18]. One major methods proposed by the scientists is the network based method. Several approaches has been developed to explore the prioritization of true gene in a complex diseases disease using the network methods. Among the approach, we have the MAXIF (Maximum Information Flow) method, Computational methods called maxif [2]. Co-Clustering technique that employs a regularized non – negative matrix factorization algorithm to cluster phenotypes and genes, and simultaneously detect association between the detected phenotype cluster s and genes clusters [1]. A global based method for prioritizing disease genes was proposed by Oron Vannum [3]. Oron also dealt with the protein complexes association. He called this approach a PRINCE approach. PRINCE approach is based on formulating constraints on the prioritization function that relates to its smoothness over the network. It is also based on the usage of prior information. Random Walk is another network based approach to prioritise a gene [4]. Among others is also a CIPHER algorithm which used a semantic similarity of gene ontology terms to improve disease gene prioritization [14,17]. Schlicker introduced a MedSum novel approach for ranking a candidate gene for a particular disease based on functional comparism involving the gene ontology. MedSum uses functional annotation of known disease genes for accessing the similarity of diseases as well as the disease relevance of candidate genes. A modularity of network for the prioritization of disease genes was performed by Jeffrey Q Jiang et.al [16] and among others. This approach incorporates a Protein-Protein Interaction network, Phenotype Similarity Network and known Phenotype Genotype association into an assembled network which is then broken down into modules wherein they identified and prioritized the disease gene from the candidates within the sub modules that has the query diseases using a linear regression model and concordance score. Cancer is a disease that can be traced to mutation or malfunction of some certain diseases [7]. Scientific researches in molecular genetics conducted many years ago have have identified a number of important genes responsible for the introduction of various types of cancer [8]. It has therefore been laid on researchers as they discovers the genes responsible for some cancer genes to develop some drugs targeting these mutated cancer genes and these have brought dramatic therapeutic advances and substantially improve and prolong the lives of cancer patients [9]. Studies have shown that cancer of divers nature are caused not by a single gene but interaction of different mutated genes. This intensify the work of McKusick (2007) that in proximity to Known Disease Genes of the Same Disease, about half of the disease in the OMIM database [11] have at least one gene known to be involved in the particular disease. It has been suggested that 5% to 10% of the human genes probably contributed to the genesis of cancer known as oncogenesis [10]. This makes cancer to be extremely complex. In the prediction a specific cancer gene, Xuebing Wu and Shao Li [15] in there studies explained how network approach could be used to predict cancer genes using network computational techniques. Such a technique is to (1) Prioritize by network proximity which involves proximity to known disease genes of the same disease and proximity of candidate gene pairs: Enabling de Novo Discovery (2). Phenotype similarity assisted method which involves calculating and validating phenotypic similarity and modeling with molecular network and phenotype similarity (3) Prioritize by network centrality which might involve centrality in a context specific gene network and centrality in a genomic phenomic network. For diseases with known disease genes, the most straightforward way to score and rank candidate genes is to use the proximity to known disease genes as the measure of the disease causing probability. If a candidate is more closely related with a known disease gene, it is more likely to be a disease gene too; therefore, it should get a higher score. If multiple disease genes are already known, then the final score will be the sum of scores across all known disease genes. In prioritization, for many diseases that there causal gene were known in a network, known disease genes propagates the disease signal. Known disease gene serves as the source of disease signal and this signal is propagated along paths on the network to other nodes which fades away as the signal travels to more distant nodes. The choice of distance is usually employed by the prioritization using phenotype similarity assisted method. Mostly prioritization by phenome - interactome correlation using CIPHER equation. [14]. The choice of a particular distance measures out of the three types of distance measure available as well determines a slight variation in the outcome of the prioritization. Among which we have the direct neighbor, shortest path length, and global distance defined by diffusion kernel or random walk. Phenotype similarity assisted method might use a case of Modeling with Molecular Network and Phenotype Similarity that could employ a novel method CIPHER that Prioritize by Interactome-Phenome Correlation [14].To complement the existing work, we introduce the Cytoscape tool, looking at its architecture and taking a brief tour of its functionality. Next, we used the Network analyser Plug-in, to analyse the human interactome and acute myeloid and leukaemia cells expression data network. After this, using the fold range variable, we filter the human interactome and acute myeloid and leukaemia cells expression data network. We then analyse the results by identifying genes that were affected by the fold range variable. Finally, the identified genes were run through a gene database and the results were shown. Cytoscape is an open source bioinformatics software platform for visualizing molecular interaction networks and integrating with gene expression profiles and other related data. While the primary feature of Cytoscape is visualisation, it can be extended to perform tasks like: molecular profiling analyses, new layouts, additional file format support, connection with databases and searching in large networks through the use of Plugins. Plugins may be developed using the Cytoscape open source Java software architecture [13].
 | Figure 1. The Cytoscape Open Architecture. (Source: Shannon P et al. 2003) |
2. Materials and Methods
2.1. Human Interactome Network Data
- A cell constitutes series of genes in which interactions exist between the genes. The total set of the gene interaction or the molecular interaction is known as an Interactome. Scientists has worked over the decades to ensure that a tangible mapping of the protein-protein interaction was produced for scientific analysis and research. The data of protein – protein interaction mapping produced in a model organism which is still far from completion was modelled into so many detailed molecular databases. The interactome network thus produced gives an insight of many useful features that identifies biological properties of the network or of the cell. Thus, understanding the property of each disease. The human interactome map used in this thesis is a proteome-scale map of human binary protein-protein interactions. It was developed using a high-throughput yeast two-hybrid system [19]. They tested pair wise interactions among the products of approximately 8,100 Gateway-cloned open reading frames and detected approximately 2,800 interactions. The data set, called CCSB-HI1, had a verification rate of approximately 78% as made known by an independent co-affinity purification assay, and correlates notably with other known biological attributes. The CCSB-HI1 data set increased by approximately 70% the set of available binary interactions within the tested space and it revealed more than 300 new connections to over 100 disease-associated proteins.
2.2. Gene Expression Data
- The gene expression data was collected from the work by Pellegrini et al. [12]. Their study analysed the expression levels of the cAMP Response Element Binding Protein, CREB in cancer cells. They demonstrated that CREB is over expressed in acute myeloid and leukaemia cells compared to normal hematopoietic stem cells [12]. To achieve this results, they performed expression profiling with RNA from the K562 myeloid leukemia cell line transduced with CREB shRNA. By combining the expression data from CREB knockdown cells with the prior ChIP data on CREB binding they were able to identify a list of putative CREB regulated genes. They performed extensive analyses on the top genes in this list as high confidence CREB targets. They found that this list is enriched for genes involved in cancer, and unexpectedly, highly enriched for histone genes. Furthermore, histone genes regulated by CREB were more likely to be specifically expressed in hematopoietic lineages. In conclusion they identified a list of CREB targets in K562 cells. The authors asserted that the genes showed a partial view of the surface mechanisms by which CREB contributes to acute leukemia. They further went on to speculate that the regulation of histone genes may play an important role by possibly altering the regulation of DNA replication during the cell cycle.
2.3. Network Parameters
- By the same cytoscape, series of network parameters were generated to analyse the network provided by the data above. These network parameters gives an idea of the relationship of the cancer related genes and other genes. The following topological parameters were used to analyse the network: the node degree distribution, average clustering coefficient distribution, topological coefficient, shortest length path distribution, shared neighbours distribution, closeness centrality, and stress centrality distribution.i. The Node Degree Distribution.In a node degree distribution, the number of routes a particular node will connect to the other node in a network is called the degree of a node in a network. Mathematically, nodes with degree k divided by the total number of nodes in a network gives the degree distribution P(k) of a network. The same information is sometimes presented in the form of a cumulative degree distribution, the fraction of nodes with degree greater than or equal to k.
 | Figure 2. The Node Degree Distribution of the Human Interactome and acute myeloid and leukaemia cells expression data network |
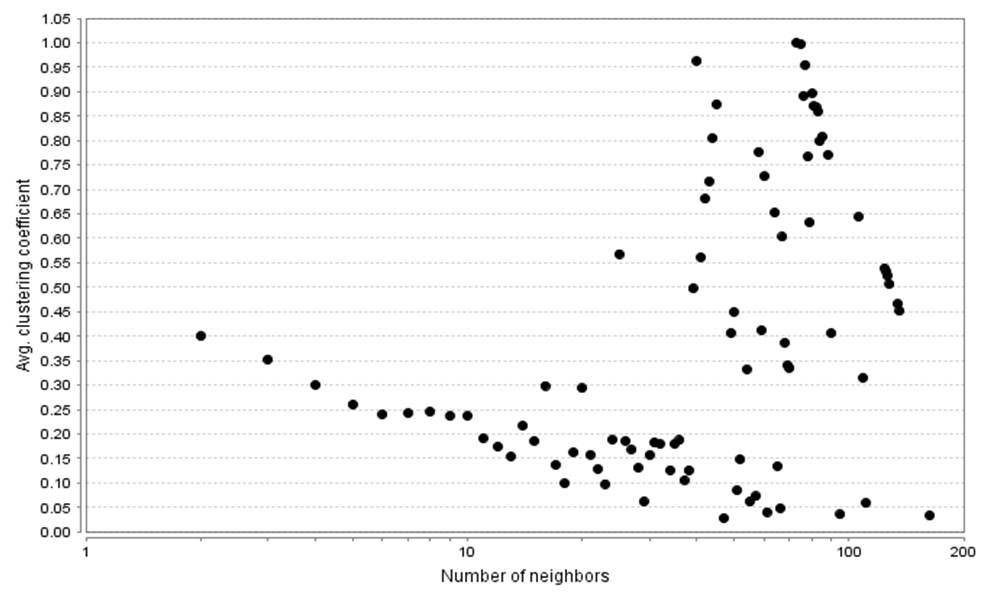 | Figure 3. The average clustering coefficient distribution of the Human Interactome and acute myeloid and leukaemia cells expression data network |
3. The Human Interactome and Acute Myeloid and Leukaemia Cells Expression Data Network in a Cytoscape
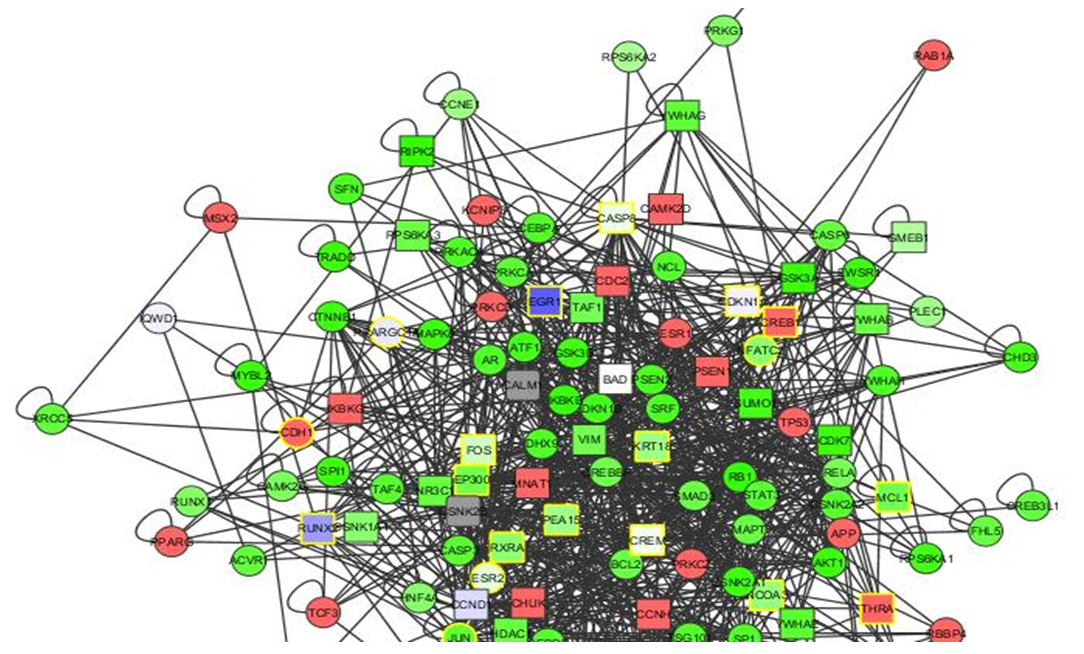
- The below is a figure of the network generated by a cytoscape loaded with an human interactome and acute myeloid and leukemia cells expression data. We employed a profused force directed data layout. Force-directed graph drawing algorithms assign forces among the set of edges and the set of nodes of a graph drawing. Typically, attractive forces based on Hooke's law are used to attract pairs of endpoints of the graph's edges towards each other, while simultaneously repulsive forces like those of electrically charged particles based on Coulomb's law are used to separate all pairs of nodes. In equilibrium states for this system of forces, the edges tend to have uniform length and nodes that are not connected by an edge tend to be drawn further apart.
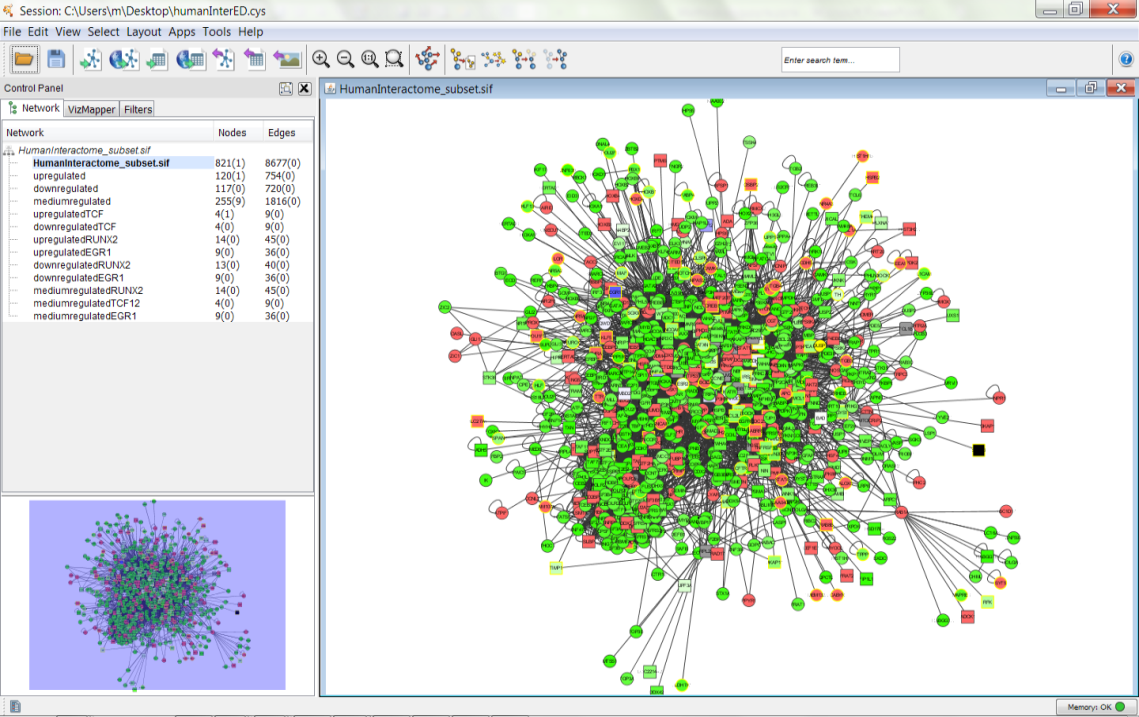 | Figure 4. The Human Interactome and acute myeloid and leukaemia cells expression data network with the prefuse force directed layout applied in Cytoscape |
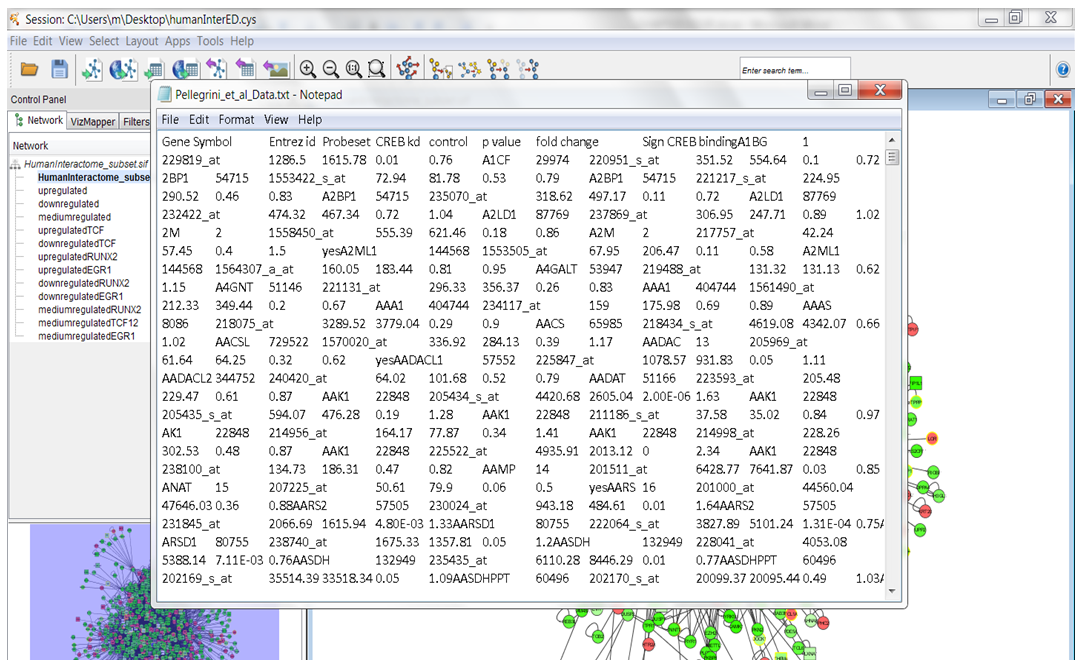 | Figure 5. The acute myeloid and leukaemia cells Gene Expression data |
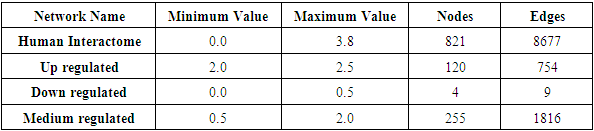
4. Fold Change
- Next in the process, we defined different ranges for the fold change variable, to determine its effect on the network. The ranges defined are shown in the table below. It is important to note that the networks refer to the composite expression data and human interactome network.
|
 | Figure 6. The down regulated network 0 |
 | Figure 7. The down regulated network: 0.5 |
 | Figure 8. The upregulated network: 2< fold change <3.9 |
5. Result
- In each of the above networks, we noticed that certain genes stand out at different fold changes. These genes and their neighours are presented in the subsequent figures: The genes of interest are blue as appears in the network.
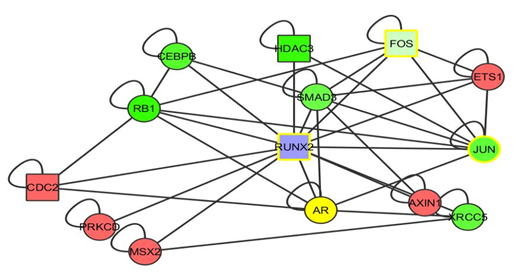 | Figure 9. The RUNX2 gene |
 | Figure 10. The TCF 12 gene |
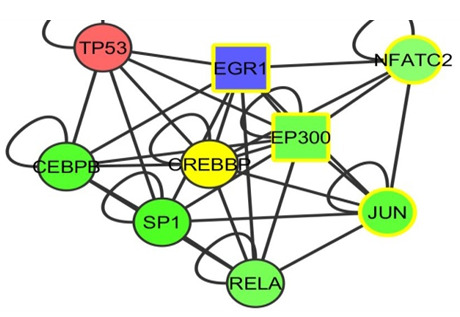 | Figure 11. The EGR 1 gene |
6. Conclusions
- We have shown that by selecting multiple fold ranges, we can identify cancer genes in a human interactome and acute myeloid and leukaemia cells expression data network using the Cytoscape tool.In conclusion, we identified three genes which we believe is either cancer causing or cancer suppressing. They are the RUNX2, TCF12, EGR1 genes. As the identification of the disease causing genes is been carried out by network approach, So also, the prediction of the drug targets could also be carried out by network approach in which many scientist has worked on different methods of the approach [20]. It was noticed that drug targets using bioinformatics method is not yet concrete and is still said to be try and error approach [21]. As a recommendation, I recommend that future researches should still concentrate on network approach to drug targets of disease so as to have an appreciative and convincing level of trust in the drug described by bioinformatics’ analysis.
ACKNOWLEDGEMENTS
- I wish to acknowledge my mentor and teachers Professor Adenike Osofisan and Dr. Oladejo whom there support guides and motivates from time to time in my researches. I must be sincere to to appreciates all the authors that there work helped in the classification of the cancer gene and more importantly Oron Vannun whom gave online assistant at a critical stage.