-
Paper Information
- Paper Submission
-
Journal Information
- About This Journal
- Editorial Board
- Current Issue
- Archive
- Author Guidelines
- Contact Us
American Journal of Bioinformatics Research
p-ISSN: 2167-6992 e-ISSN: 2167-6976
2019; 9(1): 1-10
doi:10.5923/j.bioinformatics.20190901.01

Image Analysis Based on the Eigenvalues of Variance Covariance Matrix of FFT Scaling of DNA Sequences: An Empirical Study for Some Organisms
 Abstract
 Reference
 Full-Text PDF
 Full-text HTML
Salah H. Abid, Jinan H. Farhood
Al-Mustansiriyah University, Iraq
Correspondence to: Salah H. Abid, Al-Mustansiriyah University, Iraq.
| Email: |  |
Copyright © 2019 The Author(s). Published by Scientific & Academic Publishing.
This work is licensed under the Creative Commons Attribution International License (CC BY).
http://creativecommons.org/licenses/by/4.0/

Many studies discussed different numerical representations of DNA sequences, while far fewer studies deal with image analysis for aspects related with DNA. In this paper, we proposed new algorithm for image similarity to compare among variance covariance matrix eigenvalues images of Fast Fourier Transform (FFT) for numerical values representation of DNA sequences of five organisms, Human, E. coli, Rat, Wheat and Grasshopper. This algorithm is based on randomized block design model. It should be noted that it is the first time that the variance covariance matrix eigenvalues of Fast Fourier Transform (FFT) for numerical values representation of DNA sequences, is used in an analysis like this and related analyzes.
Keywords: FFT scaling, DNA, Randomized block design, Image similarity, Eigenvalues
Cite this paper: Salah H. Abid, Jinan H. Farhood, Image Analysis Based on the Eigenvalues of Variance Covariance Matrix of FFT Scaling of DNA Sequences: An Empirical Study for Some Organisms, American Journal of Bioinformatics Research, Vol. 9 No. 1, 2019, pp. 1-10. doi: 10.5923/j.bioinformatics.20190901.01.
Article Outline
1. Introduction
- It is well known that, one of the most interesting directions was the use of the technology in the analysis of long DNA sequences. A benefit of the techniques was that it combined rigorous statistical analysis with modern computer power to quick search for diagnostic patterns within long DNA sequences. Briefly, a DNA strand can be viewed as a long string of linked nucleotides. Each nucleotide is composed of a nitrogenous base, a five carbon sugar, and a phosphate group. There are four different bases that can be grouped, the pyrimidines, thymine (T) and cytosine (C), and the purines, adenine (A) and guanine (G). The nucleotides are linked together by a backbone of alternating sugar and phosphate groups with the
 carbon of one sugar linked to the
  carbon of the next, giving the string direction. DNA molecules occur naturally as a double helix composed of polynucleotide strands with the bases facing inward. The two strands are complementary, so it is sufficient to represent a DNA molecule by a sequence of bases on a single strand; refer to Fig. 1. Thus, a strand of DNA can be represented as a sequence
  of letters, termed base pairs (bp), from the finite alphabet
  The order of the nucleotides contains the genetic information specific to the organism [Stoffer, D. (2012)].
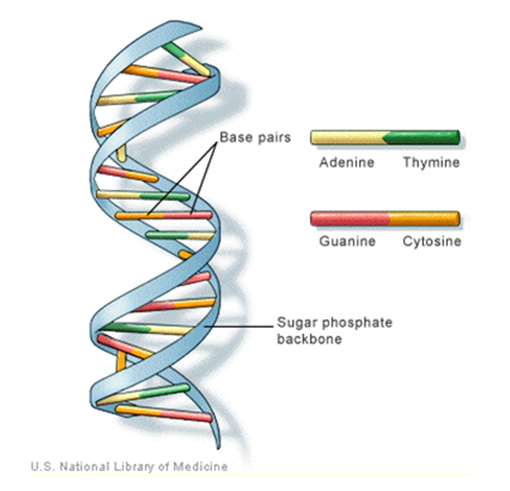 | Figure 1. The general structure of DNA and its bases |
 and
and  . The background behind the problem is discussed in detail in the study by Waterman and Vingron (1994). For example, every new DNA or protein sequence is compared with one or more sequence databases to find similar or homologous sequences that have already been studied, and there are numerous examples of important discoveries resulting from these database searches.One naive approach for exploring the nature of a DNA sequence is to assign numerical values (or scales) to the nucleotides and then proceed with standard time series methods. It is clear, however, that the analysis will depend on the particular assignment of numerical values. Consider the artificial sequence ACGTACGTACGT. . . Then, setting A = G = 0 and C = T = 1, yields the numerical sequence 010101010101. . . , or one cycle every two base pairs (i.e., a frequency of oscillation of
  Cycle/bp, or a period of oscillation of length
  bp=cycle). Another interesting scaling is A = 1, C = 2, G = 3, and T = 4, which results in the sequence 123412341234. . . , or one cycle every four bp
  In this example, both scalings of the nucleotides are interesting and bring out different properties of the sequence. It is clear, then, that one does not want to focus on only one scaling. Instead, the focus should be on finding all possible scalings that bring our interesting features of the data. Rather than choose values arbitrarily, the spectral envelope approach selects scales that help emphasize any periodic feature that exists in a DNA sequence of virtually any length in a quick and automated fashion. In addition, the technique can determine whether a sequence is merely a random assignment of letters [Stoffer, D. (2012)].Fourier analysis has been applied successfully in DNA analysis; McLachlan and Stewart (1976) and Eisenberg et al. (1994) studied the periodicity in proteins using Fourier analysis.Stoffer et al. (1993a) proposed the spectral envelope as a general technique for analyzing categorical-valued time series in the frequency domain. The basic technique is similar to the methods established by Tavar´e and Giddings (1989) and Viari et al. (1990), however, there are some differences. The main difference is that the spectral envelope methodology is developed in a statistical setting to allow the investigator to distinguish between significant results and those results that can be attributed to chance.The article authored by Marhon and Kremer 2011, partitions the identification of protein-coding regions into four discrete steps. Based on this partitioning, digital signal processing DSP techniques can be easily described and compared based on their unique implementations of the processing steps. A new methodology for the analysis of DNA/RNA and protein sequences is presented by Bajic in 2000. It is based on a combined application of spectral analysis and artificial neural networks for extraction of common spectral characterization of a group of sequences that have the same or similar biological functions. Fourier transform infrared (FTIR) spectroscopy has been considered by Han et al. in 2018 as a powerful tool for analysing the characteristics of DNA sequence. This work investigated the key factors in FTIR spectroscopic analysis of DNA and explored the influence of FTIR acquisition parameters, including FTIR sampling techniques, pretreatment temperature, and sample concentration, on calf thymus DNA. The results showed that the FTIR sampling techniques had a significant influence on the spectral characteristics, spectral quality, and sampling efficiency. Ruiz et al. 2018 proposed a novel approach for performing cluster analysis of DNA sequences that is based on the use of Genomic signal processing GSP methods and the K-means algorithm. They also propose a visualization method that facilitates the easy inspection and analysis of the results and possible hidden behaviors. Since the type of numerical representation of a DNA sequence extremely affects the prediction accuracy and precision, by this study Mabrouk in 2017 aimed to compare different DNA numerical representations by measuring the sensitivity, specificity, correlation coefficient (CC) and the processing time for the protein coding region detection. The objective of the paper authored by Roy and Barman in 2011 is to estimate and compare spectral content of coding and non-coding segments of DNA sequence both by Parametric and Nonparametric methods. Consequently an attempt has been made so that some hidden internal properties of the DNA sequence can be brought into light in order to identify coding regions from non-coding ones. In 2006, Galleani and Garello presented a new approach where the mapping is not kept fixed: it is allowed to vary aiming to minimize the spectrum entropy, thus detecting the main hidden periodicities. The new technique is first introduced and discussed through a number of case studies, then extended to encompass time-frequency analysis.For analyzing periodicities in categorical valued time series, the concept of the spectral envelope was introduced by Stoffer et al., 1993 as a computationally simple and general statistical methodology for the harmonic analysis and scaling of non-numeric sequences. However, the spectral envelope methodology is computationally fast and simple because it is based on the fast Fourier transform and is nonparametric (i.e., it is model independent). This makes the methodology ideal for the analysis of long DNA sequences. Fourier analysis has been used in the analysis of correlated data (time series) since the turn of the century. Of fundamental interest in the use of Fourier techniques is the discovery of hidden periodicities or regularities in the data. Since a DNA sequence can be regarded as a categorical-valued time series it is of interest to discover ways in which time series methodologies based on Fourier (or spectral) analysis can be applied to discover patterns in a long DNA sequence or similar patterns in two long sequences. Actually, the spectral envelope is an extension of spectral analysis when the data are categorical valued such as DNA sequences.An algorithm for estimating the spectral envelope and the optimal scalings given a particular DNA sequence with alphabet
  is as follows [Stoffer, D. (2012)].1. Given a DNA sequence of length
  from the
  vectors
  namely, for
  if
if  where
where  is a
is a  vector with a 1 in the jth position as zeros elsewhere, and
  if
if  2. Calculate the Fast Fourier Transform FFT of the data,
  Note that
  is a
is a  complex-valued vector. Calculate the periodogram,
  for
for  and retain only the real part, say
  3. Smooth the real part of the periodogram as preferred to obtain
  a consistent estimator of the real part of the spectral matrix.4. Calculate the
  variance–covariance matrix of the data,
  where
where  is the sample mean of the data.5. For each
  determine the largest eigenvalue and the corresponding eigenvector of the matrix
  6. The sample spectral envelope
  is the eigenvalue obtained in the previous step.7. The optimal sample scaling is
 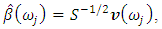 where
where  is the eigenvector obtained in the previous step.In this paper, we proposed new algorithm for image similarity to compare among images of variance covariance matrix eigenvalues of Fast Fourier Transform (FFT) for numerical values representation of DNA sequences of five organisms, Human, E. coli, Rat, Wheat and Grasshopper. This algorithm is based on randomized block design model. It should be noted that it is the first time that the variance covariance matrix eigenvalues of Fast Fourier Transform (FFT) for numerical values representation of DNA sequences, is used in an analysis like this and related analyzes.
2. Image Similarity
- Image similarity is the measure of how similar two images are. In other words, it quantifies the degree of similarity between intensity patterns in two images.Initially, image similarity models considered category-level image similarity. For example, two images are considered similar as long as they belong to the same category. This category-level image similarity is not sufficient for the search-by-example image search application. Search by query image requires the distinction of differences between images within the same category- to recognize the fine grained differences in the similar images.Sequence similarity analysis is a basic method in computational biological studies. Determining the similarity of biological sequences is a vital step in much research, such as exploring the evolutionary relationship among species, gene function analysis, protein structure prediction, and sequence retrieving. Chen et al. in 2018 introduced a method that uses the theory of the gray-level co-occurrence matrix, which is important in image texture analysis, to define and calculate the features of a DNA sequence. The proposed method make a quantitative analysis and compute the defined texture features of a DNA sequence. Using these quantified sequence features, a similarity distance matrix can be computed and phylogenetic relationships also can be inferred. From the quantified features, they found that the DNA sequence of humans has the highest entropy and lowest energy. From human to chimpanzee, orangutan, gorilla, and other species, the entropy decreases and energy increases. The advantage of the proposed method is that it can compute multiple features inherent in each sequence. Furthermore, the defined features can be the key values or tags for each sequence for sequence retrieval and similarity analysis.Cramariuc et al. in 2000 proposed an ordinal-based measure of image similarity. This measure is based on a recently developed general framework for image correspondence and incorporates region based spatial information. The measure is capable of taking into account differences between images at various scales. Several examples are presented and the measure is evaluated on a set of test images.Shnain et al. in 2017 proposed an efficient similarity index that resolves the shortcomings of the existing measures of feature and structural similarity. This measure, called the Feature-Based Structural Measure (FSM), combines the best features of the well-known SSIM (structural similarity index measure) and FSIM (feature similarity index measure) approaches, striking a balance between performance for similar and dissimilar images of human faces.Graphical representation of DNA sequences is one of the most popular techniques of alignment-free sequence comparison. Kobori and Mizuta in 2016 proposed a new method for extracting features of DNA sequences represented by binary images, in which they estimate the similarity between DNA sequences by the frequency histograms of local bitmap patterns on the images.Genomic signal processing (GSP) refers to the use of signal processing for the analysis of genomic data. GSP methods require the transformation or mapping of the genomic data to a numeric representation. To date, several DNA numeric representations (DNR) have been proposed; however, it is not clear what the properties of each DNR are and how the selection of one will affect the results when using a signal processing technique to analyze them. In 2017 Ruiz et al. presented an experimental study of the characteristics of nine of the most frequently-used DNR. The objective of this paper is to evaluate the behavior of each representation when used to measure the similarity of a given pair of DNA sequences.In the thesis of Schade in 2015, an evaluation of multiple methods of image classification is presented. he explored the application of color spaces and several histogram distance calculation algorithms to achieve a classification system that’s able to determine whether an image belongs to a certain set with a specific theme. For this thesis a C++ program has been build using OpenCV to extract color information from images in either RGB or HSV color space, then this information is used to calculate similarity between images using one of the following algorithms: Euclidian distance, Intersection distance, Quadratic cross distance and Earth’s mover’s distance. Precision and recall are then used to evaluate the combination of the chosen color space and algorithm.Fric in his thesis 2014 explored the methods usable for image similarity assessment. First part of this work is dedicated to a feature based approach utilizing the wavelet transform. The second part is dedicated to methods for extracting low dimensional codes from natural images.Similarity/dissimilarity analysis of DNA sequences is performed using3D-dynamic representation. The sequences are represented by material points in a 3D-space. Descriptors related to such 3D-dynamic graphs are calculated. A new normalized similarity measure is introduced by Wąż and Wąż in 2014, for a comparison of the sequences. The method is applied to β-globin (HBB) genes of different species. Different methods are compared.Aiming at the problem that the image similarity detection efficiency is low based on local feature, an algorithm called ScSIFT for image similarity acceleration detection based on sparse coding is proposed by Xidao et al. in 2018. The algorithm improves the image similarity matching speed by sparse coding and indexing the extracted local features. Firstly, the SIFT feature of the image is extracted as a training sample to complete the over complete dictionary, and a set of over complete bases is obtained. The SIFT feature vector of the image is sparse-coded with the over complete dictionary, and the sparse feature vector is used to build an index. The image similarity detection result is obtained by comparing the sparse coefficients.
3. Randomized Block Design
- The ANOVA is a tool for studying the influence of one or more qualitative variables on the mean of a numerical variable in a population. In ANOVA the response variable is numerical and the explanatory variables are categorical [Kirk, R. (2012)].The response variable (dependent variable) is the variable of interest to be measured in the experiment. Factors are the variables whose effect on the response variable is studied in the experiment, while, Factor levels are the values of a factor in the experiment. Treatments are the possible factor level combinations in the experiment. (One factor level for each factor is combined with factor level from other factors). A designed experiment is an experiment in which the researcher chooses the treatments to be analyzed and the method for assigning individuals to treatments.In Completely Randomized, only one factor is considered and “completely randomized” indicates that the experimental units are assumed to be randomly assigned to the factor levels.Sometimes a study is designed to include such a variable in order to reduce the variability in the response variable and therefore to require a smaller sample size. If we include a block variable (factor). This is usually considered a variable that is a confounding variable, i.e. not of interest by itself but has an influence on the response variable and should for this reason be included. Generally, each treatment is used exactly once within each block, in conclusion, if we have t treatments and b block, then the total sample size is n = b x t. The model for a randomized block design with one nuisance variable is,
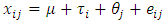 ,Where
 is the measurement for treatment i in block j,
  is the overall mean,
  is the effect of treatment i,
  is the effect of block j and
  is the error in measurement for treatment i and block j. In most of studies
  assumed to be normal variate with mean zero and variance
  . Generally, the normality assumption is not necessary due to the robustness property of this analysis against any change in the distribution of the error random variable. In the analysis of variance instead of only explaining the variance through error and treatment, we also include the block as a possible source for variance in the data.The Hypotheses under test in this analysis are,
 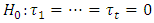 versus
  at least one of the values differs from the others. The test statistic is
 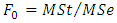 based on
  and
and 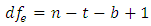 , where
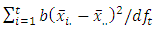 and
and 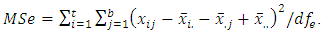 The decision rule according to P-value:
  where
where  follows an
  distribution with
  and
and  is reject
  if P-value
  and do not reject
  if P-value
  where
where  is the significant level.
4. The Proposed Algorithm
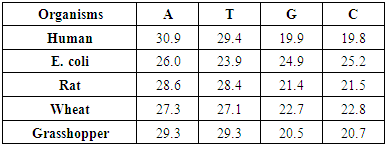
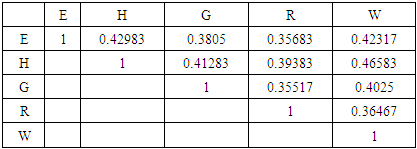
- The following algorithm steps is performed to achieve our aim,1. Simulate DNA sequence for five organisms, Human, E. coli, Rat, Wheat and Grasshopper with corresponding information in table (1).
|
5. Results Presentation
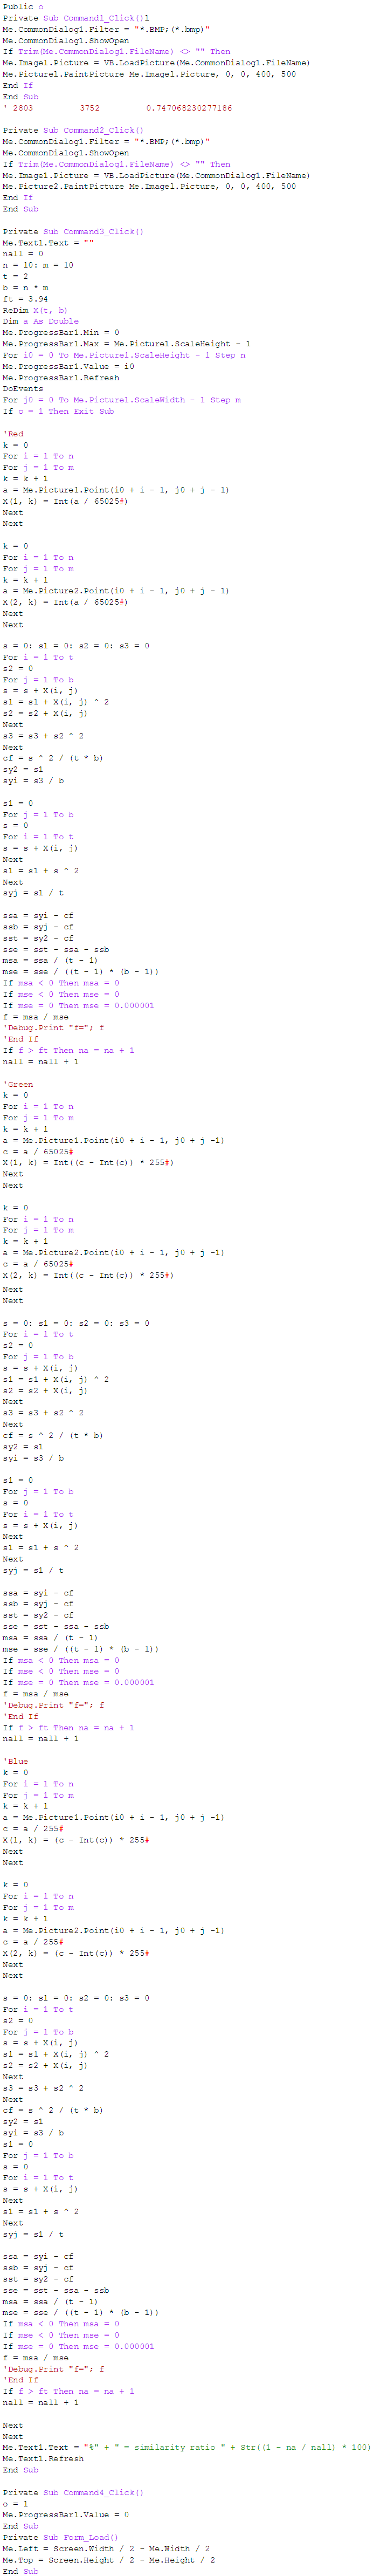
- MATLAB software was used to calculate FFT and then the eigenvalues vectors of FFT values for numerical values representation of DNA sequences of five organisms under consideration. Then, a program was written by Visual Basic codes to calculate similarity rate between each pair of eigenvalues images. The codes is in appendix (1).As a result, five images were obtained (Figures 2-6), one for each organism. These images have been painted based on eigenvalues vectors. The colors blue, red, green and violet represented the eigenvalues from the largest one to the smallest eigenvalues respectively according to 205 of values for each organism. Each image serves as a fingerprint to the corresponding organism. Every image we obtained consisting of 2706904 pixels, 2252 horizontal pixels and 1202 vertical pixels. Every 101 pixels will represent blocks in randomized block design and of course, the number of treatments will be two. Thus, we will have 26801 models of randomized block design, which is mean that we will have 26801 of test results. It is worth mentioning that the significant level we used is 0.05.
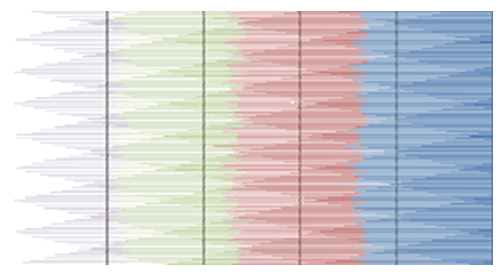 | Figure 2. Representation of E. coli eigenvalues vectors |
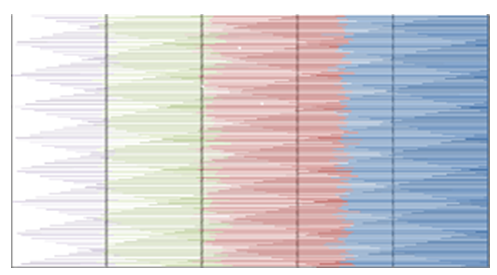 | Figure 3. Representation of Grasshopper eigenvalues Vectors |
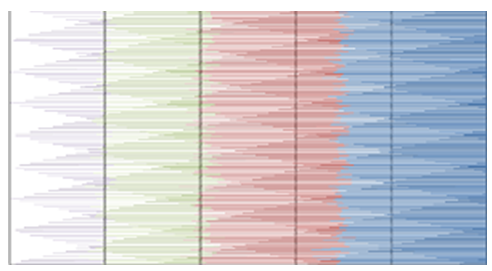 | Figure 4. Representation of Human eigenvalues vectors |
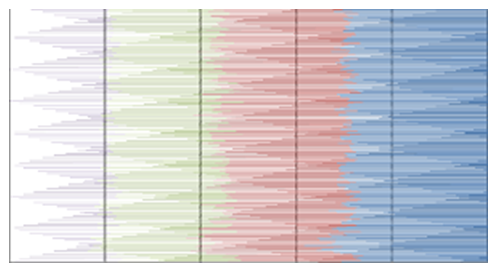 | Figure 5. Representation of Rat eigenvalues vectors |
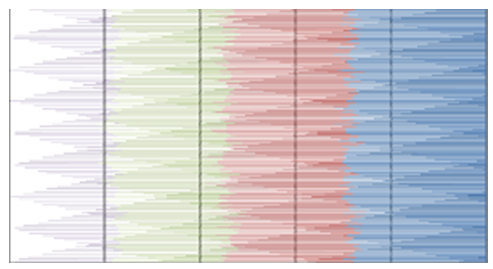 | Figure 6. Representation of Wheat eigenvalues vectors |
|
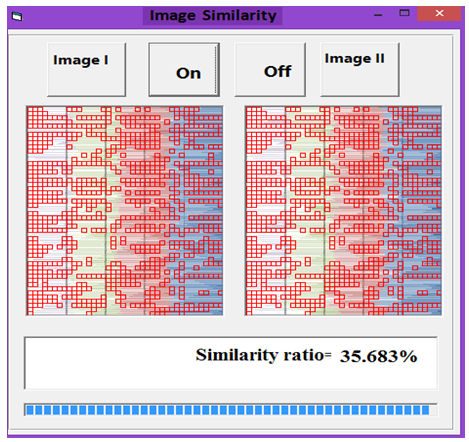
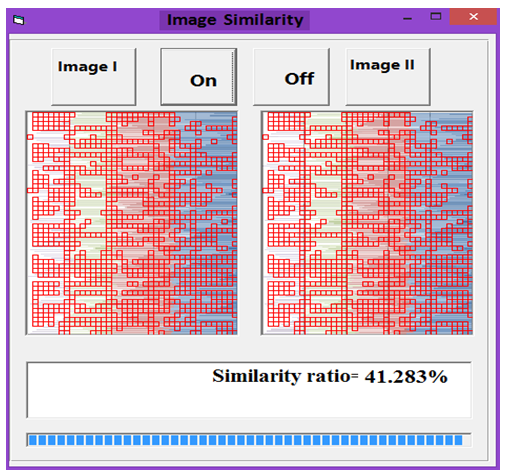
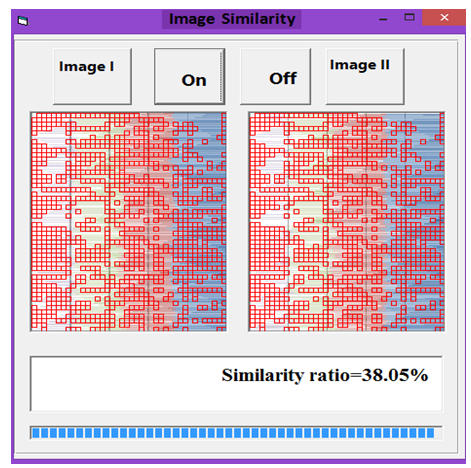 | Figure 7. Similarity rate between images of DNA representation for E. coli and Grasshopper |
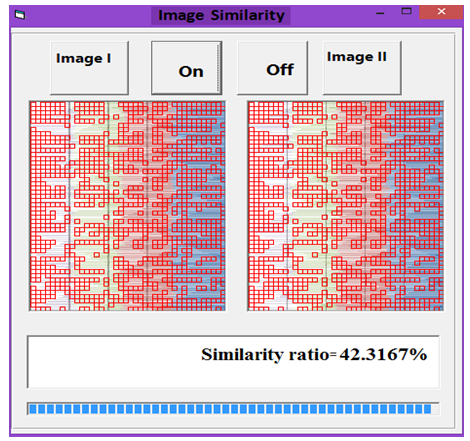
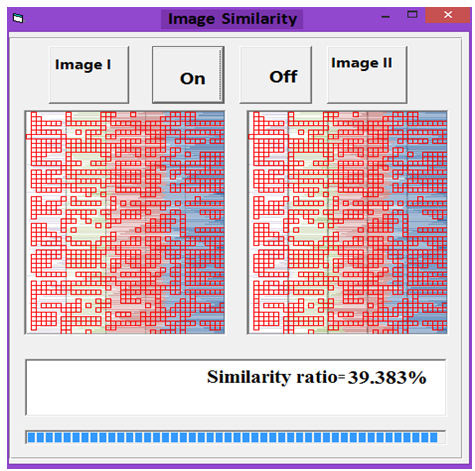
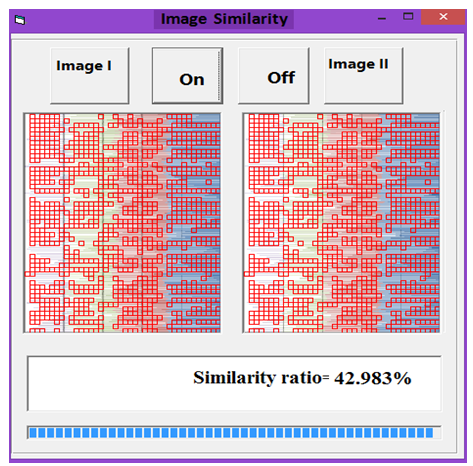 | Figure 8. Similarity rate between images of DNA representation for E. coli and Human |
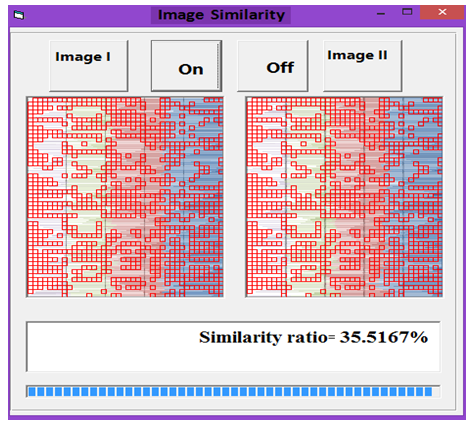
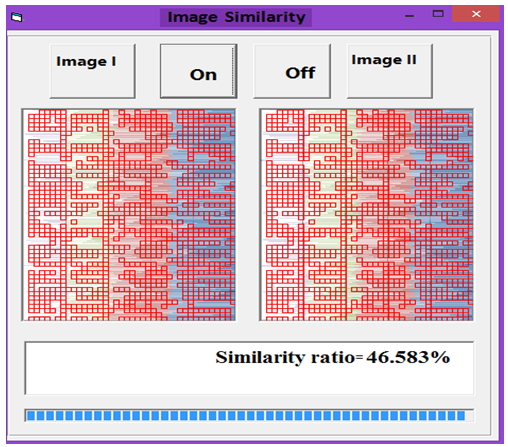
 | Figure 9. Similarity rate between images of DNA representation for E. coli and Rat |
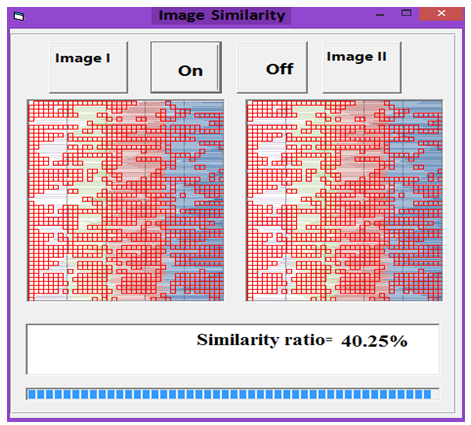
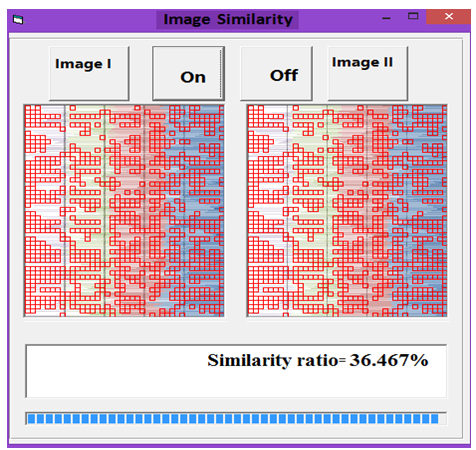
 | Figure 10. Similarity rate between images of DNA representation for E. coli and Wheat |
 | Figure 11. Similarity rate between images of DNA representation for Rat and Grasshopper |
 | Figure 12. Similarity rate between images of DNA representation for Wheat and Grasshopper |
 | Figure 13. Similarity rate between images of DNA representation for Human and Grasshopper |
 | Figure 14. Similarity rate between images of DNA representation for Rat and Human |
 | Figure 15. Similarity rate between images of DNA representation for Human and Wheat |
 | Figure 16. Similarity rate between images of DNA representation for Rat and Wheat |
Appendix (1)
- Visual Basic codes to calculate similarity rate between each pair of eigenvalues images