-
Paper Information
- Paper Submission
-
Journal Information
- About This Journal
- Editorial Board
- Current Issue
- Archive
- Author Guidelines
- Contact Us
American Journal of Bioinformatics Research
p-ISSN: 2167-6992 e-ISSN: 2167-6976
2017; 7(1): 1-8
doi:10.5923/j.bioinformatics.20170701.01

Ensemble Learning Methods to Deal with Imbalanced Disease and Left-Skewed Cost Data
 Abstract
 Reference
 Full-Text PDF
 Full-text HTML
Songul Cinaroglu
Department of Healthcare Management, Hacettepe University, Ankara, Turkey
Correspondence to: Songul Cinaroglu, Department of Healthcare Management, Hacettepe University, Ankara, Turkey.
| Email: |  |
Copyright © 2017 Scientific & Academic Publishing. All Rights Reserved.
This work is licensed under the Creative Commons Attribution International License (CC BY).
http://creativecommons.org/licenses/by/4.0/

Rare events and class imbalance is very often in classification problems. Rare diseases which are good example for rare events are life-threating and vast majority of them are genetically determined. Moreover, traditionally appropriate analysis of cost data generated by clinical trial is problematic. The distribution of cost data is generally highly skewed because a few patients faced with large costs. Several ensemble learning methods (ELM) were applied to health care datasets such as predicting individual expenditures and disease risks for patients. These methods are consists of a set of individual training classifiers such as Bagging and Boosting. This study aims to compare ELM classification performances applied on thyroid disease dataset. Data came from UCI Machine Learning Repository. Diagnosed as a hyperthyroid determined as a dependent variable for classification. ID.3, C4.5, CART, NB, KNN, RF, SVM, NN were used as ELMs. Bagging and Boosting were implemented to improve prediction performances. “k” 10 fold cross validation and AUC was examined to evaluate classication performances of ELMs. Study results reveal that single ELM have superior prediction performance compared with Bagging and Boosting applications. In addition to that kNN, RF and NN have superior classification performance compared with other ELMs. Future research is needed to better understand the role of ELM to improve prediction performance of rare disease data.
Keywords: Imbalanced Data, Rare Diseases, Ensemble Learning, Left-Skewed Cost Data
Cite this paper: Songul Cinaroglu, Ensemble Learning Methods to Deal with Imbalanced Disease and Left-Skewed Cost Data, American Journal of Bioinformatics Research, Vol. 7 No. 1, 2017, pp. 1-8. doi: 10.5923/j.bioinformatics.20170701.01.
Article Outline
1. Introduction
- Rare events that occur with low frequency, if one class contains significantly more samples than the others. These events frequently causes imbalanced data problem in statistics. Presenting imbalanced data to the classifier will produce undesirable results [1]. Rare diseases are good examples for rare events. Most rare diseases are life-threating and the vast majority of them are genetically determined. Low prevalence of rare diseases requires special attention to improve diagnosis, care and prevention [2]. Fraudulent credit card transactions [3], word mispronunciation [4], oil spills [5], train derailments [6], tornadoes [7] are popular examples of rare events. The low prevalence of rare diseases improves their social and economic impact. Economic impacts are associated with specialized health and educational services, loss of income for caregivers and loss of productivity for society are some of these impacts [8]. Disease prediction is becoming a prominent research area due to the increasing popularity of big datasets. Large public datasets are valuable sources and they are still a valuable resources to obtain useful information about rare diseases. First, they may provide population level clinical information. Second, they are available to develop methodologies for clinical decision support systems that can be employed for electronic medical records [1]. On the other hand, the appropriate analysis of cost data generated by clinical trial is problematic. While the usual outcome of interest is the population mean cost for a particular treatment, the distribution of cost data is generally highly skew because a few patients incur very large costs [9]. The distribution of costs and expenditures for health care shares a number of characteristics that make their use in economic analysis difficult. The costs are typically highly skewed to the right. Under these circumstances analysts have often found that use of standard least squares estimators often leads to analytical problems from highly influential outliers [10]. A minority of patients are responsible for a high proportion of health care costs is one of the biggest reason of that rare events are more observed than severe cases [11]. Learning classifiers from imbalanced datasets is important and observed very often in practice. Traditional classifiers tend to classify all the data into the majority class, which is usually the less important class. Scholars suggest that it is hard to achieve good prediction performance results while using traditional methods, several machine learning techniques were applied to healthcare datasets to improve future prediction of diseases. These modern statistical learning algorithms are effective methods for predicting individual expenditures and disease risks for patients. Modern methods combine the predictions of multiple base learners to form ensembles, which typically achieve better predictive performance than individual base learners [12]. Several machine learning techniques were applied to health care datasets these include such as predicting individual expenses and disease risks for patients. Ensemble learning methods (ELMs) are effective methods to deal with imbalanced data. They consists of a set of individual classifiers, such as decision trees. Decision trees are combined novel instances and they are more accurate than any of the single classifiers in the ensemble. ID.3 (Interactive Dichotomizer 3), C4.5 and CART (Classification and Regression Trees) are well known examples of decision tree based ELMs. ID.3 algorithm uses the concept of information gain. It uses information entropy minimization criteria in tree growing process. C4.5 is an another popular decision tree algorithm, it is an extended version of ID.3 algorithm. CART generates binary decision tree constructed by splitting the data in a node into small nodes repeatedly, starting with the root node that includes the whole learning sample [13]. RF (Random Forest) is an ensemble learner and a method that generates many classifiers and gathers their results. RF will produce multiple CART trees. Each tree in the RF will take a vote for some input x, then the output of the classifier is determined by majority voting of the trees. RF can handle with high dimensional data and use a large number of trees in the ensemble [1]. RF is an effective method to overcome imbalanced data. It also estimates the importance of variables used in the classification. kNN (k-Nearest Neighbors) is an another well-known ensemble learning method to handle imbalanced data. It is a non-parametric method used for classification and regression. The input consists of the “k” closest training examples in the feature space. In k-NN classification, the output is a categoric variable. An object is classified by a majority vote to its neighbors in this algorithm. Thus, an object is classified by a majority vote to its neighbors, with the object being assigned to the class most common among its k nearest neighbor [14]. SVM (Support Vector Machine) is a binary classifier and it is assumed to be linearly separable in the input sphere. For binary case it is suggested that a hyper plane exist such that all points belongs to one class are on the one side, and all points belonging to the other class are on the other side of the hyperplane [13]. NB (Naive Bayes) is an another ensemble learning method assign class labels to problem instances. All NB classifiers assume that the value of a particular feature is independent of the value of any other feature, given the class variable [15]. In the last decade the use of artificial intelligence has become widely accepted in medical applications. NN (Neural Networks) are popular methods of artificial intelligence. Ease optimization and accuracy of prediction, flexible non-linear modelling of large datasets and potential to support clinical decision making are advantages of using NN [16]. Bagging and Boosting are comparably new methods for generating ensembles [17-19]. Bagging predictor is a method for generating numerous versions of predictor and using these to get an aggregated predictor. The aggregation averages over the versions when predicting a numerical outcome and does a majority vote when predicting a class [17]. Bagging can make weak learners to learn parallel since random dataset is used for training [20]. Boosting [18] includes a family of methods. The focus of these methods is to produce a series of classifiers. The training set used for each number of the series is chosen based on the performance of the earlier classifier(s) in the series. In Boosting, instances that are incorrectly predicted by former classifiers in the series are selected more often than examples that were correctly predicted. Thus, Boosting produce new classifiers that are better able to predict examples for which the current ensemble’s performance is bad. AUC (Area Under the ROC Curve) is a performance measure of a plot that represents the performance of a binary classifier system. The curve is created by plotting the true positive rate against the false positive rate. AUC values lies between 0.5 and 1 where 0.5 is a bad classifier and 1 denotes an excellent classifier [13]. Here are some examples from the literature emphasizing prediction performance differences between ELMs. Davis et al. (2008) was used ELMs to predict individual disease risk based on medical history. The prediction was performed multiple times for each patient, each time employing different sets of variables. In the end, the clustering were combined to form an ensemble [21]. Moturu et al. (2007) predicted future high cost patients, data taken from Arizona Medicaid program and 20 non-random data samples created, each sample with 1.000 data points to overcome the problem of imbalanced data. Variety of classification methods such as: SVM, Logistic regression, Logistic Model Trees, AdaBoost and LogitBoost were used in the analysis [22]. Mantzaris et al. (2008) predicted Osteoporosis using NN [23]. Hebert et al. (1999) identified persons with diabetes using Medicare claims data [24]. They have constructed a problem where the diabetes claims occur less frequently to be sensitive indicators for persons with diabetes. Yu et al. (2010) examined a method using SVM for detecting persons with diabetes and prediabetes [25]. Zhang et al. (2009) compared prediction performances of AdaBoost, LogitBoost and RF to logistic regression and SVM in the classification of breast cancer metastasis [26]. They concluded that ensemble learners have higher accuracy compared to the non-ensemble learners. There are large number of studies in the literature emphasizing the prediction performance differences of ELMs. However, lack number of studies that has been carried out specifically to compare prediction performance of ELMs while using rare diseases and left-skewed cost data. To fill this void in the literature this study aims to compare prediction performances of ELMs while implementing bagging and boosting algorithms on rare disease and left-skewed cost data. The next sections of the paper describe study materials and methods, analysis, results and conclusions.
2. Metarials & Methods
2.1. Aims
- The aim of this study is to compare classification performance of ELMs using rare disease and left skewed cost data. For this aim algorithms which are ID.3, C4.5, CART, NB, KNN, RF, SVM, NN were implemented on thyroid disease data while performing Bagging and Boosting respectively.
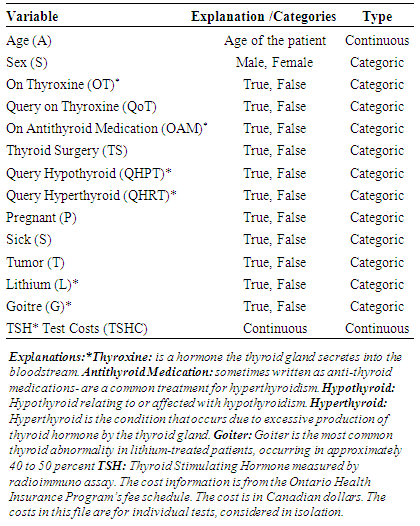
2.2. Dataset
- The thyroid disease dataset came from UCI Machine Learning Repository-Center for Machine Learning and Intelligent Systems. Table 1 shows description of thyroid disease dataset. The thyroid is an endocrine gland in the neck, consisting of two lobes connected by an isthmus. The thyroid gland secretes thyroid hormones, which primarily influence the metabolic rate and protein synthesis. The thyroid disease (ann-thyroid) dataset is a classification dataset. The problem is to determine whether a patient referred to the clinic is hypothyroid [27, 28]. Basal thyroid-stimulating hormone (TSH) test costs for individual patients considered as cost variable. This cost is in Canadian dollars and the cost information is from the Ontario Health Insurance program’s fee schedule (Table 1).
|
2.3. Analysis
- Diagnosed as a hyperthyroid determined as a dependent variable all other variables are determined as covariates. ID.3, C4.5, CART, NB, KNN, RF, SVM, NN were used, 10, 20, 30, 40, 50, 60, 70, 80, 90 and 100 trees were generated for RF. Bagging and Boosting were implemented to improve the accuracy of classification performances. “k” 10 fold cross validation was performed and an area plot was used to visualize prediction performances of ELMs. AUC was used to evaluate classication performance of ensemble methods. All variables are normalized to have zero means and unit variances. This will allow to handle with parameters of different units and scales. Logarithmic transformation implemented to TSH cost data. AUC was used for comparison of classification performances. 5-fold cross validation was performed in the analysis. Prediction performances of different ELMs are visualized on an area graph and Kruskall Wallis variance analysis was performed for comparison of ELMs prediction performance differences.
3. Results
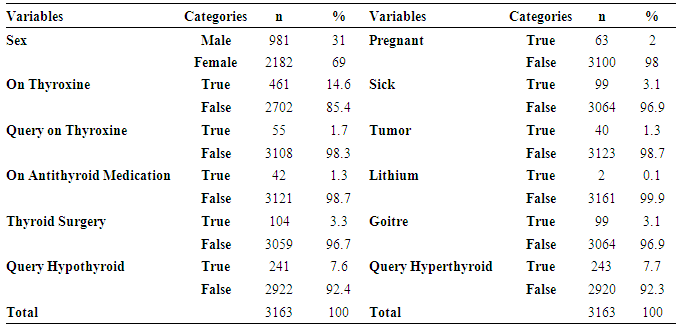
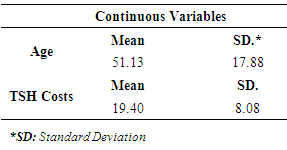
3.1. Descriptive Statistics
- As previously mentioned, in this study being diagnosed by thyroid disease determined as a dependent variable for classification based model. 4.8% (151) of patients were diagnosed by thyroid and called “hyperthyroid” group. However, 95.2% (3012) of them were non-hyperthyroid. Descriptive statistics for predictive variables are as follows: 69% of patients were female, 85.4% of patients didn’t on thyroxin, 98.3% of them didn’t query on thyroxin, 98.7% of them didn’t take antithyroid medication, 96.7% of them didn’t have thyroid surgery, 92.4% of them didn’t query hypothyroid, 98% of them were not pregnant, 96.9% of them were not sick, 98.7% of them didn’t have a tumor, 99.9% of them didn’t have a lithium, 96.9% of them didn’t have a goiter and 92.3% of them didn’t query hyperthyroid. The mean values of continuous predictive variables are as follows; age 51 (±17.88) and TSH costs 19.40 (±8.08). Figure 1 shows distribution of TSH cost data, it is seen that the distribution of TSH cost data is negatively skewed. As a part of preliminary analysis procedure Z transformation was implemented on TSH cost data. After that, natural logarithm (Ln) of TSH cost was taken. It is seen that the distribution of TSH cost data become positively skewed after transformation (Figure 1).
|
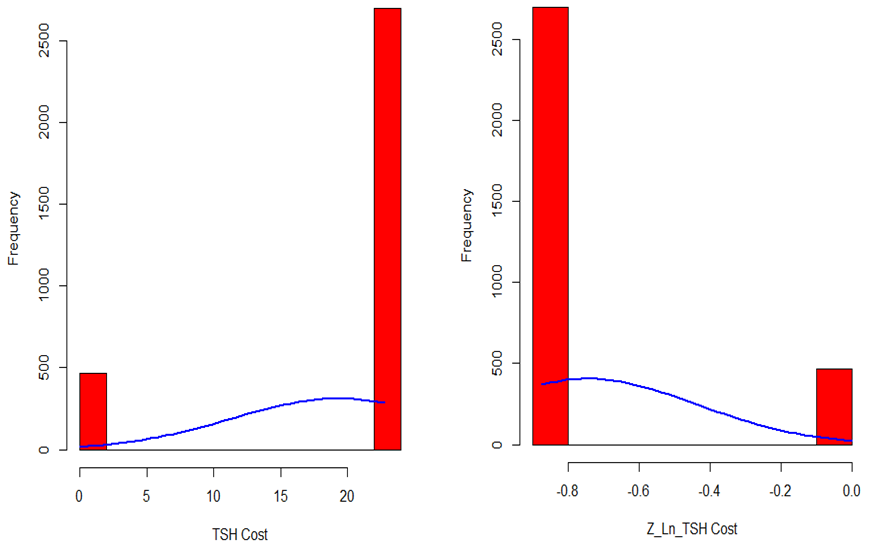 | Figure 1. Distribution of TSH Cost Data |
|
3.2. Correlations between Independent Variables and ELM Performance Comparison
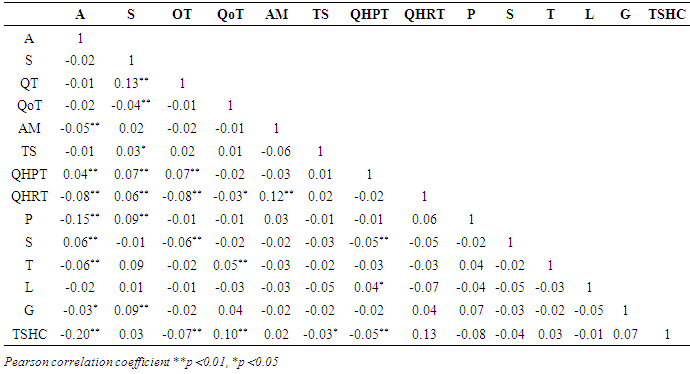
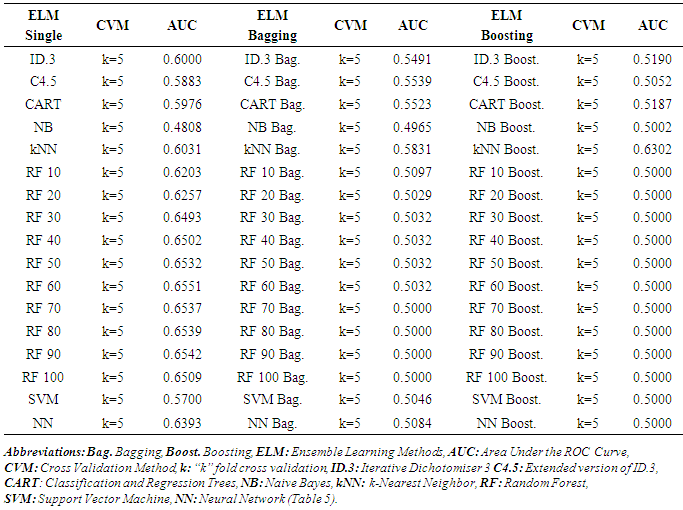
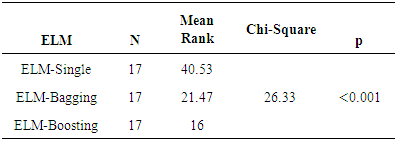
- As a part of preliminary analysis procedure, correlations between independent variables examined by using Pearson correlation coefficient. Standardized Z scores of study variables was used in examination of correlation coefficients of study variables. Table 4 shows matrix of Spearman correlation coefficients of study variables. Literature suggests that the magnitude of 0.70 and higher indicate variables which have high correlations [29]. All correlation coefficients are lower in this table in other words, there is no multi collinearity problem was detected between independent variables. Table 5 shows ELMs performance comparisons. AUC was used as a performance measure and k=5 fold cross validation was implemented as a part of cross validation procedure. Figure 2 visualize performance results differences between prediction methods. Kruskall Wallis variance analysis verifies statistical significance of prediction performance differences between different ELMs.
|
|
|
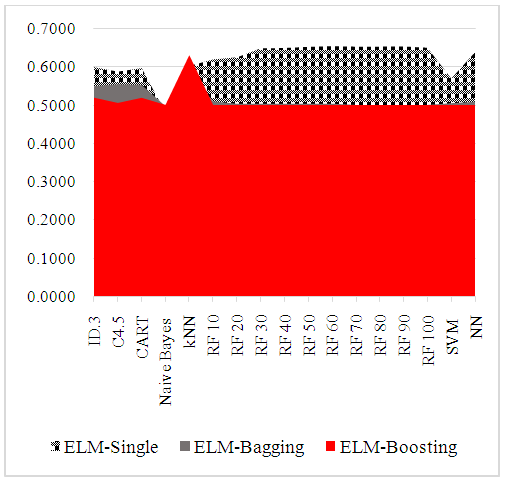 | Figure 2. Comparison of AUC Prediction Performances of ELM |
4. Conclusions
- Rare events and class imbalance are critical to prediction in the field of data mining and particularly data classification [30]. Thyroid disease dataset used in this study which is highly imbalanced. In this data 4.8% of the patients have hyperthyroid, 95.2% of them are not. ELM examined and compared to improve prediction performances and will achieve high classification accuracy. ID.3, C4.5, CART, NB, kNN, RF, SVM and NN were implemented on thyroid disease data. k=5 fold cross validation was implemented to achieve better performance results. Study results show that single ELM have superior performance compared with Bagging and Boosting applications. Moreover kNN, RF and NN have better prediction results compared with other ELM. Despite scholars suggest that “all models are wrong” and “no data are normally distributed” [31, 32]. This study examined a detailed preliminary analysis procedure to overcome measurement unit differences of predictive variables, multicollinearity problem and class imbalance of predictive variable and left-skewed distribution of cost data. Z transformation, Pearson correlation coefficient and natural logarithm of cost data implemented into the dataset. Highly skewed nature of cost data is not a new issue. It is highly believed that parametric models not work to handle highly positive skewed nature of cost data. However, for this study TSH cost data has a left-skewed distribution. QALYs distribution which takes less attention in the literature has heavy left tails the same with TSH cost data in this study. As a part of the preliminary analysis procedure TSH cost data normalized with Z transformation and after that natural logarithm was implemented. After normalization and Ln transformation the shape of TSH cost data became positively skewed. Finally, study results supports that kNN, RF and NN are prior algorithms are to handle imbalanced dataset to predict thyroid disease. A number of studies in the literature supports our study results and emphasize the superior performance of kNN, RF and NN. They have concluded that kNN, RF and NN are computationally efficient and better handle with highly imbalanced dataset. Moreover, they are more vulnerable to noise detection compared with other methods [33]. In addition to that, previous work has demonstrated that Bagging and Boosting are very effective methods for decision trees. However, there has been little empirical testing with NN. Previous authors are concentrated on decision trees due to their fast training speed and well-established default parameter settings [34]. As a support for previous study results, after performing extensive normalization, transformation and cross validation exercises, study results show that three of the ELMs performed well enough to be used in many application. One question is necessary to answer is why kNN was more effective than other classifiers. Horton and Nakai (1997) answers that question and suggests that other classifiers suffer from some shortcomings like data fragmentation and repeatedly partitioning [35]. From the other point of view, as kNN performs well with small number of input variables, but struggles when the number of inputs is very large. Also kNN works well if all the data has same scale. Thus, data normalization is a good idea to improve performance of kNN [36]. Chernozhukov et al. (2016) suggest that modern supervised machine learning methods are designed to solve prediction problems very well [37]. In order to avoid overfitting problem and improve prediction performance results, it is advisable to use a very broad set of ELMs to improve prediction performances. A number of studies in the literature compare prediction performances of different ELM. However, there is little evidence focus on rare diseases as an example of rare events. It is hoped that in the light of this study, future studies will applied aggregated methods on rare disease data to solve rare events problems.