-
Paper Information
- Paper Submission
-
Journal Information
- About This Journal
- Editorial Board
- Current Issue
- Archive
- Author Guidelines
- Contact Us
American Journal of Bioinformatics Research
p-ISSN: 2167-6992 e-ISSN: 2167-6976
2016; 6(1): 19-25
doi:10.5923/j.bioinformatics.20160601.03

Performance Evaluation of Clustering Methods in Microarray Data
 Abstract
 Reference
 Full-Text PDF
 Full-text HTML
Md. Siraj-Ud-Doulah, Md. Bipul Hossen
Department of Statistics, Begum Rokeya University, Rangpur, Bangladesh
Correspondence to: Md. Siraj-Ud-Doulah, Department of Statistics, Begum Rokeya University, Rangpur, Bangladesh.
| Email: |  |
Copyright © 2016 Scientific & Academic Publishing. All Rights Reserved.
This work is licensed under the Creative Commons Attribution International License (CC BY).
http://creativecommons.org/licenses/by/4.0/

DNA microarray experiments have emerged as one of the most popular tools for the large-scale analysis of gene expression. The challenge to the biologist is to apply appropriate statistical techniques to determine which changes are relevant. One of the tools is clustering. Clustering is a method to discern hidden patterns in data without the need for any supervision and in absence of any prior knowledge. Clustering is a popular method for analysis of microarray data. There are several challenges to clustering of microarray data. Unfortunately the results obtained from the common clustering algorithms are not consistent and even with multiple runs of different algorithms a further validation step is required. Due to absence of well-defined class labels, and unknown number of clusters, the unsupervised learning problem of finding optimal clustering is hard. Obtaining a consensus of judiciously obtained clustering not only provides stable results but also lends a high level of confidence in the quality of results. Several base algorithm runs are used to generate clustering and a co-association matrix of pairs of points is obtained using a configurable majority criterion. Synthetic as well as real world datasets are used in experiment and results obtained are compared using various internal and external validity measures. In this paper, results obtained from consensus clustering are consistent and more accurate than results from base algorithms. The consensus algorithm can identify the number of clusters and detect outliers.
Keywords: Consensus Clustering, Linkage, Microarray, Outliers, Validation Indexes
Cite this paper: Md. Siraj-Ud-Doulah, Md. Bipul Hossen, Performance Evaluation of Clustering Methods in Microarray Data, American Journal of Bioinformatics Research, Vol. 6 No. 1, 2016, pp. 19-25. doi: 10.5923/j.bioinformatics.20160601.03.
Article Outline
1. Introduction
- Microarray technology has become one of the most important tools for genome-wide mRNA measurements. Microarray experiments typically involve the measurement of the expression levels of many thousands of genes in only a few biological samples. Often, there are few technical replicates usually because of the relatively high cost of performing microarray experiments [10]. There are also few biological replicates relative to the large number of genes represented on the microarray. The technique has been successfully applied to many areas in modern biology including cancer research, identification of drug targets, and categorization of genes involved in the cell cycle. Nevertheless, the analysis of microarray data is difficult due to the vast dimensionality and the high levels of noise. The need for solid statistical methods is therefore strong [2]. There are several challenges to clustering of microarray data. The high number of objects and the high number of attributes and attribute types make it difficult to analyze the quality of results. Every clustering algorithm makes assumptions regarding the data model. When the assumptions are not satisfied the clustering results become unreliable. The information regarding data domain is not always available. It has been shown that most deviations in clustering results are due to a small proportion of noisy data which could not be filtered out [4]. Moreover the different runs of the same or different algorithms deviate in different directions. A judicious selection of algorithms can guarantee that most results are near-optimal most of the times. Thus there is a strong motivation to combine the various clustering so that the non-standard deviations cancel out. By using a mixture of algorithms, the strength of each algorithm is leveraged [6].K-Means algorithm [9] is easy to implement and works well for large datasets where partitions are well separated but it is sensitive to noise. Also the algorithm depends on initial choice of partition and converges to local minima which may not be optimal. Several modifications have been proposed to overcome the tendency of local minima in K-Means algorithms. Multiple runs using different initial clusters can still result in local minima since the number of true partitions is not known especially with high dimensional microarray data. Hierarchical clustering deterministically returns clustering solution for small datasets. However for large datasets the algorithm performs poorly [11]. The algorithm returns a dendogram but there is no criterion for cutting the tree to determine cluster membership. Cut is made using visual inspection with the knowledge that cut is made at (1-correlation) height when correlation is used as the distance function. Clustering algorithms [12] always return a result. The quality of the result is dependent on various factors such as distribution of data, input parameters, starting condition etc. Since multiple runs of even the same algorithm can return different results, an independent evaluation of the results is required.The consensus clustering approach is based on combining results from multiple runs of the same or different clustering algorithms on the same data. This approach has several advantages over base clustering algorithms. Consistent results provide stable clusters which are dense and well-separated. A high level of confidence can be attributed to the results. Novel results such as outliers and new clusters are obtained, which could not have been attained by any base algorithm alone. Consensus algorithms can be highly optimized for parallel operation. The base algorithms can be run simultaneously and the results combined.
2. Materials and Methods
2.1. Clustering
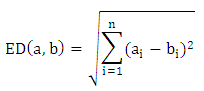
- Clustering is the process of finding patterns or natural groups in datasets. It can be used as an exploratory mechanism for discovering interesting relationships between genes. Clustering can also be used to group experiments e.g. when predicting net survival rates of patients from some disease.Distance MeasuresClustering algorithms group genes based on similarity (or dissimilarity) between genes. Similarity is measured using distances between pairs of genes in the multidimensional space. Some common distance measures are:Euclidean Distance (ED)The straight line geometric distance between points a and b in n-dimensional space is calculated using Pythagorean Theorem [7].
 Pearson Correlation Coefficient (PCC)Pearson Correlation Coefficient is a value for the quality of finding best-fit by minimizing sum of squares from the best-fitting curve. For two variables it is defined as the ratio of covariance of the variables to product of their standard deviations [7].
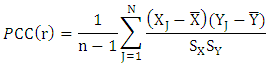 Spearman Rank Correlation Coefficient (SRCC)Spearman Rank Correlation Coefficient is a nonparametric procedure of measuring dependence between variables. It is similar to Pearson correlation coefficient except that it works on rank-order of variables. It is less sensitive to outliers and independent of assumptions about distribution of data [3].
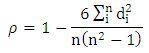 Kendall tau Rank Correlation Coefficient (KTRCC)Kendall tau Rank Correlation Coefficient is another nonparametric procedure for measuring dependence of variables using hypothesis test. It is more intuitive and easier to calculate than Spearman Rank Correlation Coefficient. A pair of data points is considered concordant if the values increase (or decrease) in all dimensions [9]. If the value of one point is higher in one dimension while that of other point is higher in another dimension, the pair is called discordant.
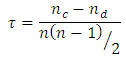
2.2. Linkage Rules
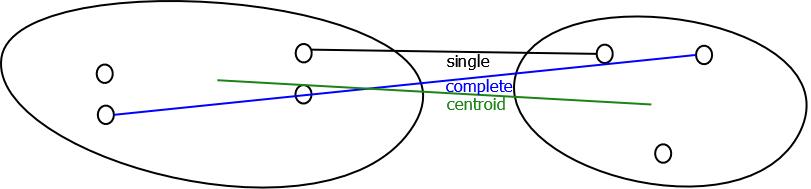
- There are several rules to determine how to apply the distance metric for finding distance between objects and intermediate clusters or the distance between clusters [11].Single LinkageThe distance between two nearest neighbors in different clusters is considered the distance between the clusters.Complete LinkageThe distance between two farthest neighbors in different clusters is considered the distance between the clusters.Average LinkageFor any pair of clusters, average linkage is the average of distances between all element pairs such that the element pair comprises of one element from each cluster.Centroid LinkageThe distance between two clusters is the distance between the centroids of the clusters.
 | Linkage Rules |
2.3. Types of Clustering
- If the elements in a cluster can belong to only one cluster, the clustering is considered hard or exclusive. When clusters are allowed to overlap the clustering is considered soft or fuzzy. When not all elements belong to a cluster (outliers or unclustered), the clustering is considered as partial. When all elements belong to a cluster, the clustering is considered complete. When clusters could be nested (subclusters), hierarchical clustering is obtained while unnested clusters result in partitioned clustering. All the features are generally used simultaneously to calculate distances (polythetic) but features are used sequentially (monothetic) by some algorithms [8].Clustering AlgorithmsSeveral clustering algorithms are available based on clustering types and methodologies (model-based, grid-based, density-based, agglomerative, divisive etc.). K- Means and Hierarchical algorithms are two commonly used approaches for clustering gene expression data.K-Means AlgorithmThe K-Means algorithm is a partitioning algorithm where the number of clusters, k, is provided a priori. The algorithm initializes k elements as cluster centroids and iteratively adds elements to the nearest centroid. The centroids are updated and the steps are repeated until centroids stabilize. The centroid that optimizes the scatter has been shown to be the mean of cluster elements [6].Hierarchical AlgorithmAlthough a divisive (top-down) approach is sometimes used, the agglomerative approach is more common [6].
2.4. Identifying better Clusters
- When different results are obtained by iteratively running same or different algorithms, quality measures to identify better results are needed. Several statistical indexes have been proposed for measuring the quality of clustering [13]. The validation indexes can be divided into external and internal validation indexes.Internal Validation IndexesThese methods validate individual clustering using the clustering result and input data. Clusters are expected to be compact (low within-cluster distances) and well scattered (high between cluster distances).Dunn’s Validity IndexDunn's Index measures how compact and well-separated clusters within a clustering are. Higher value of Dunn’sindex implies that clustering’s are more compact and separated [3].
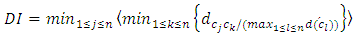
 = distance between clusters k and j
  = intercluster distance of cluster l
 = number of clustersSilhouette WidthFor any element the Silhouette value shows ratio of measures by which average between cluster distances exceeds within cluster distance [3].
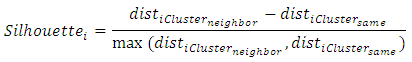 Where
Where = average distance of element average distance of element i to other elements in same cluster
 = average distance of element i to elements in its nearest neighboring clusterHubert Gamma StatisticHubert Γ is defined [14] as
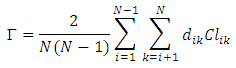 Where
Where = distance between elements i and k
 = distance between clusters to which elements i and k belong (represented by centroids)EntropyAssuming that a point has equal probability of belonging to any cluster, the entropy of a clustering is defined as [14]:
 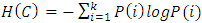 , Where
  , K = number of clusters
2.5. Clustering Aggregation
- The results from clustering algorithms are not consistent and it is difficult to ascribe any level of confidence to the results. Hierarchical clustering are not suitable for larger datasets although for small datasets the results are reproducible [3]. Partitioning algorithms such as K-Means and EM perform well on large datasets but results are not consistent since the algorithms converge to local minima. K-Means algorithm performs poorly with noisy data [9]. Using validation indexes clustering quality can be accessed and clustering can be compared. Outliers often can distort results but constitute very small part of the data. Using repeated runs and reasonably good starting criteria (for K-Means) there is an incentive to aggregate the clustering.Best ClusterBest cluster algorithm is a 2-approximation algorithm. Given k input clustering where any clustering can have at most m clusters, the run-time is O (mk).Consensus ClusteringConsensus clustering is an optimization strategy wherein edges with high weights (>0.5) are cut while trying to preserve edges with low weights. Individual clustering results can contain random errors. When several runs of different algorithms are made, the systemic errors in experiment can be distributed in results [5]. Since the erroneous output is less common and error distribution varies between results, a consensus can filter out the errors and consistently return results that are nearly optimal.Agglomerative Clustering AlgorithmThe agglomerative consensus algorithm generates a true consensus by using majority vote (dissimilarity proportion < 0.5). At worst it is a 2-approximation algorithm. The algorithm has a runtime of O (n2 log n). Normalized Kappa Statistic is optionally used to calculate the relative significance of input clustering [5]. Clustering with κ< 0.0 are assigned a weight 0 (pruned). The remaining clustering are weighted using the normalized κ. The calculation of Kappa Statistic does not affect run-time.Local Search AlgorithmLocal Search algorithm uses Best Cluster to obtain a starting partition. The starting condition is important since Local Search algorithm iterates until no further improvement in cumulative distance to input clustering is possible. The algorithm is computation intensive and has a O (n!) run-time. The algorithm is not suitable for large dataset due to computational constraints [6].Weighted Consensus ClusteringThe problem of finding a clustering that minimizes disagreements with a given set of clustering can be generalized. Each object to be clustered can be considered as the vertex of a graph with weighted edges connecting it to other objects. The weight of an edge represents the fraction of input clustering that place the two vertices it connects in different clusters [6].
3. Results and Discussion
3.1. Consensus on Hierarchical Clustering (Melanoma Dataset)
- The melanoma dataset has taken from [1], which contains 3613 gens and 31 experiments. The original Bittner paper used control datasets [7] and originally contained 8150 cDNAs of which 6971 were unique genes. Only 3613 genes were found to have measurable gene expressions. Checking the cluster of the consensus on Hierarchical Clustering by using various linkage rules as well as distance measures to a set of data, that is, I will find out how well the clustering methods identify the cluster in the melanoma dataset. Recheck the appropriate measure in the data set, which graphical results have shown in Figure 1. From Figure 1 demonstrates that the data display very similar results were obtained using cluster. The only variation observed was for case #M93-007, which was not found to be a member of the tight melanoma cluster except when clustering method was average linkage with respect to distance metric was changed to Spearman Rank Correlation coefficient (SRCC). But it is noteworthy that [1] determined 19 samples to be clustered and 12 samples to be unclustered. Out of 3613 genes, 182 genes were identified to be significant by assigning weights to genes that would result in compact clusters with high inter-cluster distances. The weight function used was similar to t-statistics (but adding square roots instead of root of sums squared). The author predicted the metastatic ability of cancer based on the membership in cluster. Thus the consensus result also does not cluster case# M93-007 to be part of the tight melanoma cluster.
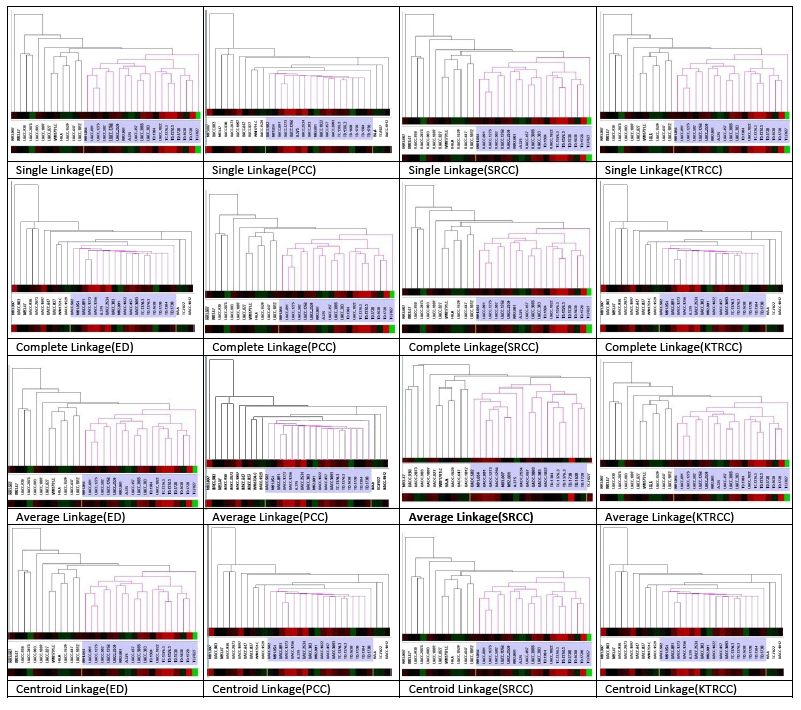 | Figure 1. Linkage Rules (Distance measures) |
3.2. Consensus on Hierarchical Clustering (Yeast Dataset)
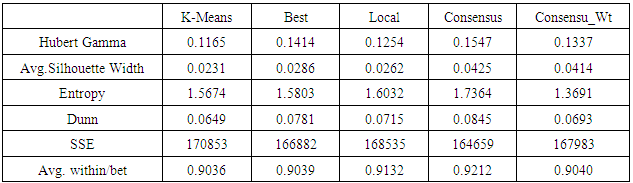
- The yeast dataset from the seminal work by [4] was used as a real world dataset. Less that 1% of values was missing and was replaced by average values. The yeast dataset contained 2467 genes and 79 experiments. The analysis of result using various algorithms with validation indexes is shown in Figure 2 and Table 1.
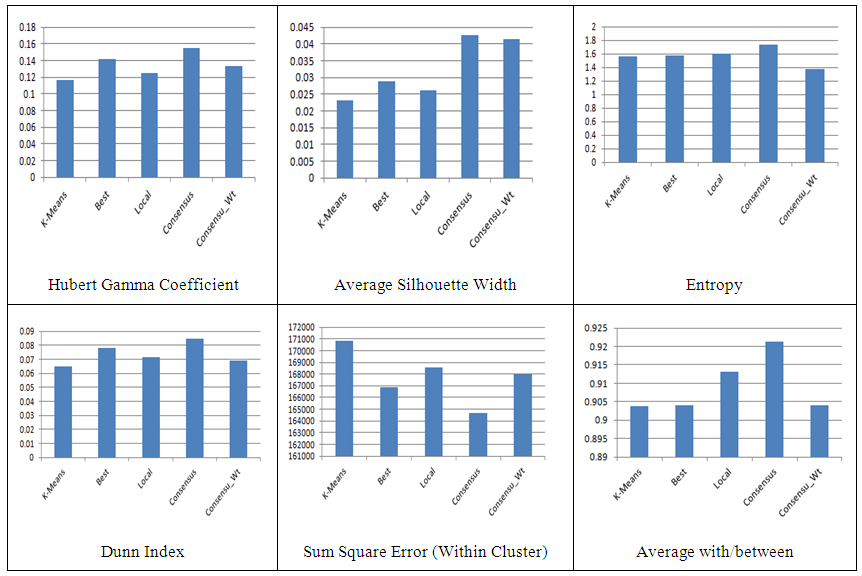 | Figure 2. Clustering Algorithms (Validation Indexes) |
|
3.3. Consensus on Artificial Dataset
- Multiple runs of K-Means algorithm with value of k (number of clusters) ranging from four to six were performed on artificial dataset. The artificial dataset was generated to have six tight clusters by randomly generating values around six well separated points in two-dimensions. As expected when K-Means algorithm was run with k < 6, neighboring clusters were merged (Figure 3). Since the merges were random and multiple runs generated merger of different clusters, the consensus clustering correctly identified the six clusters (Figure 4). Twenty runs of K-Means algorithm were performed and consensus obtained.
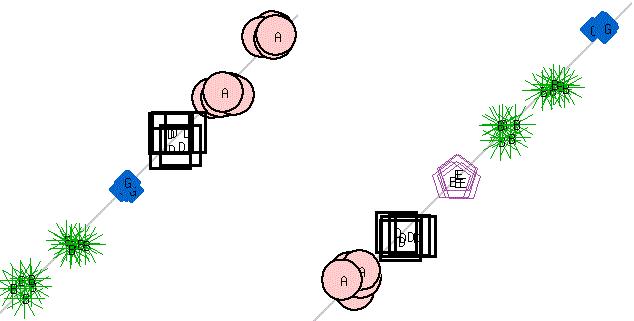 | Figure 3. K-Means clustering (k=4 & k=5) |
 | Figure 4. Consensus Clustering |
4. Conclusions
- The results are compared by applying consensus clustering on melanoma, yeast and artificial datasets against the results obtained from base algorithms (K-Means and Hierarchical algorithms). The samples and genes were clustered. The size of datasets can be considered as medium size but the algorithms can scale to large sized dataset. Using several performance results obtained from consensus clustering are consistent and more accurate than results from base algorithms. The consensus algorithm can identify the number of clusters and detect outliers.
ACKNOWLEDGMENTS
- The authors would like to thank the anonymous reviewers whose constructive comments greatly improved the presentation of the paper.