-
Paper Information
- Paper Submission
-
Journal Information
- About This Journal
- Editorial Board
- Current Issue
- Archive
- Author Guidelines
- Contact Us
American Journal of Bioinformatics Research
p-ISSN: 2167-6992 e-ISSN: 2167-6976
2016; 6(1): 1-13
doi:10.5923/j.bioinformatics.20160601.01

Computational Statistics Assessing the Relationship between Different Rhizobacteria (Pseudomonas fluorescens) Treatments in Cereal Cultivation
 Abstract
 Reference
 Full-Text PDF
 Full-text HTML
Noel Dougba Dago 1, Nafan Diarrassouba 1, Anatole Kanga Nguessan 2, Baba-Moussa Lamine 3
1UFR Sciences Biologiques, Université Péléforo Gon Coulibaly, Korhogo, Cote d’Ivoire
2Centre National de Recherche Agronomique (CNRA), Abidjan, Côte d’Ivoire
3Laboratoire de Biologie et de Typage Moléculaire en Microbiologie, Faculté des Sciences et Techniques, Université d’Abomey-Calavi, Cotonou, Benin
Correspondence to: Noel Dougba Dago , UFR Sciences Biologiques, Université Péléforo Gon Coulibaly, Korhogo, Cote d’Ivoire.
| Email: |  |
Copyright © 2016 Scientific & Academic Publishing. All Rights Reserved.
This work is licensed under the Creative Commons Attribution International License (CC BY).
http://creativecommons.org/licenses/by/4.0/

Several studies showed the importance of rhizobacteria (P. fluorescens) associated to natural fertilizer improving cereal production in poor and arid soils. However, agriculture crops prediction by statistical models remains an adequate system to assess the performance of bio-fertilizer used in farming practices. Indeed, the large amount of data to process in this context allowed the integration of computers in the statistical analysis schemes. Computational statistic can be defined as the explicit impact of computers on statistical methodology. Here,we developed a bioinformatics pipeline in R bio-statistic environment assessing the relationship between previous analyzed rhizobacteria (P. fluorescens) treatments (T0: treatment without any rhizobacteria and any foliar bio-fertilizer, T1: treatment with only rhizobacteria, T2: treatment with both rhizobacteria and foliar bio-fertilizer and T3: treatment with only foliar bio-fertilizer)and their potential influences on growth and yield parameters of both maize and soybean cereal varieties in arid soil in the north of Côte d'Ivoire. Then, the present survey basing on the computational statistic approach, highlighted a strong difference between the four considered rhizobacteria treatments impacting the two analyzed cereal crops and development process (p-values < 0.05). Moreover, the same analysis suggested a positive and selective effect of rhizobacteria (P. fluorescens) combined with foliar bio-fertilizer on both quantitative and qualitative production of analyzed cereal crop varieties. Indeed, we were able to demonstrate the differences between maize and soybean crops replying torhizobacteria (P. fluorescens) bio-fertilizer treatments. Further, the present developed pipeline showed that the two analyzed varieties of soybean (green and yellow soybean) were differentially influenced by the different rhizobacteria treatments as opposed to maize plant varieties (p-value < 0.05). Finally our findings evidenced that disregarding analyzed parameters and cereal varieties, treatment T2 having the recommended dose of rhizobacteria P. fluorescens+ foliar fertilizer compost recorded the best performance improving both maize (Zea mays. L) and soybean (Glycine max) cereals cultivation in arid region. In conclusion this study demonstrated the key role of rhizobacteria (P. fluorescens) combined with foliar bio-fertilizer improving cereal production in soil with low fertility aptitude, adjusting the concordance between both growth and yield parameters.
Keywords: Rhizobacteria (P. fluorescens) Treatments, Maize Zea mays. Land Soybean Glycine max Cereal, Yield and Growth Parameters, Computational Statistic Pipeline
Cite this paper: Noel Dougba Dago , Nafan Diarrassouba , Anatole Kanga Nguessan , Baba-Moussa Lamine , Computational Statistics Assessing the Relationship between Different Rhizobacteria (Pseudomonas fluorescens) Treatments in Cereal Cultivation, American Journal of Bioinformatics Research, Vol. 6 No. 1, 2016, pp. 1-13. doi: 10.5923/j.bioinformatics.20160601.01.
Article Outline
1. Introduction
- Arable farming in some West Africa countries are analysed according to the potential of the natural resources [1]. It is demonstrated that low soil fertility is often the major constraint for production, both for food grains (cereal) and natural vegetation. However, arable farming without the use of external inputs (i.e. used of bio-fertilizer) increasingly exhausts the soil, with the risk of degradation. It is augured that the only remedy for cereal agriculture in the arid regions is increased production per unit area by the use of the external inputs. Then, as above mentioned, our previous analysis suggested that the use of bio-fertilizer such as rhizobacteria (P. fluorescens) combined with foliar bio-fertilizer (rhizobacteria + foliar bio-fertilizer) as external input in agriculture in arid regions in the north of Côte d'Ivoire, a West African country, improved the rate of maize (Zea may L.) production [2]. Indeed, bio-fertilizer are found positive contribution to soil fertility, resulting in an increase of cereal crop (food grains)yield without causing any environmental, water or soil pollution hazards [3]. Research work has already been undertaken on the potential effect of bio-fertilizers on crop yields. However, plant growth results from interaction of roots and shoots with the environment. The environment for roots is the soil or planting medium which provide structural support as well as water and nutrients to the plant. Roots also support the growth and functions of a complex of microorganisms that can have a profound effect on the growth anti survival of plants. These microorganisms constitute rhizosphere microflora and can be categorized as deleterious, beneficial, or neutral with respect to root plant health [4]. Beneficial interactions between roots and microbes do occur in rhizosphere and can be enhanced. Increased plant growth and crop yield can be obtained by inoculating seeds or roots with certain specific root-colonizing bacteria plant growth promoting rhizobacteria [2, 4]. Rhizobacteria P. fluorescens is used as bio-fertilizers because of it vital role maintaining long term soil fertility could be requested for many agricultural soils in the north of Côte d'Ivoire where soil fertility is often the major constraint for food grains cereal production. Certainly, several assays proved that rhizobacteria (P. fluorescens) united with foliar bio-fertilizer impact positively maizecereal production in several arid soils and regions in some West Africa countries [2, 5]. Moreover, rhizobateria P. Fluorescens combined with bio-fertilizer are essential for obtaining good yields avoiding depleting the soil [2, 3]. Nevertheless, advances in information technology have propelled the integration of bioinformatics sciences with statistical methodology analysis in agriculture studies, especially in the area of crop improvement [6]. Then, computational statistics tool and methodology defined as the explicit impact of computers on statistical methodology, results a useful approach analyzing and predicting both cereal agriculture performance and yield [7]. Here, we developed a pipeline in R (version 3.2.2) (statistical software) environment with the aim to highlight the influence of our previous analyzed rhizobacteria P. fluorescens bio-fertilizer treatments in both maize (Zea mays. L) and soybean (Glycine max) cereals cultivation because of their prominence in food self-sufficiency propose and high quality of vegetal protein providing to the under-developed countries population and in particular for the north population of Côte d'Ivoire, where cereal plants production meanly facing many constraints such as soil fertility [2]. The present developed computational statistic pipeline includes several scripts developed in R environment and several bio-statistical functions such as R fitting curve, parallel principal component analysis, individuals and variables factor principal component map analysis and heat-map of Euclidiandistance Pearson correlation analysis. Indeed for the present study, 9 factors classified in yield and growth parameters, have been processed by the present developed pipeline assessing the effect of rhizobateria P. fluorescens, rhizobateria P. fluorescens+ foliar bio-fertilizer and foliar bio-fertilizeron both maize (Zea mays. L) and soybean (Glycine max) cereal varieties development and yield ratio in arid soil.
2. Materials and Methods
2.1. Experimental Procedure and Plant Material
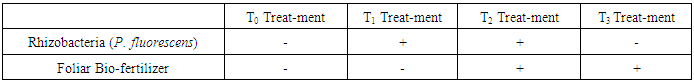
- Experimental site characteristics and experimental design: the experiments of the present study were carried out at the Farm in Napiéledougou (Department of Korhogo north of Côte d'Ivoire). This experimental site is located between an average altitude of 392 meters between - 5°34'31" and - 5°29'34 '' West longitude and between 9°31'23'' and 9°31'32'' latitude North and 5°38' 83.2'' at an average altitude and is far 40 Km distance from Korhogo. The climate of the analyzed area is the maritime sub-equatorial with the temperatures comprised between 24 and 33°C. The annual precipitations fluctuate between 1100mm and 1600 mm. The two analyzed maize (red and white maize) and soybean (green and yellow soybean) varieties seed were provided by the National Center of Agronomic Research (CNRA Côte d'Ivoire). The experimental design consisted in a block of 4 treatments and 4 repetitions for the two analyzed maize (Zea mays. L) and soybean (Glycine max) cereal crops. The two blocks corresponding to each of the two analyzed maize and/or soybean varieties were divided into 16 basic plots corresponding to the four under-investigated rhizobacteria treatments (treatments T0, T1, T2 and T3). The space between the ridges was 75 cm between rows and 40 cm between bunches with 2 plants per hill after thinning. The different treatments covered each elementary plot of 4m x 4m (16 m²). Each elementary plot contained 4 lines of 4 m long.Rhizobacteria (P. fluorescens) bio-fertilizer treatments: effects of rhizobacteria treatmentsT0: plots planted without rhizobacteria (P. fluorescens) and without foliar fertilizer; T1: subdivision sown with the seed inoculated with rhizobacteria (P. fluorescens) only; T2: land sown with the seed inoculated with rhizobacteria (P. fluorescens) bio-fertilizer and foliar fertilizer; and T3: subdivision without rhizobacteria (P. fluorescens) bio-fertilizer with foliar fertilizer only have been evaluated for both growth and yield parameters of the two considered maize and soybean cereal crops. Table 1 (see below), summarizes the combination of the four above mentioned rhizobacteria (P. fluorescens) treatments. However, it is noteworthy to underline that handling the present experiments a regular weeding was performed to hold each plot.
|
2.2. Statistical Analysis of Data and Computational Statistic Pipeline Development
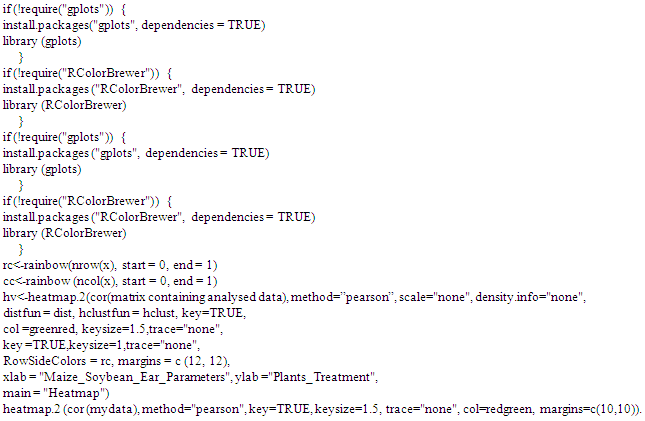
- Data normalization process: data for the present experiment were statistically analyzed basing on several scripts in R [8] statistical package (R environment). However, before performing the current statistical survey, we performed data normalization analysis applying logarithm transformation. Instatistics, normalization refers to the creation of shifted and scaled versions of statistics, where the intentionis that these normalized values allow the comparison of corresponding normalized values for different datasets in a way that eliminates the effects of certain gross influences, as in ananomaly time series [7, 9]. Here we performed a logarithm transformation of both analyzed growth and yield parameters data with the aim to simplify their comparison and management assessing the effect of rhizobacteria (P. fluorescens) bio-fertilizer treatments on maize (Zea mays. L) and soybean (Glycine max) cereal varieties development and production.Pipeline development in R (V 3.2.2) environment: the present developed bioinformatics pipeline analysing the rhizobacteria effect on cereals growth and yield in arid soil includes several packages and functions of R bio-statistic software [8]. Heat-map (gplots package, version 2.12.1. License: GPL-2) based on Euclidian distance of Person correlation has been considered in the present analysis to assess the agreement (concordance) and/or disagreement between rhizobacteria (P. fluorescens) treatments evaluating maize (Zea mays. L) and soybean (Glycine max) growth and production parameters. The script of the above mentioned heat-map analysis developed in R environment was reported as following (see below):
 Next we achieved a Multivariate Exploratory Data Analysis (MEDA). For this purpose data mining FactoMineR package which offers a large number of functions for exploratory factor analysis [10] has been used. This survey includes the use of both quantitative and qualitative variables (our analyzed parameters), as well as the inclusion of supplementary variables and observations. Here we included Multivariate Exploratory Data Analysis (MEDA) in the developed pipeline linking individual factors (the different rhizobacteria P. fluorescen treatments) and variable factors (both growth and yield parameters of the two considered maize Zea mays. L and soybean Glycine maxcereal plants). The script of MEDA is here reported (see below):
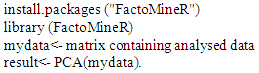 Furthermore, determining the number of factors to extract a crucial decision in exploratory factor analysis is how many factors to extract [11, 12]. The nFactors package offer a suite of functions to aid in this decision [13]. Here we summarized the n factors parallel principal component analysis (PCA) in R statistical software environment as followed:
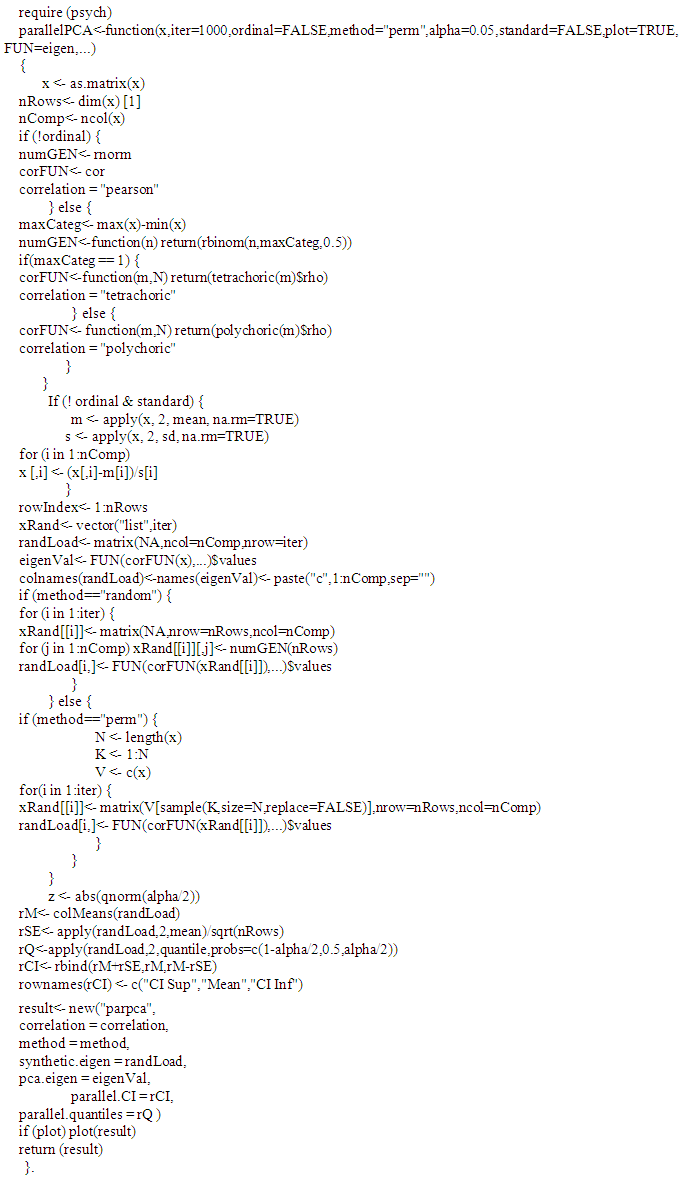 Next we processed an analysis based on corrplot package from R software [8], testing the above mentioned and detected factors or/and components in parallel principal component analysis (parallel PCA) assessing variance difference between considered and analysed rhizobacteria P. fluorescen treatments improving both soybean (Glycine max) and maize (Zea mays. L) cerealcrops varieties. The developed script for this survey has been reported as below:
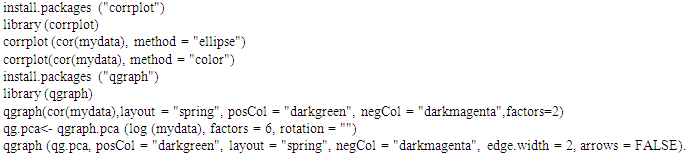 Linear regression and R fitting curve analysis: we archived R fitting curve survey on R (version 3.2.2) environment to weigh the relationship between the four analyzed rhizobacteria treatments T0, T1, T2 and T3, predicting both maize and soybean cereal varieties yield by growth parameters. However, R fitting curve script performed in Dago D.N. et al. (2015) [14] was used and adapted for the present analysis. Moreover, in the same tendency, we archived a linear regression analysis directing to explain and/or predict yield parameters by growth factors or Vis versa, considering the two analyzed maize and soybean cereal varieties. Indeed, the present developed linear regression analysis evaluating the relationship between growth and yield parameters by rhizobacteria, exploited the script developed by Dago D.N. et al. (2015) [7]. For this survey, lm (linear model) function from R (version 3.2.2) statistical package has been used [8]. Print summary function of the above mentioned linear modelscript function allowed to evaluate via Fisher and student statistical tests, the stability of developed linear regression models [7].
3. Results
3.1. Rhizobacteria (P. fluorescens) Treatments Impact on Analysed Cereals by Pearson Correlation Heat-map
- We evaluated rhizobacteria (P. fluorescens) treatments effects on each maize (Zea mays. L) and soybean (Glycine max) cereal cropsvarieties. The present investigation showed a weak agreement (low correlation) between both analysed maize Zea mays. L and soybean Glycine max in response to rhizobacteria bio-fertilizer stimulus (R coefficient of Pearson correlation values vary from-0.5 to 0.5; P > 0.05) as reported in Figure 1. Indeed, analysed maize varieties (red and with maize) exhibited homogeneous behaviours exhibiting a high Pearson correlation among themselves as opposed to considered soybeanvarieties (green and yellow soybean) in response torhizobacteria (P. fluorescens) bio-fertilizer stimulus (Fig. 1). Moreover, it is noteworthy to observe that both yellow and green soybean varieties displayed a distinct reaction to rhizobacteria bio-fertilizer treatments. In the other words, rhizobacteria (P. fluorescens) bio-fertilizer treatments incite different effects on the two analysed soybean varieties (p-value < 0.1) as opposed to those of maize (red and with maize) varieties (p-value > 0.1). Furthermore, the present analysis highlighted the robust heterogeneity between processed rhizobacteria (P. fluorescen) treatmentsT0, T1, T2 and T3 (see also Fig. 2), disregarding the two analysed maize (Zea mays. L) and soybean (Glycine max) cereal varieties, expected analysed maize varieties under T0 treatments (Fig. 1). These results and observations suppose the incapacity of rhizobacteria (P. fluorescens) treatment T0 to distinguish between considered maize (Zea mays. L) varieties. This finding confirmedour previous results [2]. Taking together, the present survey showed a high heterogeneity between the four analysed rhizobacteria (P. fluorescens) bio-fertilizer treatments (treatmentsT0, T1, T2 and T3) assessing both maize and soybean growth and yield parameters performances in arid soil. The same analysis suggested a high sensibility of soybean (Glycine max) varieties replying to rhizobacteria (P. fluorescen) treatments stimulus with respect tomaize Zea mays. Lvarieties.
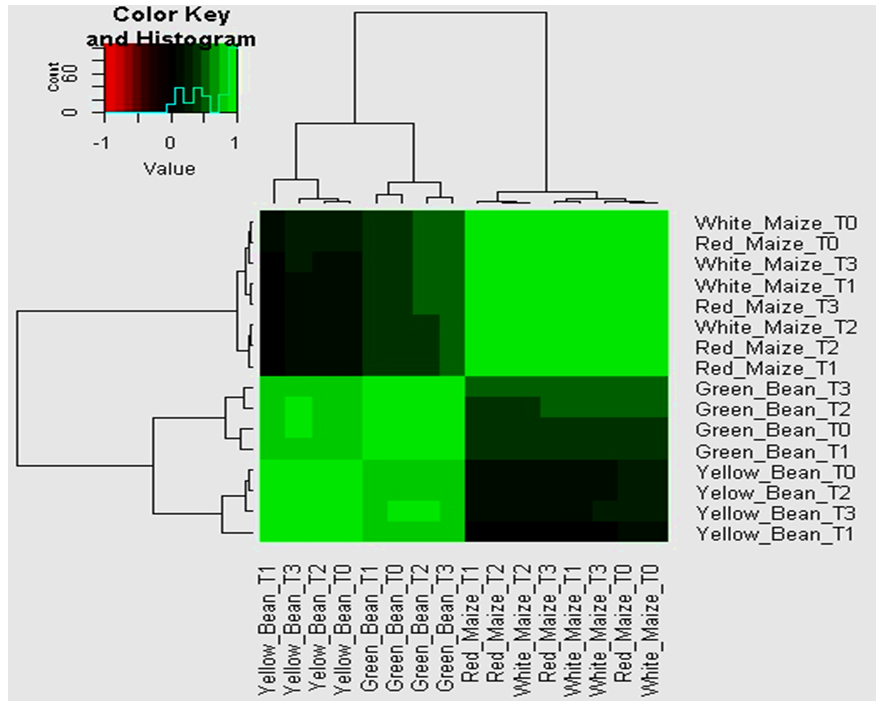 | Figure 1. Heatmap of Pearson Correlation analysis evaluating the effect of rhizobacteria (P. fluorescens) treatments on both maize and soybean crop varieties |
3.2. Relationship between Rhizobacteria (P. fluorescens) Treatments (individual factor) and both Maize and Soybean Growth and Yield Parameters (variable factors)
- Here, we analysed the relationship between rhizobacteria (P. fluorescens) treatments (treatments T0, T1, T2 and T3) and both growth and yield parameters of maize and soybean cereal varieties by a principal component analysis. This analysis discriminated3 tendencies or groups; (i) green soybean, (ii) yellow soybean and (iii) both red and with maize, assessing rhizobacteria (P. fluorescens) treatments performances on both maize and soybean growth and yield parameters (Fig. 2 panel A). In other words, rhizobacteria (P. fluorescens) stimulus induces a significance difference between (i) green soybean, (ii) yellow soybean and (iii) both maize varieties (red and with maize together) (Fig. 2 panel A). Indeed, the present analysis showed a significant variability between both analysed green and yellow soybean cereal varieties as opposed to maizecereal varieties (p-value < 0.05). Moreover, the same investigation allowed to classify both growth and yield parameter in 3 different categories supposing a high agreement between (i) leaves and ear (pod) number, (ii) ear (pod) diameter and ear (pod) length and (iii) ear (pod) wide, leaves length, plant high, diameter and grain/seed number (Fig. 2 panel B). Considering as whole, the present results suppose a high stability of maize varieties reacting to rhizobacteria (P. fluorescens) bio-fertilizer treatments in comparison to soybean varieties, when both yield and growth parameters were investigated.
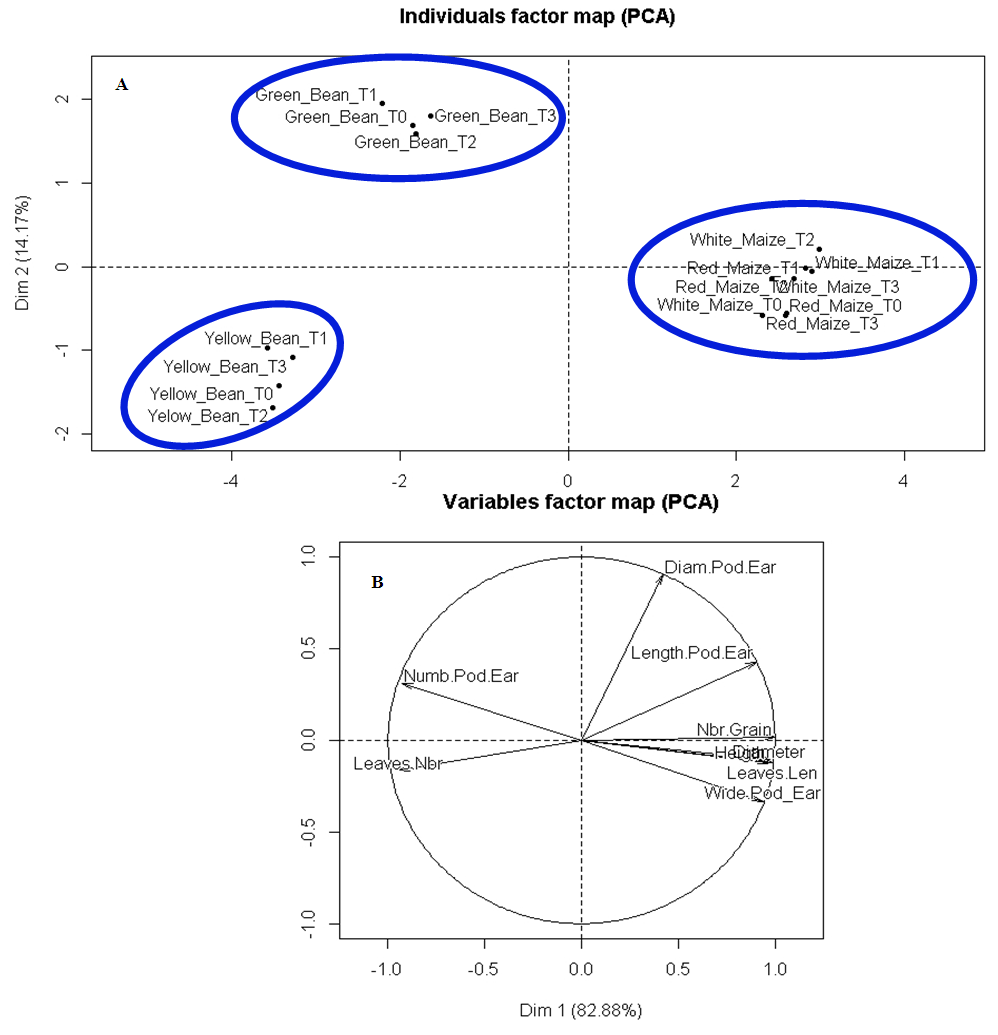 | Figure 2. PCA factor map analysis evidencing the concordance/disagreement between different rhizobacteria (P. fluorescens) treatments, growth and yield parameters of maize Zea mays. Land soybean Glycine maxcereal varieties |
3.3. Assessment of Components Number Evaluating the Relationship between Analysed Cereal Varieties and Rhizobacteria (P. fluorescens) Treatments
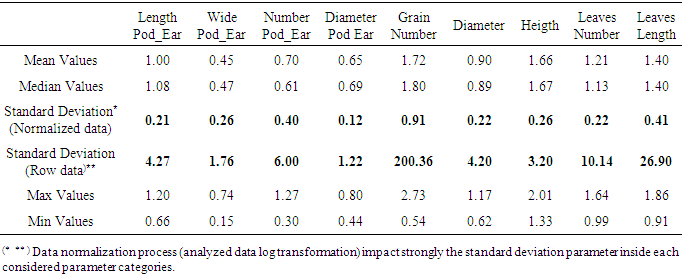
- A crucial decision in exploratory factor analysis is how many factors to extract. Parallel analysis in principal component analysis survey is a useful method to established the number of principal component needed in a multi-variant statistical analysis in which theoretical estimate variance is computed and compared to observed (real variance) or experimental data. The output file of this analysis is a scree graph as reported in figure 3, where both theoretic (gray dots) and observed (black dots) variance values were compared (Fig. 3 panel A). For this survey only two analyzed components (two parameters or components out nine), displayed experimental observed data higher than median value of their theoretic data (Fig. 3 panel A and B). Indeed, seven components in the present survey appear to be wrong estimators evaluating the effect of rhizobacteria (P. fluorescens) bio-fertilizer on both maize and soybean crop varieties growth and production process. In fact these parameters seem to favor theoretic data (virtual situation) with respect to observed and real data (Fig. 3 panel B). Moreover, the same survey discriminated a unique optimal coordinate (Fig. 3 panel B). Further, basing on the standard deviation parameters, we showed that variance proportion associated to both first and second components (Comp1 and Comp2) are 0.83 and 0.14 respectively (p-value <0.05). Then, the cumulative proportion of variance considering these two components is estimated to 0.97 (p-value < 0.05). In other words two factors (both Comp1 and Comp2) should be enough to explain variance difference observed between analyzed growth and yield parameters assessing rhizobacteria (P. fluorescens) bio-fertilizer treatments performance in both maize and soybean cereals development. Finally, merging the above described results with descriptive statistic data reported in table 2 (see below), we suggested that (i) grain number parameter as first component (Comp 1) represents the optimal coordinated of the present parallel principal component analysis (Fig. 3 panel B) (ii) and that both yield and growth parameters were stronglyable to predict and discriminate (at 97 percent) rhizobactria (P. fluorescens) bio-fertilizer treatments effects on the presentanalyzed cereal varieties.
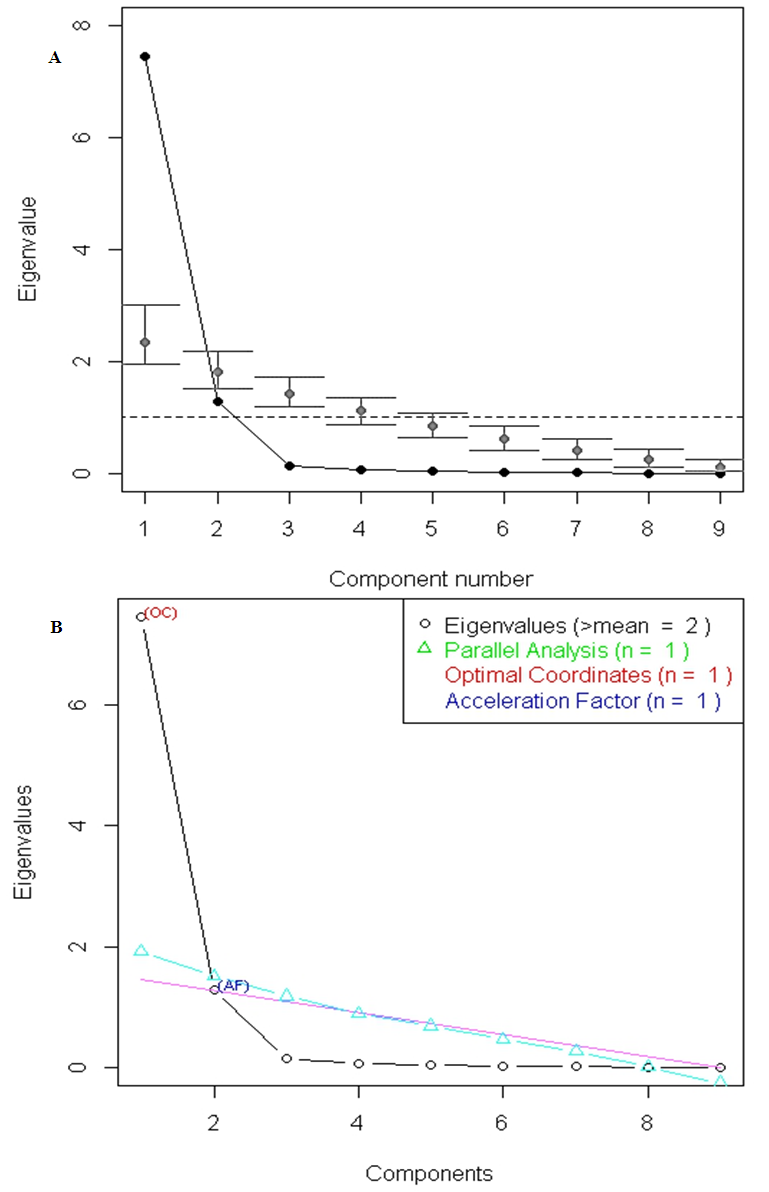 | Figure 3. Parallelprincipal component analysis (PCA) extracting the number of needed factor (s) or component (s) |
3.4. Relationship between Maize and Soybean Varieties under Rhizobacteria (P. fluorescens) Treatments by Detected Needed Components
- We performed a relationship analysis between considered rhizobacteria P. fluorescens bio-fertilizer treatments and each analysed parameter (growth and yield parameters) of both maize and soybean cereal plant varieties (16 combinations in total) via principal component analysis assessing component 1 and component 2 (see above Fig. 3 and table 2). As expected, grain number parameter (yield parameter) detected as first component (Comp1) results to be significantly differentially influenced (p-value <0.05) between both analysed maize and soybean cereals replying to rhizobacteria (P. fluorescens) bio-fertilizer treatments (Fig. 4). Moreover, we performed a statistical student test considering the first component (Comp1; grain number parameter) as the statistical variable, highlighting the discrepancy between both analysed maize and soybean varieties reacting to rhizobacteria (P. fluorescens) treatment stimulus (p-value<0001). Furthermore, figure 4 in concordance with our previous results suggested that the second component parameter (leaves length) was also able to explain variance difference revealed between maize and soybean treated plants. Indeed, this observation was in agreement with performed statistical student test (p-value<0.05) assessing the difference between both maize and soybean crops production when Comp 2 (leaves length) was processed as statistic variable. It is remarkable to note that considering our previous results, both component 1and 2 (grain number and leaves length) were not able to discriminate the difference between the two considered maize varieties (p-value>0.05) as opposed to the two analysed soybean varieties (p-value<0.05). These results confirm the right way discriminating needed components weighing the effect of rhizobacteria (P. fluorescens) bio-fertilizer treatments on maize and soybean varieties growth and yield parameters. Obviously, the others considered components, as showed in Figure 4 were not competent performing intra and/or extra clustering analysis for the two analysed cereal crops quantifying the effects of rhizobacteria bio-fertilizer treatments in arid soil. Taking together these surveys supposes that rhizobacteria (P. fluorescens) treatments exhibit different effects on both maize and soybean cereals and that these differences can be easily explained by both yield and growth parameters.
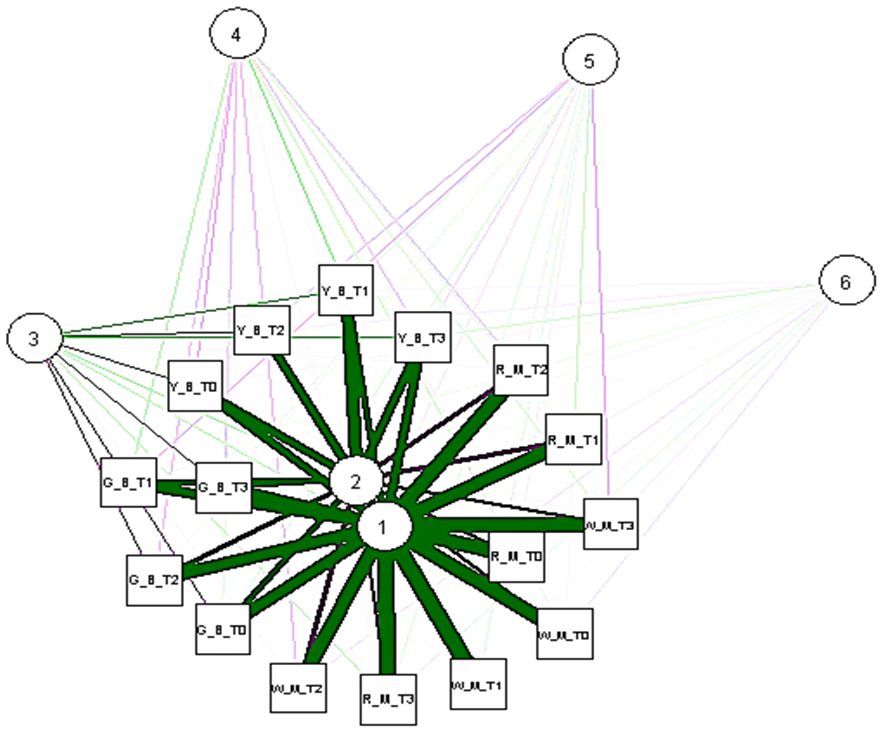 | Figure 4. Relationship between different analyzed Rhizobacteria treatments applied to both maize (Zea mays L) and soybean (Glycine max) by production (Component 1) and growth (Component 2) parameters. RM and RW are for red or withe maize respectively while GB and YB are for green or yellow soybean respectively |
3.5. Link between the Four Analysed Rhizobacteria (P. fluorescens) Treatments by R Fitting Curve Analysis
- Curve fitting is the process of constructing a curve, or mathematical function, which has the best fit to series of data points, possibly subject to constraints. Here we performed R fitting curve analysis aiming to comprehend the links between rhizobacteria (P. fluorescens) treatments T0, T1, T2 and T3. For this purpose treatment T0: treatment without any rhizobacteria (P. fluorescens) and foliar bio-fertilizer was used as reference appraising treatments T1 (treatment with rhizobacteria P. fluorescens only), T2 (treatment with both rhizobacteria P. fluorescens and foliar fertilizer) and T3 (treatment with foliar fertilizer only) effects on analysed cereals yield and growth process. As reported in Figure 5, the present analysis showed that both treatments T3 and T1 were less stable as opposed to treatments T0 (reference) and to treatment T2 (p-value<0.05). Moreover, treatment T2 appears to gradually improve quantitatively and qualitatively development process of the present analysed maize and soybean cereal plants (T2>T0; p-value > 0.05). In addition, it is also noteworthy to observe that rhizobacteria (P. fluorescens) treatment T2 acts as an intermediary treatment between both treatments T1 and T3 (T2=T1+T3), normalizing their instability processing both growth and yield parameters of maize (Zea mays. L) and soybean (Glycine max) cereal crops varieties (Fig. 5). Next we evaluated the variability between the four analysed rhizobacteria (P. fluorescens) treatments by a Fisher statistical test. This statistical test confirmed the significant variance observed between the aforementioned rhizobacteria (P. fluorescens) treatments (p-value < 0.05). The same analysis showed that analysed treatments were capable to explain for each other. In other words treatment T0 provided a good reference assessing rhizobacteria (P. fluorescens) bio-fertilizer impacts on both maize and soybean cereal cropsdevelopment. These results suggest that regardless considered parameters and analysed cereal crops, rhizobacteria (P. fluorescens) treatment T2 having recommended dose of rhizobacteria P. Fluorescens and foliar fertilizer resulted advantageous in both maize and soybean cultivation in the arid regions improving cereal development and yield rate. In addition, the present analysis demonstrated the potential positive influence of rhizobacteria (P. fluorescens) microorganism in improving cereal plants (maize and soybean) yield and growth process in arid soil (Fig. 5).
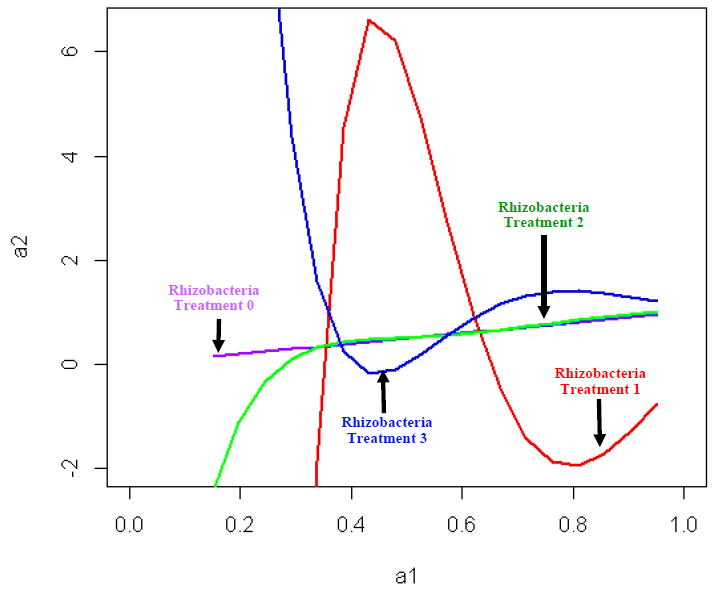 | Figure 5. R fitting cuvre graphic assessing the link between different rhizobacteria (P. fluorescens) treatments assessing growth and production of both maize (Zea mays. L) and soybean (Glycine max)cereal varieties |
3.6. Linear Regression Analysis Predicting Ear/Pod Number (yield parameters) by Leaves Number (growth parameters) Evaluating Rhizobacteria Treatments
- We developed a linear regression model predicting both analysed maize and soybean cereal production (ear/pod number; yield parameter) by growth parameter (leaves number; growth parameter). Indeed, the concordance between the present mentioned parameters is high and significant for treatment T3 with respect to the others analysed treatments (R: 0.93; p-value < 0.05). This result suggests the importance of foliar bio-fertilizer improving both analysed cereals production inpoor and arid soil. However, here, we developed a linear regression model to predict ear/pod number as cereal productionby leaves number as growth parameter analysing both maize and soybean seed exclusively treated by rhizobacteria P. fluorescens to mathematically appreciate the role of this microorganism in cereal production in arid soil. The developed linear regression model (E1) between previous mentioned growth and yield parameters was as following; (E1): y (leaves number or cereal plants growth parameter) = 1.95x (ear/pod numberor cereal production parameter) + 0.5. Statistical analysis associated to the intercept value (estimated value related to ear/pod parameter or cereal production) of E1 equation revealed a p-value < 0.05. However, F statistical analysis assessing the standard error of the present developed model exhibited a residual standard error around 0.1 and an adjusted R2 = 0.80 (p-value = 0.06). This analysis confirmed the key role of rhizobacteria P. fluorescens increasingcereal production in poor and arid soil as well as their capacity to accurately predict analyzed cereal yield estimating growth parameters (leaves number). Nextwe developed a statistical linear regression model predicting both maize and soybean production (ear/pod number; yield parameter) through growth parameters (leaves number; growth parameter) with the scoop to compare rhizobacteria (P. fluorescens) and rhizobacteria (P. fluorescens) + foliar fertilizer treatments effects on analysed cereal production. The developed linear regression model regarding rhizobacteria treatment T2 (rhizobacteria P. fluorescens + foliar fertilizer) was reported as followed: (E2); y (leaves numberor growth parameter) = 2x (ear/pod number or cereal production) + 0.45. This result (equation E2) is in agreement with equation (E1). Furthermore, the statistical analysis associated to the intercept value (estimated value associated to ear/pod parameter) of equation (E2) revealed a p-value < 0.05, while the F-statistical analysis assessing the standard error of such equation, exhibited a residual standard error value = 0.2 (p-value< 0.05). The same analysis recorded an adjusted R2 value=0.66 (R=0.81; p-value<0.05). Considering as whole, these surveys suggest that rhizobacteria (P. fluorescens) combined with foliar fertilizer (treatment T2) accurately predicts and normalizes the proliferation of analyzed cereal production via plants growing process (Fig. 5).
4. Discussion
- Arid soils are one of the most prevalent soil orders of the world. This category of soils typically contains high levels of calcium carbonates, gypsum, as well as sodium. Dueto limited moisture and accumulated soluble salts, these soils are generally not suited for major crop production. However, if properly managed and irrigated, these soil may become productive. Indeed, we previously showed the importance of rhizobacteria P. fluorescens combined with foliar bio-fertilizer improving maize cereal production by providing sufficient nutriment in the arid soil in the north of Côte d'Ivoire [2]. Generally, rhizobacteria P. fluorescens improves plant growth by synthesizing phythormones precursor [15, 16], vitamins, enzymes, siderophores, and antibiotics and inciting ethylene synthesis [17]. In fact the plant growth promoting rhizobacteria also increases the growth of plant through the synthesis of specific enzyme, which includes physiological change in plant. Ethylene plays a critical role in various development process such leaf senescence, leaf abscission, and fruit ripening [18]. Also ethylene regulates node factors signalling and module formation and has primary function in plant defence system. Moreover, Contesto et al., (2008) [19] showed that rhizobacteria microorganisms impact positively plants growth inducing vegetal hormones synthesis. In the same tendency, Ahmad et al., (2008) [20] and Estes et al., (2004) [21] evidenced the positive influence of rhizobacteria on plants growth and development through a better seed germination and a greater development of the roots, which induce the increase in the absorption capacity of nutrients and water in plants. Then, considering the prestigious role of rhizobacteria P. fluorescens improving cereal crops production [2, 5], we were interested to investigate the effects of these rhizosphere bacteria combined with foliar bio-fertilizer on both yield and growth parameters of maize (Zea mays. L) and soybean (Glycine max), two important cereal varieties, in the arid and low fertile soil in the north of Côte d'Ivoirea West African country by computational statistic pipeline. Next, we were also engaged to study the relationship between several combinations of the above mentioned rhizobacteria treatments improving both maize (Zea mays. L) and soybean (Glycine max) growth and production. For this purpose we developed a pipeline based on computational statistic approach, which results to be a reality in life science and then in agronomic science researches. The present pipeline was developed in R (version 3.2.2) statistical package environment and includes several scripts and functions based on this statistical software [8]. Our developed bioinformatics pipeline evidenced significant variability between the two considered and analysed soybean cereal varieties (green and yellow soybean) as response to rhizobacteria (P. fluorescens) treatments (Fig. 1). In other words, we showed that the analysed rhizobacteria P. fluorescens treatments exhibit diverse influences on the two studied soybean varieties (green and yellow soybean). Furthermore, the same findings suggesteda less sensibility of analysed maize varieties (DMRESR-Y or yellow and EV99-MRP or red maize) [2] as opposed to considered soybean varieties, reacting to rhizobacteria P. fluorescens bio-fertilizer treatments. These findings were in agreement with our previous observations [2]. Evaluating the relationship between rhizobacteria treatments T0, T1, T2 and T3 as individual factor and both maize (Zea mays. L) and soybean (Glycine max)growth and yield parameters as variable factors by a principal component analysis[10], we confirmed the relative high variability between both green and yellow soybean (Glycine max)varieties as opposed to red and white maize (Zea mays. L) varieties (p-value < 0.05) reacting to the present analysed rhizosphere treatments (Fig. 2). Furthermore, the same investigation suggested a high concordance between maize and/or soybean growth (leaves number) and yield (ear/pod number) parameters (Fig. 2), highlighting the capacity of analysed rhizobacteria treatments to improve and arrange good synergy between both analysed cereals growth and production [22]. This results suggested an influence of rhizobacteria P. fluorescens treatments regularising the synergy between both growth and yield parameters improving cereals yield in the present analysed arid soil. However, as expected our computation statistical pipeline proved that the two considered maize and soybean cereal crops were differentially influenced by the four analysed rhizobacteria P. fluorescens treatments; treatments T0, T1, T2 and T3 (Fig. 1 and 2) [2]. Moreover, focusing on the parallel principal component analysis, our developed computational statistic methodology showed that both yield and growth parameters were statistically able to explain the effect of rhizobacteria P. fluorescens treatments on the two considered maize and soybean cereal plants production and development process in the arid region in the north of Côte d'Ivoire (Fig. 3). A performed statistical analysis confirmed the ability of the two above mentioned parameters to significantly discriminate the inconsistency between soybean and maize crops (evaluating both growth and yield parameters) responding to analysed rhizobacteria P. fluorescens treatments (p-value < 0.05) as well as to distinguish between the two analysed varieties of soybean (Fig. 4). These results suggested that generally, rhizobacteria P. fluorescens, improves selectively cereals yield proposing a natural effect of rhizobacteria treatments on cereal crops development. However, the present developed computational statistic pipeline through R fitting curve surveyestablished a link between rhizobacteria P. fluorescens treatments, T0, T1, T2 and T3, showing the instability of both rhizobacteria (P. fluorescens) and foliar fertilizer handling together maize and soybean cereal production and development in the present considered arid soil (Fig. 5). As opposed to treatments T1 and T3, treatment T2 that combined rhizobacteria P. fluorescens and foliar bio-fertilizer (treatment T1 + treatment T3) results more stable improving growth and yield processes of both considered maize and soybean cereal plants (p-value <0.05) (Fig. 5). Next, we showed that treatment T2 associating rhizobacteria (P. fluorescens) microorganisms and foliar bio-fertilizer normalizes the agreement between growth and yield parameters of the present analysed cereal plants varieties (maize and soybean varieties) allowing an increase of their productivity in the arid soil [2, 23]. This observation suggests a positive interaction between rhizobacteria P. fluorescens and foliar bio-fertilizer in increasing plants nutrients in the arid soil, guaranteeing both maize (Zea mays. L) and soybean (Glycine max) cereal varieties productivity in poor and low fertile soils. Indeed, Shaharoona et al., (2006) [24] showed the efficiency of rhizobacteria P. Fluorescens increasing significantly maize plant growth and production when adequate quantity of nitrate has been provided. However, a large scale experimentation remains the best option to fully explain the encouraging effects of rhizobacteria P. fluorescens + foliar bio-fertilizer on cereal crops productivity in poor and arid soils by our developed pipeline.
5. Conclusions
- In conclusion the present studies permitted to develop a computational statistical analysis that revealed the key role of rhizobacteria P. fluorescens supporting cereal production in arid soil. Moreover, the present survey emphasized the aptitude of rhizobacteria P. fluorescens to selectively impact and improved both maize and soybean cereal varieties production in poor and arid soils in the north of Côte d'Ivoire. Finally this analysis via our developed bioinformatics pipeline demonstrated that rhizobacteria P. fluorescens associated to foliar bio-fertilizer lead and improve the synergy relationship between growth and yield parameters favouring the increase of both maize and soybean cereal yield in the arid and less fertile soil that characterizes the north region of Côte d'Ivoire.
ACKNOWLEDGEMENTS
- The authors thank RIZOBACTER SA for the financial support for the field trial. We are very grateful to M. Justo Casal for having facilitated this study.
References
| [1] | H. van Keulen, H. Breman, 1990 Agriculture development in the West Africa Sahelian region: a cure against land hunger. Agriculture Ecosystems & Environment vol. 32, Issue 3-4, 177-197 doi: 10.1016/0167-8809(90)90159-B. |
| [2] | Diarrassouba Nafan, Dago D. Noel, Soro Sibirina, Fofana I. Jesus, Silué Souleymane and Coulibaly Adama 2015. Multi-Variant Statistical Analysis Evaluating the Impact of Rhizobacteria (p.fluorescens) on Growth and Yield Parameters of Two Varieties of Maize (Zea mays. L). International Journal of Contemporary Applied Sciences. Vol 2 (7): 206-224. Available: www.ijcas.net. |
| [3] | Umesha S., Srikantaiah M., Prassana K. S., Sreeramulu K. R., Divya M., and Lakshmipathi. Comparative effect of organic and bioferlizers on growth and yield of maize (Zea mays. L) 2014. Current Agriculture Research Journal. Vol. 2 (1): 55-62. |
| [4] | Gupta A, Gopal M, Tilak KV. 2000 Mechanism of plant growth promotion by rhizobacteria. Indian J Exp Bio 38 (9) 856-62. PMID: 12561941. |
| [5] | Adolphe Adjanohoun, Pacôme Agossou Noumavo, Rachidatou Sikirou, Marcellin Allagbe, Henriette Gotoechan-Hodonou, Koya Kovise Dossa, Boniface Yehouenou, Romain Glele Kakai et Lamine Baba-Moussa 2012. Effets des rhizobactéries PGPR sur le rendement et les teneurs en macroéléments du maïs sur sol ferralitique non dégradé au Sud-Bénin. Int. J. Biol. Chem. Sci. 6 (1): 279-288. Available: http://ajol.info/index.php/ijbcs. |
| [6] | Santosh Kumar he Role of Bioinformatics in Agriculture 2014 by Apple Academic Press Reference 490 Pages - 40 B/W Illustrations. ISBN 9781771880039. |
| [7] | Dago Dougba Noel, Silué Pebanagnanan David, FofanaInza Jesus, Diarrassouba Nafan1, Lallié Hermann Désiré N.M. and Coulibaly Adama (2015) Development of a Statistical Model Predicting Rice Production by Rain Precipitation Intensity and Water Harvesting. I. J. Recent Sci Res,6(9), 6270-6276. Available: http://www.recentscientific.com. |
| [8] | R Core Team (2013). R: A language and environment for statistical computing. R Foundation for Statistical Computing, Vienna, Austria. ISBN 3-900051-07-0, URL http://www.R-project.org. |
| [9] | Dodge, Y (2003) the Oxford Dictionary of Statistical Terms, OUP. ISBN 0-19-920613-9 entry for normalization of scores. |
| [10] | Lê, S., Josse, J. & Husson, F. (2008). Facto Mine R: An R Package for Multivariate Analysis. Journal of Statistical Software. 25(1). pp. 1-18. Available: http://www.jstatsoft.org/v25/i01. |
| [11] | Horn, J. L. (1965). A rationale and test for the number of factors in factor analysis. Psychometrika, 30(2), 179-185. |
| [12] | Franklin, S. B., Gibson, D. J., Robertson, P. A., Pohlmann, J. T., & Fralish, J. S. (1995). Parallel analysis: a method for determining significant principal components. Journal of Vegetation Science, 6(1), 99-106. |
| [13] | Zwick, W. R., & Velicer, W. F. (1986). Comparison of five rules for determining the number of components to retain. Psychological Bulletin, 99, 432-442. |
| [14] | Dago Dougba Noel Lallié Hermann Désiré N. M., Diarrassouba Nafan Silué Souleymane and Giovanni Malerba Correlation between accuracy sensitivity specificity and positive predictive value parameters in detecting differentially expressed genes (2015) International Journal of Development Research, Vol. 05, Issue, 03, pp. 3734-3739. Available: http://www.journalijdr.com. |
| [15] | Perveen S., Khan M.S., Zaidi A. (2002) Effect of rhizospheric microorganisms on growth and yield of greengram (Phaseolusradiatus). Ind.J. Agric.Sci. 72, 421-423. |
| [16] | Ahmad F, Ahmad I, Khan MS. 2008. Screening of free-living rhizospheric bacteria for their multiple plant growth promoting activities. Microbiol. Res., 163 (2): 173-181. |
| [17] | Burd, G.I., Dixon, D.G., Glick, B.R., 2000. Plant growthpromoting bacteria that decrease heavy metal toxicity in plants. Can. J. Microbiol., 46 (3):237-245. Doi: 10.1139/ cjm-46-3-237. |
| [18] | Vogel G, Aeschbacher RA, Müller J, Boller T, Wiemken A. 1998 Trehalose-6-phosphate phosphatases from Arabidopsis thaliana: identification by functional complementation of the yeast tps2 mutant. Plant J. 13(5) 673-83. |
| [19] | Contesto C, Desbrosses G, Lefoulon C, Béna G, Borel F, Galland M, Gamet L, Varoquaux F, Touraine B. 2008. Effects of rhizobacterial ACC deaminase activity on Arabidopsis indicate that ethylene mediates local root responses to plant growth-promoting rhizobacteria. Plant Sci., 175: 178-189. |
| [20] | Ahmad, P., Sharma, S., 2008. Salt Stress and Phyto-Biochemical Responses of Plants. Plant Soil Environ. 54: 89-99. |
| [21] | Estes BL, Enebak SA, Chappelka AH. 2004. Loblolly pine seedling growth after inoculation with plant growth-promoting rhizobacteria and ozone exposure. Can. J. Forest Res., 34 (7): 1410-1416. |
| [22] | Ahmad, P., Sharma, S., Srivastava, P.S., 2006. Differential physio-biochemical responses of high yielding varieties of Mulberry (Morusalba) under alkalinity (Na2CO3) stress in vitro. Physiol. Mol. Biol. Plants, 12: 59-66. |
| [23] | Hernandez AN, Hernandez A. and Heydrich M (1995). Seleccion de rizobacteriasasiciadas al cultivo de maiz. Cultivostropicales16: 5-8. |
| [24] | Shaharoona AAZ, Muhammad AB, Azeem Kalid A. 2006. Performance of Pseudomonas spp. containing ACC deaminase for improving growth and yield of maize (Zea mays L.) in the presence of nitrogenous fertilizer. Soil Biol. Biochem., 38 (9): 2971-2975. |