-
Paper Information
- Next Paper
- Previous Paper
- Paper Submission
-
Journal Information
- About This Journal
- Editorial Board
- Current Issue
- Archive
- Author Guidelines
- Contact Us
American Journal of Bioinformatics Research
p-ISSN: 2167-6992 e-ISSN: 2167-6976
2012; 2(5): 79-85
doi: 10.5923/j.bioinformatics.20120205.02
Construction Path Analysis Model from DNA Microarray Data
 Abstract
 Reference
 Full-Text PDF
 Full-Text HTML
Ibrahim Ali Al-Khlil 1, Khaled Badran 1, Hesham Mohamed El-Deeb 2, Mohmad Badr Al Senousy 3
1Department of Computer science, Military Technical College, Cairo, Egypt
2Department of Computer science, Modern University for Technology and Information, Cairo, Egypt
3Department of Computer science, Sadat Academy for Management Science, Cairo, Egypt
Correspondence to: Ibrahim Ali Al-Khlil , Department of Computer science, Military Technical College, Cairo, Egypt.
| Email: |  |
Copyright © 2012 Scientific & Academic Publishing. All Rights Reserved.
A fundamental problem in human health is to predict the effect of genes that cause disease; this is an important step to diagnosis and treatment. Also prediction gene functions are still a challenge for biologists in the post-genomic era. DNA microarray simultaneously monitors expression levels thousands of genes; the massive gene expression data provide us with unique opportunities to analyze the functional and regulatory relationships among genes. In this paper, new approach to estimate the relationship among genes and the effects of each gene on diseases is proposed. This approach consists of four main steps: First, extract the subset of high informative genes. Second, constructing genes network; thus, we propose to predict a gene’s functions according to its context graph, which is defined as the gene interaction network composed of the genes interacting directly and indirectly based on focal gene. Third, path analysis model is used to estimate the effect of genes on the disease and among each other. Fourth, obtains the relation among genes and the target (disease) by applying logistic regression analysis for predict new samples. This approach evaluated by lung cancer Microarray dataset. The proposed path diagram fit the subset of top ranked genes expression dataset, the Goodness of Fit Index (GFI) was > 0.832. The value of this approach is that it not only tackles the measurement problem by path analysis but also provides a visualization of the relationship among genes. The proposed approach also is useful for feature reduction, due to evaluate all genes simultaneously vs. lung state.
Keywords: Microarray Gene Expression Data, Genes Selection, Genes Ranking, Cancer, Genes Network, Path Analysis, Pearson Correlation
Article Outline
1. Introduction
- A DNA microarray technique allows to simultaneously observing the expression levels of thousands of genes during significant biological processes and across collections of related samples[1], microarray data applied to make possible drug and therapeutics improvement, disease diagnosis, and comprehensible basic cell biology. The datasets from microarray analysis enables the measurement of molecular signatures of diverse cells, becomes an important application of data mining, artificial intelligence and machine learning techniques to provide bioinformatics knowledge[2].A few numbers of genes are highly related with diseases, these genes are called informative genes, which have expression pattern strongly correlated with the diseases. Byour the previous study[3], the subset of top ranked genes that gave the high classification accuracy was extracted by two techniques of Attribute selection technique, “Support Vector Machine-Recursive Feature Elimination (SVM-RFE) [4,5] and Information Gain Attribute Selection IGAS”[6]. 10 top ranked genes gave high classification accuracy by the most popular classifiers, which belong to six main categories, (1) Bayes classifiers ( Bayesian Network and Naive Bayes), (2) lazy classifier (K-nearest-neighbor), (3) rule base classifiers (PART and Decision Table, (4) function base classifiers (SVM and Artificial Neural networks ANN), (5) meta classifier ( AdaBoost(c4.5) and Baggin(c4.5)), (6) single Decision Tree (C4.5). Gene networks, is a general class of gene nets where any set of genes may have connections. Theoretically genes that interact directly or indirectly may have the same or similar functions in the biological processes in which they are involved and together contribute to the related cancer diseases. The complicated relations between genes can be clearly represented using network theory[7, 8]. Thus Pearson’s correlation or Euclidean distance criterions are used to measure the similarity between genes for constructing genes network[9]. But Pearson’s correlation or Euclidean distance are not able to completely capture the relationship among all candidates genes expression profiles and lung cancer simultaneously[10, 11]. Therefore, to identify interactions between genes and to estimate the relationship between genes and lung cancer path analysis model is used. The rest of this paper organized as follows: Section 2 describes path analysis problem and related materials. Section 3 describes lung cancer microarray dataset; Section 4 presents the proposed model to constructing genes network. Section 5 describes constructing genes network in practical. Section 6 analysis and discussions. Section 7 presents a comparison between single decision tree model and proposed path analysis model. Paper concluded in section 8.
2. Path Analysis Problem
- Let X1,X2, . . . ,Xm be exogenous variables, correlated and have both direct and indirect effects (through endogenous variables Xm+1,Xm+2,…,Xn) on dependent variable Y.Let M be the correlation coefficient matrix among these variable.It is required to construct graph model G (Path diagram) depending on underlying relationship between these variables
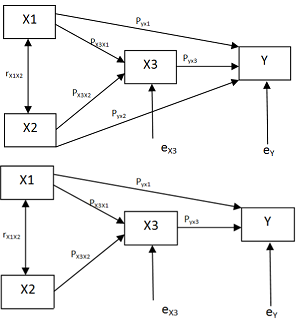 | Figure 1. An example of a general recursive causal system, (A) Illustration of possible relations among variables and output. (B) The result of significant variable |
 ; n:number of variable,Hence the target Y for one-headed arrow, “between” X1 and X2 in figure . 1A calculated as:
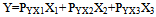 | (1) |
3. Lung Cancer Microarray Dataset
- The dataset where used in this study primary lung cancer specimens, was collected from European Bioinformatics Institute (EBI) available onlinehttp://www.ebi.ac.uk/arrayexpress/experiments/E-GEOD-31908 , the dataset published on 2011-09-05, contains from 40 normal samples vs. 60 primary lung cancer. Each sample in the dataset contains from 22646 genes.
4. Proposed Model to Constructing Genes Network
- As we mention above Microarray dataset contains thousand of genes unrelated with diseases, thus we can’t deal with a huge numbers of genes in single network, in addition to the redundant genes don’t provide any additional information, thus, for the simplicity we will dealing with microarray signature (most important genes).The proposed genes network constructed as the follows:1. Extract the microarray signature (subset of 10 top ranked genes) which ranked by information Gain Ratio (IGR) criterion.2. Assign the gene that take higher IGR value as focal gene.3. Calculate Pearson's correlation coefficient (PCC) between focal gene and each other genes, Only those genes with the absolute PCC value higher than (0.7) thresholds are linked to the focal gene. 4. Assign the gene that gave next IGR as focal gene. Return form 3. Finally, a Directed networks are then created from these gene sets. In the network, a vertex set V = {g1, g2,…,gi} represents the genes. E = {{gi, gj} | gi, gj ϵ V ˄ |Pij| T} is the edge set that represents the relationship between the genes, where T is the given threshold of PCC, and Pij is the PCC value of gi and gj. Figure .2. shows the gene network.
 | Figure 2. Genes network generated from subset of top ranked genes (assigned as null path analysis model) |
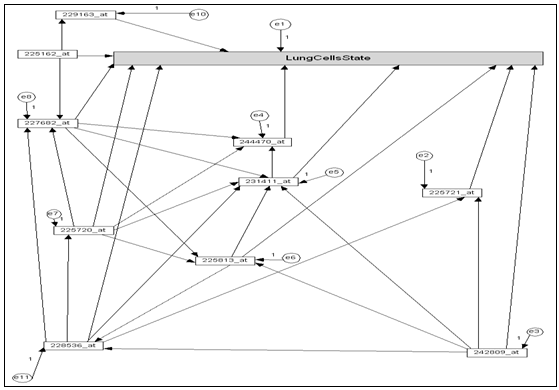
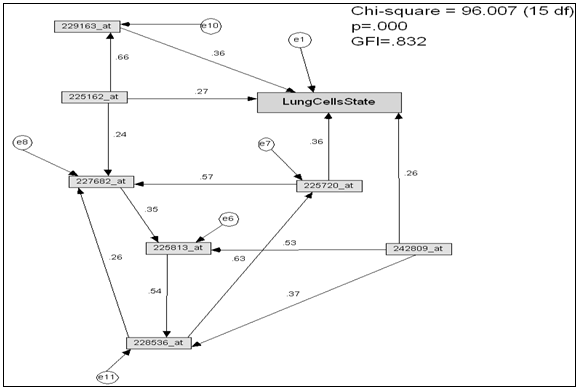
 | Figure 3. Standardized path coefficient among genes and lung cells state |
5. Practical Constructing Genes Network
- To extracting the subset of 10 top ranked genes according to information gain ratio criterion[3], ELBRAV algorithm[14, 15] was used. This subset of genes gave the higher classification accuracy on majority of cancerous microarray datasets.Software package SPSS 16.0[16] was used to calculate the Pearson’s correlation to measure the similarity among genes and lung cancer “lung cells state”. Genes that have strong correlation coefficient have the same function and linked with same biological pathway[17]. Thus the genes those have Pearson’s correlation value greater than |0.7| are linked together. The 10-top ranked genes that extracted from the dataset labeled as being in the microarray. figure 3. shows the path diagram constructed based on Pearson’s correlation value. In the path diagram Figure 3.
6. Analysis and Discussion
- Model Hypothesis The genes network that generated from subset of top ranked genes assigned as null path analysis model. The main objective here the question; is the genes network fit the subset of lung cancer microarray dataset?Hypothesis TestingTo estimates the path coefficient (regression weights) for model (figure 2.) Maximum likelihood estimation function (MLF)[18] was used. The MLF exists in the AMOS (v16) software package[19], figure 3 shows standardized path coefficient among genes and lung cells state that calculated based on MLF.
6.1. Model Properties and Evaluation
- The model (figure 3.) properties as the follows: Number of variables (genes) (21), number of observed variables (11), number of unobserved variables (10), number of exogenous variables (11), number of endogenous variables (10).Degrees of freedom: Number of distinct sample moments (66), number of distinct parameters to be estimated (41), thus degrees of freedom (25)χ2 = 140.797, probability level = .000.Goodness of Fit Index (GFI)[20] of the model GFI =0.821.Root Mean Square Residual (RMR), RMR= 0.282.Root Mean Square Error of Approximation (RMSEA) = 217.Comparative Fit Index (CFI)[21], CFI > 0.894.The model in figure 3. Contains several path coefficient values is not significantly different from zero at the p- value 0.05, these paths are organized in table 1.Due to the path diagram in (figure 3.) contains several paths that are not significantly different from zero at the 0.05 p-value; the path diagram simplified by eliminating these paths and variables (genes) that insignificantly affected on lung cells state, the modified path diagram shown in figure. 4.
|
|
7. Single Decision Tree Model vs. Proposed Path Analysis Model
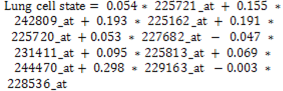
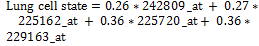
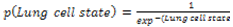
- In addition to path analysis model measure the effect of variables (genes) on the target variable (Lung cell stat) also it can used as classification model as shown in the comparative below.The output of traditional classification model such as single decision tree (c4.5) is a set of roles that partition the dataset according to higher informative attribute. Tested samples are classified according to these roles. As shown in the real practical example Figure 5.Figure 6. the microarray dataset is the input of the C4.5 classifier, the output is set of rules, in testing stage tested samples are input of rules, and the output is category of the new samples.
 | Figure 4. Path diagram resulted after simplified model (Figure 2) |
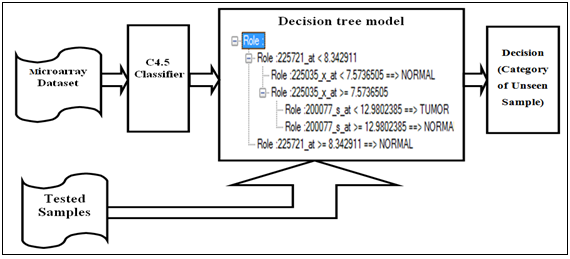 | Figure 5. Real example of decision tree model |
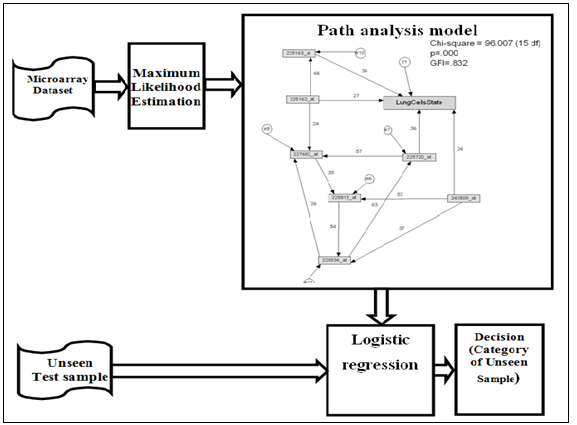 | Figure 6. Path analysis model classifier |
 | (5) |
 | (6) |
 | (7) |
8. Conclusions
- We presented new approach to predict genes inference based on gene-gene interaction network that constructed from gene expression data. To elucidate this approach, a real lung cancer microarray dataset was used.In this approach, information gain ratio attribute evaluation is used to extract the signature of cancerous microarray dataset, and Pearson’s correlation criterion was used to measure the similarity between genes to construct genes network according to the strength correlation between focal gene and other candidate genes, where the high correlated genes linked together and theoretically do the same genes function. In addition to, estimate the effect of each gene on lung cancer (path coefficient) using path analysis model.The value of this approach is that it not only tackles the measurement problem by path analysis but also provides a visualization of the relation among genes. In addition to its ease of use, this approach effectively addresses the genes reduction problem. For instance; the genes that gave approximately equal information gain ratio value or Pearson’s correlation value, not gave the same path coefficient on lung cancer using path analysis model, due to in the genes reduction methods or correlation methods dealing with each gene and the disease label individually but path analysis modeling analysis all genes simultaneously. Path analysis modeling can be used as classifier but it is need additional steps, such as data standardization and logistic regression function. In this case path analysis modeling gave the probability of the target (class label) belong to one class, this is additional advantage of path analysis modeling vs. other classification modeling, where path analysis in this study gave 95% classification accuracy vs. 90% that given by C4.5.This approach provides path diagram that explains the direct and indirect effect of each gene on lung cancer and shows the genes that provide significantly and insignificantly effect on lung cancer, maximum likelihood estimation function is used to calculate the path coefficients, and the proposed path diagram fit the subset of the microarray dataset, hypothesis testing were used to measure the goodness of the proposed path diagram, where the Goodness of Fit Index (GFI) was ≥ 0.832.
References
| [1] | R. Arma, I , L. Marcos, V. Taboada, E. Ucar, B. Irantzu, A. Fullaondo, L. Pedro, and A. Zubiaga, "Microarray Analysis of Autoimmune Diseases by Machine Learning Procedures", IEEE Transaction on Information in biomedicine , vol. 13, no. 3, pp 341-350, 2009. |
| [2] | M. B. Senousy, H. M. El-Deeb, K. Badran and I. A. Al-Khlil, " Suite of Decision Tree-Based Classification Algorithms on Cancer Gene Expression Data", Egyptian Informatics Journal, vol. 12, Issue 2, 2011 |
| [3] | M. B. Senousy, H. M. El-Deeb, K. Badran and I. A. Al-Khlil, “Gene Ranking Techniques via Attribute Evaluation Algorithms for DNA Microarray Analysis”, ASAT international conference on Aerospace Sciences & aviation technology, pp. 153-167, 2011. |
| [4] | I. Guyon, J. Weston, S. Barnhill, and V. Vapnik, "Gene selection for cancer classification using support vector machines", Machine Learning, 46(1-3):389–422, 2002. |
| [5] | Mahesh Pal and Giles M, “Feature Selection for Classification of Hyperspectral Data by SVM”, IEEE Transactions on geosciences and remote segnaling vol. 48, no. 5, 2010. |
| [6] | X. Liu, A. Krishnan, and A. Mondry, "An entropy-based gene selection method for cancer classification using microarray data", BMC Bioinformatics, vol. 6, no.76, 2005. |
| [7] | Hui Liu, Jianzhong Su, Junhua Li, Hongbo Liu, Jie Lv, Boyan Li, Hong Qiao and Yan Zhang, “Prioritizing cancer-related genes with aberrant methylation based on a weighted protein-protein interaction network”, BMC Systems Biology, vol. 5, no.158, 2011. |
| [8] | Xuebing Wu and Shao Li, “Cancer Gene Prediction Using a Network Approach”, Chapter 11, in: Cancer Systems Biol-ogy (Ed. Edwin Wang). Series: Chapman & Hall/CRC Mathematical & Computational Biology, USA: CRC Press, pp. 191-212, 2010. |
| [9] | Xiao-Gang Ruan, Jin-Lian Wang and Jian-Geng Li, “A Network Partition Algorithm for Mining Gene Functional Modules of Colon Cancer from DNA Microarray Data”, Geno. Prot. Bioinfo. vol. 4 no. 4, pp. 245- 252, 2006 |
| [10] | Xing-Ming Zhao, Luonan Chen and Kazuyuki Aihara, “Gene Function Prediction with the Shortest Path in Functional Linkage Graph”, The First International Symposium on Optimization and Systems Biology (OSB’07), pp. 68–74, 2007 |
| [11] | Xianghong Zhou, Ming-Chih J. Kao, and Wing Hung Wong, “Transitive functional annotation by shortest-path analysis of gene expression data”, PNAS, vol. 99, no. 20, pp. 12783–12788, 2002 |
| [12] | Dodd, L.E., Wagner, R.F., Armato, S.G., McNitt-Gray, M.F., Beiden, S., Chan, H.P., Gur, D., McLennan, G., Metz, C.E., Petrick N., Sahiner, B., Sayre J., “Assessment Methodologies and Statistical Issues for Computer-Aided Diagnosis of Lung Nodules in Computed Tomography”, Acad. Radiol., vol. 11, pp. 462-474, 2004. |
| [13] | Song, J.H., Venkatesh, S.S., Conant, E.A., Arger, P.H., Sehgal, C.M. “Comparative Analysis of Logistic Regression and Artificial Neural Network for Computer-Aided Diagnosis of Breast Masses”, Acad. Radiol., vol. 12, pp. 487-495, 2005. |
| [14] | MOHAMMED M MAZID, A. B. M. SHAWKAT ALI and KEVIN S TICKLE, “Input space reduction for Rule Based Clas-sification”, INFORMATION SCIENCE and AP-PLICATIONS, Issue 6, vol.7, 2010. |
| [15] | M. B. Senousy, H. M. El-Deeb, K. Badran and Ibrahim Ali Al-Khlil, “Ensample Learning Based on Ranking Attribute Value (ELBRAV) for imbalanced Biomedical Data Classification”, Egyptian Computer Science Journal (ECS Journal), vol. 36, no. 1, 2012. |
| [16] | “Command Syntax Reference”, Copyright © 2007 by SPSS Inc. http://www.spss.com |
| [17] | Xin Li, Hsinchun Chen, Jiexun Li, and Zhu Zhang, “Gene Function Prediction with Gene Interaction Networks: A Context Graph Kernel Approach”, IEEE Information Technology in Biomedicine, vol. 14 Issue1, pp.119-128, 2010. |
| [18] | In Jae Myung, “Tutorial on maximum likelihood estimation”, Journal of Mathematical Psychology, vol. 47, pp. 90-100, 2003 |
| [19] | Jeremy J. Albright and Hun Myoung Park , “Confirmatory Factor Analysis using Amos, LISREL, Mplus, SAS/STAT CALIS”, University Information Technology Services Center for Statistical and Mathematical Computing Indiana University, © 2006-2009, Last modified on April 2009 |
| [20] | Tanaka J.S. and Huba G.J., “A fit index for covariance structure models under arbitrary GLS estimation”, British Journal of Mathematical and Statistical Psychology, vol. 38, pp. 197–201, 1985. |
| [21] | McDonald, R.P. and Marsh, H.W., “Choosing a multivariate model: Noncentrality and goodness of fit”, Psychological Bulletin, vol. 107, pp. 247-255, 1990. |