-
Paper Information
- Next Paper
- Previous Paper
- Paper Submission
-
Journal Information
- About This Journal
- Editorial Board
- Current Issue
- Archive
- Author Guidelines
- Contact Us
American Journal of Bioinformatics Research
p-ISSN: 2167-6992 e-ISSN: 2167-6976
2012; 2(4): 47-54
doi: 10.5923/j.bioinformatics.20120204.03
Prediction of Antigenic Epitope Patches on Protein Surface Using Antigen Structure Information and Support Vector Machine
 Abstract
 Reference
 Full-Text PDF
 Full-Text HTML
Khaled A Hassan 1, Amr Badr 2, Mostafa Abdel-Azim 3
1Department of Computer Science, Arab Academy for Science, Technology and Maritime Transport, Cairo, Egypt
2Department of Computer Science, Faculty of Computers and Information, Cairo University, Cairo, Egypt
3Department of Information Systems, Arab Academy for Science, Technology and Maritime Transport, Cairo, Egypt
Correspondence to: Khaled A Hassan , Department of Computer Science, Arab Academy for Science, Technology and Maritime Transport, Cairo, Egypt.
| Email: |  |
Copyright © 2012 Scientific & Academic Publishing. All Rights Reserved.
Identification of antigen-antibody interacting sites is an important task for vaccine design, and hence reliable computer based prediction methods are highly desirable. The prediction performances of the current existing methods to predict the conformational B-cell epitope residues are still not satisfying and remain far from ideal. This is a new approach in the area of vaccine development to predict the antigenic surface patches that hold the majority number of epitope residues in the surface of the antigen protein structure. The proposed method is a support vector machine based model to predict the epitope patches in the antigen structures by combining the accessible surface area and B-factor structural features. The Predictions are made for the known structures of benchmark dataset after removing antigens sequence redundancy where no two antigen sequences have more than 40% sequence identity. The predictions are successful for 70% of the antigen structure chains of the benchmark dataset. We compared the prediction performance of our model with a protein – protein interaction prediction server “Sharp2” using the same antigen structures of the benchmark dataset and observed that our model outperforms on Sharp2 by more than 40% accuracy. This paper demonstrates that the identification of the antigenic determinant sites in the protein surface using the antigen structural information outperforms the traditional protein-protein interaction algorithms to predict the interacting sites in the antigen protein surface. It provides a new approach for the scientists to only use the predicted antigenic epitope surface patch from the target antigen structure in vaccine development rather than using the predicted epitope residues. A web server “PatchTope” has been developed for predicting antigenic epitope surface patches on an antigen protein structure surface and is available at http://www.fci.cu.edu.eg:8080/PatchTope/.
Keywords: Surface Patch, Conformational B-cell Epitopes, Support Vector Machine, B-Factor, Relative Solvent Accessibility
Article Outline
1. Introduction
- Vaccine design is the process of creating drug (vaccine) to stimulate adaptive immunity to a disease. Vaccine can either be live attenuated (weakened) forms of pathogens (bacteria or viruses), killed or inactivated forms of these pathogens, or a refiner material such as proteins. Evolution of weakened pathogens can be one of the potential safety problems raised from such vaccines[1]. In order to overcome on such safety problems, the subunit vaccine is introduced. Subunit vaccine is produced from a specific portion of the protein antigen or virus separated from the pathogenic organism called epitope.B-cell epitopes are segments of the antigen molecules recognized by antibodies or B-cells. They are classified into two groups: continuous and discontinuous. A continuous (linear) epitopes are short segment of continuous amino acid sequence fragment of a protein[2] while a discontinuous (conformational) epitopes are composed of a bundle of amino acid residues of a protein antigen that are far away from each other in the primary sequence of the antigen but are brought to close proximity within the folded protein structure[3]. The large majority of B-cell epitopes although they are composed of short linear peptides, are conformational.Identification of B-cell epitope is considered the main challenging task in the epitope-driven vaccine design[4]. Manual identification of B-cell epitopes by actual experimentations and testing done by scientists is very expensive and has a lot of limitations. Such limitations are (time scale, some experiments can’t be done by scientists and ethical concerns). Wherefore, computer based systems can play an important role in this task by developing computational methods in predicting B-cell epitopes for scientists.Computational methods for conformational B-cell epitopes identification require a complete analysis in the context of the native antigen structure however; the linear epitopes only require the sequence of the antigen to be available[5]. Several computational methods have been developed for predicting B-cell epitopes of the both types: linear and conformational epitopes.There are two major approaches for predicting linear B-cell epitopes; these approaches are propensity scale and machine learning methods. The existing methods which rely on propensity scale approach are Parker et al.[5], Karplus et al.[7], Emini et al.[8], PREDITOP[9], PEOPLE[10], BEPITOPE[11] and BcePred[12]; while the recent existing methods which rely on machine learning approach are BepiPred[13], ABCPred[14], Söllner and Mayer[15], Chen et al.[16], Söllner et al.[17], BCPred[18], FBCPred[19], El-Manzalawy et al.[20] and COBEpro[21].The conformational B-cell epitope prediction methods are also composed of two major approaches; these approaches are sequence and structure based approaches. Sequence based prediction methods try to predict the conformational B-cell epitopes from the antigen primary sequence while in the structure based prediction methods; the antigen 3D structure must be available. The sequence based prediction approach for predicting conformational B-cell epitopes has the advantage that there is no need for the antigen 3D structure to be available for prediction but only the antigen sequence is enough. CBTOPE[22] is a prediction method relies on the sequence based approach to predict conformational B-cell epitopes from the antigen primary sequence. On the other hand, there are some few methods for predicting conformational B-cell epitopes from the antigen structure; these methods are CEP[23], DiscoTope[3], PEPITO[24], Ellipro[25], EPCES[26], EPSVR[27], EPMeta[27], and Liu R et al.[28]. Unfortunately, the prediction performances of these methods are still not satisfying and remain far from ideal.In this paper, we present a different vision for identification of the antigenic epitope sites in the antigen structure chain by predicting the antigen overlapping surface patches that hold the majority of epitope residues in the antigen structure; and thus the scientists can use in vaccine development. From a given antigen structure, the overlapping surface patches are generated, and the surface patch that holds maximum number of epitope residues is considered the epitope patch which is used for vaccination by the scientists. The method is a support vector machine model trained on epitope and non-epitope surface patches generated from antigen structure chains of Pernille et al.’s dataset[3]. The method always choses three top scored paths and treats them as predicted paths. Then the prediction is considered as correct if any of these paths predicts at least 70% of interacting residues. To evaluate the performance of our model, predictions are made for known structures of an independent test set of antigen chains generated by Ponomarenko, Julia et al.[29]. Additionally, we evaluated our model in terms of the area under receiver operator characteristics curve (AUC) by conducting fivefold cross validation technique on the representative training set collected by Pernille et al.[3]. We compared our model with Sharp2[30]: a server for the prediction of protein-protein interaction sites on the surface of the protein structure. We compared the prediction accuracy of Sharp2 in the benchmark dataset with our model, and it is observed that the identification of the antigenic determinant sites in the protein surfaces using the antigen structural information outperforms the protein-protein interaction method “Sharp2” to predict the antibody interacting sites in the antigen protein surfaces.
2. Methods
2.1. Datasets
2.1.1.Training Dataset
- We obtain 75 (Ag-Ab) complexes prepared by Pernille et al.[3] from Discotope supplementary materials. These complexes were selected using X-ray crystallography with resolution less than 3 Å. The corresponding antigen PDB file is obtained from Protein Data Bank[31]. Pernille et al.[3] had divided the 75 antigens into 25 heterogeneous groups. The 25 heterogeneous groups of antigens were divided into five data sets for cross validation and testing. In this dataset, a residue in the antigens is determined as epitope residue if the distance between any of its atoms and any atom of antibodies is less than 4Å. This dataset contains 1202 antibody interacting and 13242 non-antibody interacting residues.
2.1.2.Independent Testset
- We evaluated our model on a Benchmark dataset generated by Ponomarenko et al.[29]. This dataset contains 161 protein chains obtained from 144 (Ag-Ab) complex structures. The antigen residue is considered an epitope residue if the distance between any of its atoms and any atom of antibodies is less than 4Å. We removed sequence redundancy from the 161 antigen chain sequences using CDHIT[32] at 40% cutoff, obtaining only 50 antigen chains where no two antigen sequences have more than 40% sequence identity. In order ensure the low sequence identity between training and testing datasets; we removed the chains that already exist in the Ponomarenko et al.’s dataset (our training dataset) and the representative remaining proteins have been selected as testing dataset. Finally we got non redundant test set of 30 antigen chains: 1BGX:T, 1DEE:H, 1E6J:P, 1IGC:A, 1KEN:A, 1NL0:G, 1NSN:S, 1ORQ:C, 1PKQ:E, 1S78:B, 1SY6:A, 1TZI:V, 1WEJ:F, 1YJD:C, 1YNT:F, 1ZA3:R, 1ZTX:E, 2ADF:A, 1NMB:N, 2B4C:G, 1T03:B, 1R3K:C, 1V7M:V, 1IAI:I, 1IAI:M, 1KB5:A, 1KB5:B, 1QFW:A, 1QFW:B, 1OB1:C. This independent test set contains 467 antibody interacting and 6171 non-antibody interacting residues.
2.2. Surface Patch Generation Algorithm
- The identification of the protein surface is not an easy task even when the antigen 3-d structure is known. The relative solvent accessibility of a residue in the protein structure is considered a measure of how large the amino acid residue is exposed to the solvent surrounding the protein[33]. NACCESS[34] is a computer program used to compute the atomic accessible surface area of a given 3-dimensional co-ordinate sets (PDB files). For each antigen, the relative accessible surface area is computed and the residues with a relative surface area ≥ 5% are considered the protein surface accessible residues[35]. Each surface accessible residue is used to define a surface patch. A surface patch is composed of the central accessible surface residue followed by N nearest surface accessible neighbour residues[35], (N + 1) is the patch size. The nearest surface accessible neighbour residues from the patch central accessible surface residue are determined by the Euclidean distance[36] between all surface residues and the patch central residue. Using this procedure, overlapping patches of surface accessible residues are generated from each antigen structure. Figure 1 shows a flow chart of the surface patch generation algorithm.
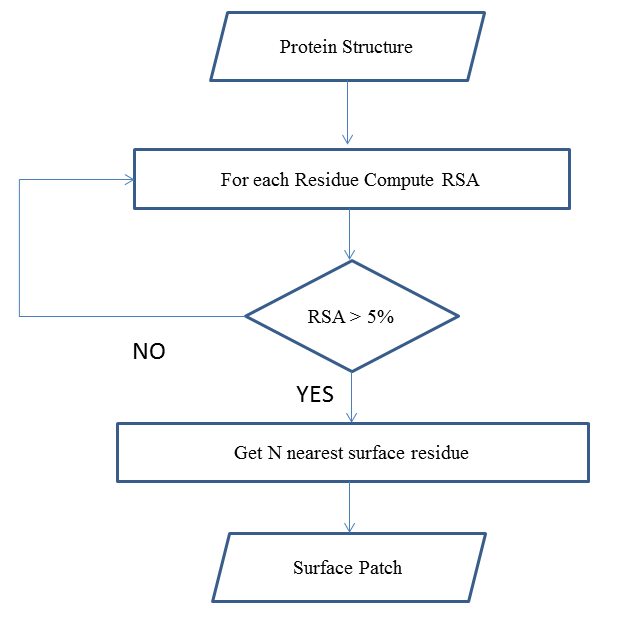 | Figure 1. Surface Patch Generation Algorithm |
2.3. Data Preparation
- For each antigen structure in the Pernille et al.’s dataset[3], the overlapping surface patches are generated. Epitope patch is the antigen surface patch that holds the maximum number of epitope surface accessible residues, while non-epitope surface patch is the antigen surface patch that holds the minimum number of epitope surface accessible residues in the antigen structure. Following this rule, the training dataset is composed of 75 and 75 epitope and non-epitope surface patches, respectively. In order to increase the training dataset, we increased the number of non-epitope surface patches for each antigen structure by selecting 6 surface patches holding minimum number of epitope residues, while only one epitope surface patch is generated. For each surface patch, 1 label is assigned to an epitope surface patch and 0 label is assigned to non-epitope surface patch. This training dataset contains a total of 75 epitope surface patches and 450 non-epitope surface patches.
2.4. Normalized Relative Solvent Accessibility
- For each surface residue in the antigen structure, the relative solvent accessibility is measured using the program NACCESS[34], and normalized using the following equation:
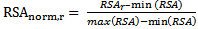 | (1) |
 is the relative solvent accessibility of residue r;
  and
and  are the maximum and minimum relative solvent accessibility values of all residues in the antigen chain, respectively.
2.5. Normalized B-Factor
- Also called “temperature factor”, it reflects the flexibility of residues in the protein structure resulting from protein crystallography[37]. For each surface residue in the antigen structure, the B-Factor value is extracted from the antigen 3-dimensional co-ordinate file (PDB file), and normalized using the following equation:
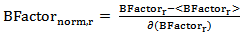 | (2) |
 is the B-Factor of residue r, <
 > and
> and are the mean value and the standard deviation of the B-Factor values of all residues in the antigen chain, respectively.
2.6. Support Vector Machine Model
- Support vector machine[38] is a classification algorithm aims to find a deterministic mapping function between the input features. Given a set of labeled training patterns (xi, yi), where xi∈ Rp, yi ∈ {+1, −1}, training a SVM classifiers involves finding a maximum-margin hyper plane that divides positive and negative training data samples. The hyper plane can be written as f(x) = w . x + b, where “.” denotes the dot products, w is a normal vector and b is a bias term. In case of the training data are not linearly separable, a kernel function is used to map the non-linearly separable data into a higher-dimensional space and thus the data are assumed to be linearly separable. Given any two sample observation in the input space (xi, xj), the kernel function can be written as a dot product of two feature vectors into high dimensional feature space K(xi, xj) = Φ(xi)T Φ(xj). In this paper, we used Gaussian Radial-Basis Function (RBF) as a kernel function for our support vector machine classifier:
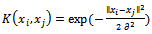 | (3) |
2.7. Epitope Surface Patches Prediction Algorithm
- Given the antigen structure, all of its surface residues are generated, and hence all its corresponding surface patches are obtained. The normalized relative solvent accessibility and B-Factor features are calculated for each residue in the surface patch, and hence each surface patch is represented by a vector of dimensions Nx2 where (N is the patch size). A prediction score is associated with each surface patch based on the support vector machine scores for the feature vectors. The top three non-overlapping surface patches with highest prediction scores are generated where no two surface patches have more than 50% residues overlap Figure 2.Figure 3 shows the flow chart of the prediction algorithm.
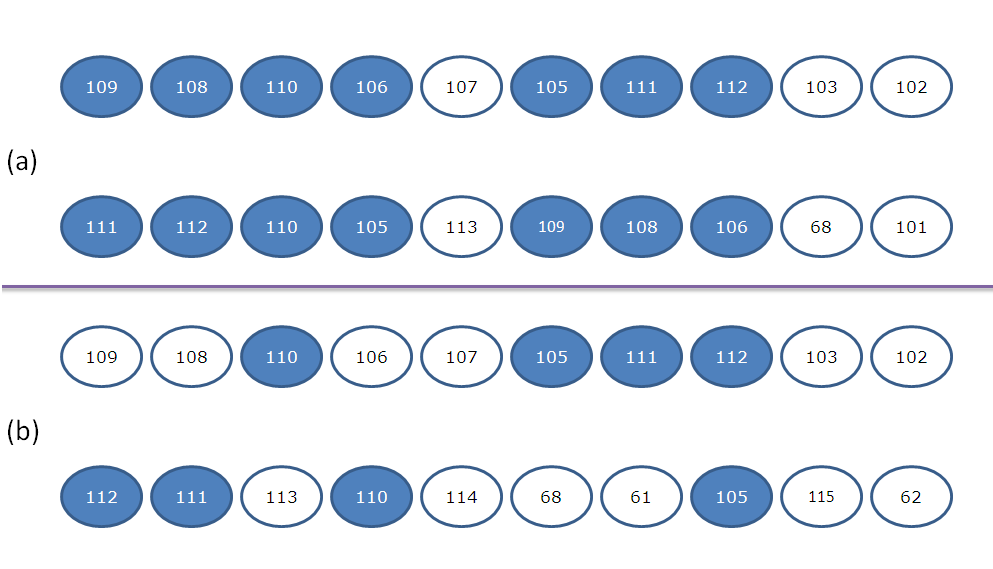 | Figure 2. Overlapping/ non overlapping surface patches. (a) Overlapping surface patches. (b) Non overlapping surface patches |
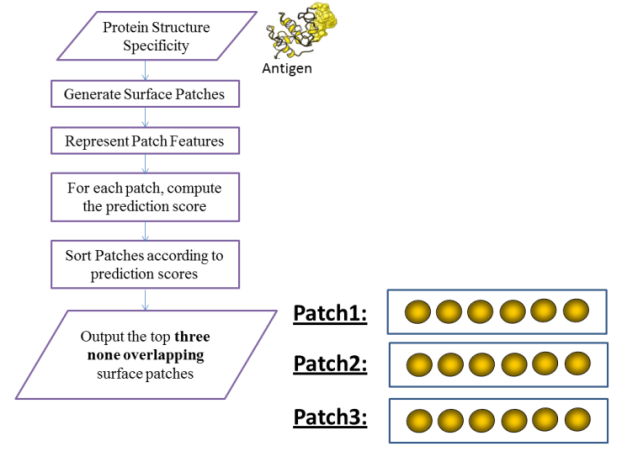 | Figure 3. PatchTope Prediction Algorithm |
2.8. Accuracy Measures Using the Independent Testset
- For each antigen structure chain in the independent test set, all the surface patches are obtained. For each surface patch, the number of epitope residues is calculated. The surface patch which holds the maximum number of epitope residues over all surface patches generated from the antigen structure is defined as the epitope real surface patch. Figure 4 shows the process of determining the real surface patch.The top three predicted surface patches are generated using the prediction algorithm. For each predicted surface patch, the relative overlap with the real epitope surface patch is calculated using the following equation:
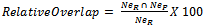 | (4) |
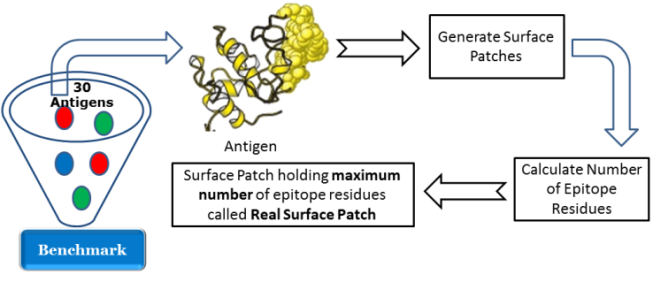 | Figure 4. Determining the real surface patch |
3. Results
3.1. Analysis of Antibody Interacting Sites
- In order to understand whether the B-cell epitope residues are located on the surface of the protein structure, we analyzed the Pernille et al.’s dataset to find distributions of the amino acid preference of epitope and non-epitope residues. As shown in Figure 5, most of epitope amino acid residues like Asparagine, Glycine, Arginine, Lysine, Aspartic, and Threonine are polar (Hydrophilic in nature) while most of the non-epitope amino acid residues like Cysteine, Phenylalanine, Methionine, Alanine, and Tryptophan are hydrophobic (non-polar). It is known that the hydrophobic amino acid residues are not accessible to the solvent while the polar and charged amino acid residues are accessible to the surface of the molecule and are in contact with the solvent[6].
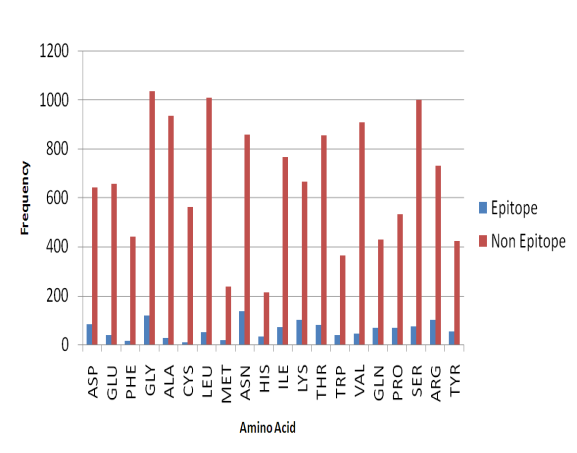 | Figure 5. Amino acid preference of epitope and non-epitope residues |
3.2. Prediction Results of Fivefold Cross Validation
- Support vector machine model based on Gaussian Radial-Basis Function (RBF) kernel has been developed using the combination of the two antigen structural features (relative solvent accessibility and B-factor). The features are represented by a vector of dimension Nx2 (N is the patch size and equals to 20 residues). The surface patches were generated for each antigen structure in the 75 antigen chains of Pernille et al.’s dataset. Fivefold cross validations were conducted on the five antigen groups of Pernille et al.’s dataset[41]. For each run, one group was left out for testing, while the remaining four groups were used for training. The average area under receiver operator characteristics curve for the 5 antigen groups reached a maximum of 0.894.
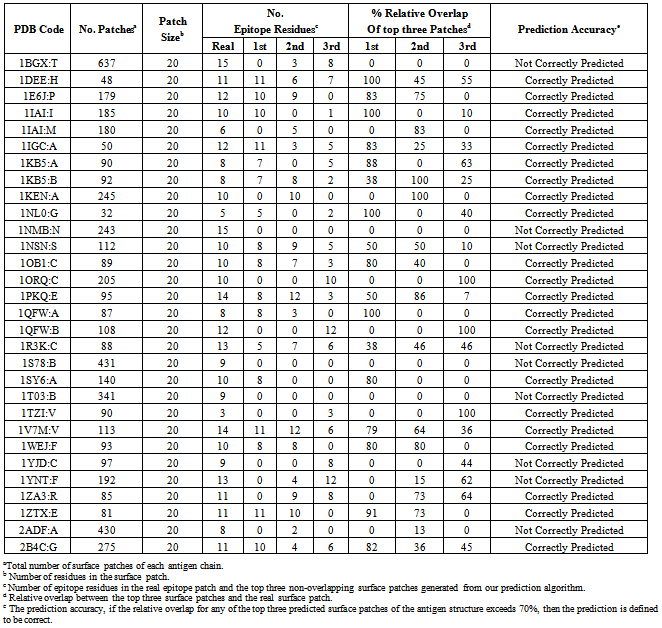
3.3. Prediction of Antigenic Patches in Benchmark Dataset
- The benchmark dataset is used to independently evaluate our model for predicting the antigenic surface patches from the protein antigens. The 75 antigen chains of the Pernille et al.’s dataset are used to train our SVM model, while we predict the antigenic surface patches of the 30 antigen chains generated from the Ponomarenko et al.’s dataset after removing sequence identity. After applying our prediction algorithm it is observed that 70% of the antigen chains were correctly predicted Table 1. We obtained an area under receiver operator characteristics curve (AUC) of 0.809.
|
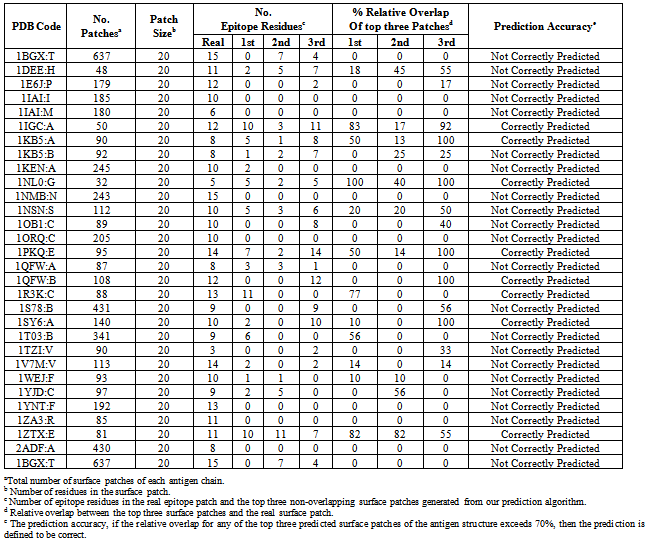
3.4. Comparisons with a Protein-Protein Interaction Server
- Sharp2[30] is a web server for predicting protein-protein interaction sites on the surface of the 3D structure of a protein. The protein interacting sites may be an identical protein, a different protein that is larger, a different protein that is smaller, or an antibody. The user friendly web server enables the scientists to choose the protein interacting sites, and hence the algorithm parameters for predicting protein-protein interaction sites are changed accordingly[35]. For each antigen chain in the benchmark dataset, the protein interacting surface patches have been downloaded using Sharp2 web server with parameters: (protein type = Type D; Interacting partner is an antibody; and patch size = 20). The surface patches predicted from the antigen chain are ranked based on the patches with highest combined scores. The top three non-overlapping surface patches with highest combined scores are generated where no two surface patches have more than 50% residues overlap. For each antigen chain in the benchmark dataset, the relative overlap of each surface patch in the top three non-overlapping surface patches with the real epitope surface patch is calculated. We observed that only 28% of the antigen chains were correctly predicted (Table 2). Comparing this prediction accuracy in the Ponomarenko et al.’s dataset with our model reveals that identifying the antigenic determinant sites in the protein surfaces using the antigen structural information outperforms the traditional protein-protein interaction algorithms to predict the interacting sites in the protein surfaces.
|
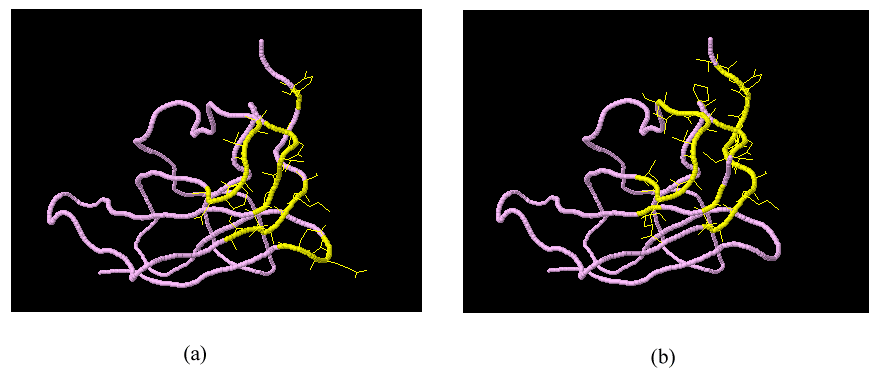 | Figure 6. Visualization of prediction results from complex (PDB ID: 1ZTX, Chain ID: E)(a) Actual epitope residues determined in the benchmark epitope dataset. (b) Predicted epitope surface patch |
3.5. Visualization of Predicted Patches for an Example
- To illustrate the effectiveness of our method, we choose a chain complex (PDB ID: 1ZTX, Chain ID: E) from the benchmark dataset as an example to visualize the predicted surface patch which holds the maximum number of epitope residues in the chain complex. We compare the residues of the predicted epitope surface patch with the actual epitope residues determined in the benchmark epitope dataset. (Figure 6) shows that the predicted surface patch identified by our classifier holds most of the epitope residues in the protein complex structure (11 out of 16 epitope residues). The predicted surface patch can then be used in vaccine development.
3.6. Patch Tope Implementation
- PatchTope is a user friendly web-based bioinformatics tool for the prediction of the antigenic epitope surface patches which hold the most epitope residues in the given antigen protein structure. The server is developed using Java Servlet and HTML. The user may submit the antigen structure by entering its PDB-Id or uploading a structure file in a PDB format. Moreover, the user may enter the chain Id for the protein chain of interest and then click on submit button. For the given antigen structure, the surface accessible residues are extracted, and each one defines a surface patch. For each surface patch, the feature vector is generated by computing the relative solvent accessibility of each residue using NACCESS[34] program, and extracting the B-Factor feature from the PDB file. The generated surface patches are then passed as input to the trained support vector machine model (one by one). The top three non-overlapping surface patches with highest prediction scores are generated where no two surface patches have more than 50% residues overlap. 3D view of the antigen structure is generated using JMOL[42] and the predicted surface patch residues are marked as yellow color for each predicted surface patch according to the user selection. PatchTope requires Netscape v6.0 or Internet Explorer v6.0 or higher and Java script enabled. The web-server is freely available at http://www.fci.cu.edu.eg:8080/PatchTope/.
4. Conclusions
- In this paper we propose a new computational method for predicting antigenic surface patches that interact with B-cell. Computing the relative overlapping of predicted patches with the real epitope patch in known structures of independent test set showed that structural information of the antigen chains can be used in predicting the protein interacting sites on the surface of the protein structure. Compared with popular prediction methods for predicting protein-protein interaction using patch analysis, our approach showed better performance in terms of prediction accuracy.
ACKNOWLEDGEMENTS
- It is a pleasure to thank Dr: Yasser EL-Manzalawy for his great support and help. He provided encouragement, sound advice, and lots of good ideas during the long useful discussions which made this work possible.Additionally, we thank the faculty of computers and information, Cairo University for publishing PatchTope web server in its domain.